HAL Id: hal-02573610
https://hal.univ-lorraine.fr/hal-02573610
Submitted on 14 May 2020HAL is a multi-disciplinary open access archive for the deposit and dissemination of sci-entific research documents, whether they are pub-lished or not. The documents may come from teaching and research institutions in France or abroad, or from public or private research centers.
L’archive ouverte pluridisciplinaire HAL, est destinée au dépôt et à la diffusion de documents scientifiques de niveau recherche, publiés ou non, émanant des établissements d’enseignement et de recherche français ou étrangers, des laboratoires publics ou privés.
Elasto-viscoplastic tensile behavior of as-forged Ti-1023
alloy: Experiments and micromechanical modeling
Safaa Lhadi, Ravi Raj Purohit Purushottam Raj Purohit, Thiebaud Richeton,
Nathalie Gey, Stéphane Berbenni, Olivier Perroud, Lionel Germain
To cite this version:
Safaa Lhadi, Ravi Raj Purohit Purushottam Raj Purohit, Thiebaud Richeton, Nathalie Gey, Stéphane Berbenni, et al.. Elasto-viscoplastic tensile behavior of as-forged Ti-1023 alloy: Experiments and micromechanical modeling. Materials Science and Engineering A- Structural Materials Properties Microstructure and Processing, Elsevier, 2020, 787 (139491), �10.1016/j.msea.2020.139491�. �hal-02573610�
1
Elasto-viscoplastic tensile behavior of as-forged Ti-1023 alloy: experiments and
micromechanical modeling
Safaa LHADI1,2, Ravi raj purohit PURUSHOTTAM RAJ PUROHIT1,3, Thiebaud RICHETON*1,2 ,
Nathalie GEY1,2, Stephane BERBENNI1,2, Olivier PERROUD1,2, Lionel GERMAIN1,2
1Laboratoire d’Étude des Microstructures et de Mécanique des Matériaux, Université de Lorraine, CNRS, Arts
et Métiers Paris Tech, LEM3, F-57000 Metz, France.
2Laboratory of Excellence on Design of Alloy Metals for Low-mAss Structures (DAMAS), Université de
Lorraine, France.
3Institut de Recherche Technologique Materiaux, Metallurgie, Procedes (IRT M2P), 4 Rue Augustin Fresnel,
57070 Metz, France.
*Corresponding author:email address: thiebaud.richeton@univ-lorraine.fr, tel: +33 3 72 74 78 02
Abstract
This works focused on the mechanical behavior of an ‘as-forged’ Ti-1023 alloy used in airframe forging applications. Its microstructure, characterized by SEM and EBSD, was composed by 15% of primary αp
nodules (2-5 µm in size) embedded in millimeter long β grains partially fragmented into equiaxed β subgrains of 5-10 µm. Further neutron diffraction analysis indicated an almost random β texture. Tensile tests at differents strain rates were performed. A very low strain rate sensitivity was observed. The contribution of each phase to the overall mechanical behavior was numerically investigated by a two-phase elasto-viscoplastic self-consistent (EVPSC) model with affine-type linearization. Internal stresses arising from elastic and plastic strain incompatibilities were analyzed. Throughout the mechanical loading, {100}β oriented grains were more
deformed than {111}β grains and all the α nodules. The onset of plasticity occurred sequentially in the β phase,
initially in {110}β grains followed by {111}β and then {100}β ones. The effect of the crystallographic texture
on slip activity was also studied through simulations made with a synthetic rotated cube β texture, typical of β-working, while considering α textures in Burgers Orientation Relationship (BOR) with the β phase or being random.
Keywords : near β titanium; tensile behavior, elastic anisotropy; elastic/plastic incompatibilities; EVPSC
modeling; crystal plasticity
1. Introduction
Near β titanium alloys like Ti-1023 are competing with quasi-α or α/β titanium alloys for airframe forging applications like landing gears, turbine engines, and rotor systems. Thanks to transformation processes including β and α/β forging before aging, excellent mechanical properties are achieved at room temperature. Their microstructures are multiscale and therefore the relationships between the microstructure and the mechanical behavior are complex. In near-β Ti-alloys, the retained β phase represents up to 40% of the volume which is higher than in conventional α/β alloys [1]. Therefore, the contribution of the β phase to the mechanical behavior should be investigated in detail. Furthermore, the β phase is reported to exhibit high elastic anisotropy. It was recently highlighted that the elastic anisotropy in near β alloys can have a strong influence on the development of internal stresses that may lead to the heterogeneous development of plastic activity and then initiate cracks [2]. In a previous study on a β quenched Ti-5553 [3], it was shown that the elastic anisotropy of the β phase may induce strong incompatibility stresses at the end of the elastic regime depending on the single-crystal elastic constants used in the model. As these incompatibility stresses depend on grain orientation, the initiation and development of plastic deformation are highly heterogeneous. It was also shown
2
that the elastic anisotropy of the β phase affects slip activity by promoting {112}<111> slip systems over {110}<111> ones [4].
To understand the role of the β phase on the material’s behavior, the Single-crystal Elastic Constants (SEC) should reflect the real elastic behavior of the β phase. However, the published SEC in the literature for β-Ti (BCC) spans over a large range of values [2, 5–15]. The Zener anisotropy coefficient [16] ranges from 1 to 8. These discrepancies may be due to the various chemical compositions and thermo-mechanical treatments of the studied Ti alloys but also to the difficulty to exactly measure SEC in multiphase polycrystalline specimens. The SEC identified by Martin [14], Petry et al. [7] and Raghunathan et al. [11] give very different Zener anisotropy coefficients (of 2.4, 3 and 8.3, respectively) but all lead to Young moduli close to the measured one for a β quenched equiaxed microstructure (E=68GPa). In a two-phase α+β Ti alloy, the SEC of the phase are expected to be different from those of a β quenched alloy because of the difference of composition due to element partitioning.
The understanding of the mechanical behavior of near β Ti-alloys requires the investigation of the interaction between the α and β phases. In particular, the phase is generally much stiffer than the phase. In addition, the plastic behaviors of both phases, especially in terms of critical resolved shear stresses on slip systems and anisotropy, are also completely different. Hence, the α phase induces together with the β phase, elastic and plastic incompatibility stresses that are responsible for strain-hardening as well as the heterogeneous onset of plasticity which may lead to crack initiation. Indeed, significant cracks have been observed for these alloys after failure originating from basal slip activity in the α nodules [17, 18]. In addition, these effects can be amplified by the presence of a pronounced crystallographic texture [17]. For instance, slip activity of α nodules in a β metastable Ti-5553 alloy with bimodal microstructure was observed to depend on the crystallographic orientation of the β region where they are embedded in [17]. This dependence was also investigated from numerical simulations of the plastic behavior of α nodules with random texture embedded in differently oriented β grains [19]. In particular, in {001}β oriented grains, the model predicted the onset of
plasticity in favorably orientated α nodules despite much higher critical resolved shear stresses than the grains [19]. Furthermore, the orientation spread within the β grains was also seen to have a significant effect on the plastic behavior of α nodules [19].
The present study focuses on the tensile behavior at different strain-rates of a Ti-1023 alloy with a simplified nodular microstructure and a random texture. In addition to the experimental characterization of this alloy by tensile tests, neutron source, Scanning Electron Microscope (SEM) and Electron BackScatter Diffraction (EBSD), the purpose of this work is to theoretically investigate the contribution of each phase to the overall mechanical behavior. The effect of elastic anisotropy of both phases is discussed in terms of the development of elastic/plastic incompatibility stresses, their consequences on the onset of plasticity in both β and α phases and slip activity in specific grain subsets. Also, the role of crystallographic texture on the onset of plasticity and slip activity of both phases is investigated. The crystallographic texture indeed influences both the macroscopic behavior and the local grain interactions. For this purpose, a sharp {001}<110> rotated cube texture for the phase, which can be typically obtained from some β-working processes [1, 20–24], is considered in order to differentiate from the random texture observed for our alloy. Moreover, two extreme situations are studied for the texture in this case: a strong α texture obtained by assuming that the α phase formed with variant selection and in Burgers Orientation Relationship (BOR) with the surrounding β phase and a weak random α texture.
The theoretical study uses an advanced elasto-viscoplastic self-consistent model (EVPSC) with affine linearization of the viscoplastic flow rule and a 1-site self-consistent approximation which has been recently formulated thanks to the translated field method [25]. This model was previously applied to commercially pure -titanium alloys [26] as well as to β quenched Ti-alloys [3, 4, 19]. It is extended here to a two-phase polycrystalline Ti-1023 alloy.
The paper is organized as follows. Section 2 deals with the elaboration and characterization of the simplified Ti-1023 microstructure and describes the performed tensile tests. Section 3 is devoted to a brief description of the EVPSC model, along with the single-crystal plasticity constitutive equations. Model
3
parameters and their identification are reported in Section 4. EVPSC results are presented and discussed in Section 5. Concluding remarks follow in Section 6.
2. Experimental work and results 2.1. Material and heat treatment
The investigated material is the near β titanium alloy Ti-10V-2Fe-3Al, hereafter denoted Ti-1023. The β-transus of this alloy is about 800°C. The as-received material was a forged billet in the ‘as-aged state’. Its microstructure was bimodal with primary α nodules (called αp) and secondary α needles (called αs) embedded
in a β matrix. It was obtained by different forging/annealing steps in the β and α/β domain (as-forged state) followed by an aging step at 500°C (as-aged state).
For our modelling purposes, the microstructure was simplified to come back to the as-forged state. Thus, the material was further solution treated at 760°C for 1 hour followed by water quenching to suppress the secondary αs needles. The formation of phase during quenching cannot be totally excluded. However,
no phase was not detected in our samples by X-ray diffraction. The final microstructure is composed of 15% of equiaxed αp nodules in the β matrix (see Figure 1).
2.2. Microstructure and texture
Small specimens were prepared by chemical polishing using a standard colloidal silica suspension (OPS + 10% H2O2) solution to enable a successful EBSD characterization of the microstructure. SEM
observations of several cross-sections confirmed the absence of secondary αs precipitates. Metallographic
examinations were performed using Light Optical Microscopy (LOM), Back-Scattered Electron imaging (BSE) and Electron Back-Scattered Diffraction analysis (EBSD). For EBSD measurements, a JEOL JSM-6500F electron microscope equipped with the camera Nordlys-S was employed. Several EBSD maps with 0.5 µm step size were carried out along the cross-section to characterize the microstructure and the textures of α and β phases.
The α phase volume fraction was measured to be 15%. The microstructure was composed of millimeter long prior β grains elongated in the Z-direction (axial direction of the billet). They were partially fragmented into equiaxed β subgrains of 5-10 µm size. Primary αp nodules were present both within β grains and at the
prior β grain boundaries. The α nodules were mostly equiaxed with a size of 2-5 µm. EBSD and BSE micrographs of the microstructure are shown in Figure 1. The macrotextures of the β phase were measured using a 6 T1 Thermal Neutron Four-Circle diffractometer on a 1cm3 sample at Laboratoire Léon Brillouin (LLB), France. The texture index was 1.2, indicating a random crystallographic texture (Figure 2). The α texture was not measured by Neutron Diffraction and cannot be inferred directly from the local EBSD analyses. However the global α texture is expected to be almost random given that the β texture is random. Comparison of {0001}α and {110}β pole figures obtained from different EBSD maps supported this
assumption (see two examples in Figure 1). In general all the {0001}α poles overlapped a {110}β pole but with
a very large spread. This is due to a remaining trace of the Burgers Orientation Relationship (BOR) between both phases.
4
Figure 1- Typical microstructure of the ‘as-forged’ Ti-1023 alloy. Top left: a cross-sectional IPF map of the
β phase along the Z direction (axial direction of the billet) which is normal to the EBSD map. Top right: two Back-Scattered Electron (BSE) images where grey regions correspond to β subgrains and black ones to α nodules. Bottom: stereographic projections of the {110} and {0001} pole figures in two typical regions corresponding to prior β grains.
Figure 2- Pole figures of the β phase of the ‘as-forged’ Ti-1023 alloy measured by neutron diffraction showing
a random texture (texture index=1.2).
2.3. Mechanical testing
Cylindrical specimens with 6.35 mm diameter and 20 mm length have been machined along the Z direction for tensile tests. The tensile tests were performed on a ZWICK Z250 machine with a force cell of
5
250 kN and a contact extensometer. Samples were deformed at constant crosshead velocity up to fracture with initial strain rates of 2 × 10⁻³ s-1 (specimen A), 2 × 10⁻⁴ s-1 (specimen B) and 2 × 10⁻⁵ s−1 (specimen C). The tests at 2 × 10⁻⁴ s-1 and 2 × 10⁻⁵ s−1 were repeated twice on samples taken in close areas of the billet and shown tensile properties within 2% scatter. The experimental engineering stress-strain curves are reported in Figure 3. The estimated Young’s modulus, yield stress, ultimate tensile strength (UTS) and elongation at failure (A%) are deduced from these curves and are listed in Table 1. The measured Young moduli vary between 76 and 80 GPa, the yield stresses are around 800 MPa and the maximum elongation before fracture is about 13%. The stress-strain curves of the ‘as-forged’ Ti-1023 alloy are compared with the ones obtained for a β quenched equiaxed grains Ti-5553 alloy [31] (Figure 4). As expected, the Young’s modulus of the studied Ti-1023 alloy is higher than the one measured for the β quenched Ti-5553 alloy (68 GPa) due to the presence of αp nodules
that reinforce the mechanical behavior. Furthermore, the tensile strength is reached very early in specimens A and B at strains 3.3 and 3.25%, respectively. For the lowest strain rate specimen C, the tensile strength is reached only at 9.7%. The overall hardening rate of this alloy is relatively low.
Besides, it is worth recalling that during the deformation of Ti-1023 alloys, the metastable β phase may transform into a stress-induced orthorhombic martensite ” [27–30]. The triggering stress for this transformation depends on several parameters like temperature, grain-size [28], strain-rate [29], texture, as well as morphology and volume fraction of phase [30]. The effect of stress-induced martensite transformation is generally visible on a simple tensile curve as it is associated with a typical double yielding or strain plateau region [27–30]. No such features or change of slope can be observed before necking in the present stress-strain curves (Figure 3). Therefore, the stress-induced martensite transformation β → ” is supposed to be a minor deformation mode in our samples and is not considered in the modeling (see next section).
Figure 3- Experimental tensile engineering stress/strain curves of the ‘as-forged’ Ti-1023 alloy for three strain
6
Table 1- Mechanical characteristics of the ‘as-forged’ Ti-1023 alloy estimated from the tensile curves. Strain rate (s-1) Young’s
Modulus (GPa) Yield stress at 0.2% (MPa) UTS (MPa) Uniform elongation (%) A(%) A 2×10⁻³ 76.3 799 881 3.3 12.5 B 2×10⁻⁴ 77.7 800 878 3.25 13 C 2×10⁻⁵ 79.7 770 888 9.7 13.1
Figure 4- True tensile stress/strain curves: comparison of the strain rate sensitivity between the‘as-forged’
Ti-1023 alloy and a β quenched Ti-5553 [31]. The true stress-true strain responses are plotted for strain rates 2×10⁻³ and 2×10⁻⁴s-1.
3. Elasto-viscoplastic self-consistent modeling (EVPSC) and crystal plasticty
The advanced elasto-viscoplastic self-consistent model (EVPSC) considers an affine linearization of the viscoplastic flow rule. In this approach, the 1-site self-consistent approximation is formulated thanks to the ‘translated field (TF) method’, which is not detailed here (see [3, 25, 26] for details). Such a micro-macro scale transition model is well suited to model disordered materials like two-phase polycrystalline aggregates. Indeed, the EVPSC model can account for crystal elasticity and plasticity of both phases, crystallographic texture as well as strain rate effect in contrast with elastoplastic self-consistent (EPSC) schemes which are rate-independent, as for example the one employed in [11]. The polycrystal is represented by a large number of grains characterized by their crystallographic orientation, volume fraction, morphology and phase (α or β in the present study). It is noteworthy however that in the present one scale transition scheme, both α and β grains are heterogeneities at the same microscopic scale and interact with the homogeneous equivalent medium which is the polycrystal containing both phases at the millimeter scale. Therefore, the α grains are not embedded in a pure β matrix phase but are interacting directly with the homogeneous equivalent medium. As outputs, the EVPSC code provides the ‘local’ behaviors (at the scale of the grain orientations) and the ‘overall’ or ‘effective’ behavior (at the scale of a Representative Volume Element of the polycrystalline
7
aggregate). Both are related through the so-called ‘strain (or stress) concentration equations’ described in [25,3]. The EVPSC model, which was previously applied to β quenched Ti-alloys [3], is now used and extended to a two-phase polycrystalline Ti-1023 material.
Let us briefly describe the single crystal plasticity laws employed for both α and β phases. Within the infinitesimal strain hypothesis, the total local strain rate relative to an elasto-viscoplastic behavior can be decomposed as follows:
𝛆̇ = 𝛆̇𝐞+ 𝛆̇𝐯𝐩 (1)
with 𝛆̇𝐞 = 𝐬: 𝛔̇ from the generalized Hooke’s law where 𝐬 (= 𝐜−1) is the local elastic compliance tensor, and 𝛆̇𝐯𝐩 is given by a nonlinear viscoplastic constitutive flow rule that depends on the Cauchy stress tensor 𝛔. Both α and β single crystals are supposed to be elastic-viscoplastic where plastic strain and rotation result from crystallographic slips on specific systems s. The slip rates γ̇s in both α and β single crystals are described by the constitutive viscoplastic law developed by Méric et al. [32, 33]:
γ̇s = ⟨|τ
s− xs| − rs
Κ𝑠 ⟩ n𝑠
sign(τs− xs) (2)
where 〈x〉 = max(x, 0) and τs is the resolved shear stress, τs = 𝐑𝐬: 𝛔 with 𝐑𝐬 the symmetric Schmid orientation tensor. In this study, xs and rs are supposed to be associated with kinematic and isotropic hardening states. Their expressions are given by:
xs = csαs with α̇s = γ̇s (3) and
rs = r 0
s (4)
Κ𝑠 and n𝑠 are two material coefficients characterizing the viscous effect. cs is a kinematic hardening parameter.
At the grain level, the viscoplastic strain rate is given by the sum on all slip systems N:
𝛆̇𝐯𝐩= ∑ 𝐑𝐬γ̇s
N
s=1
(5)
whereas the viscoplastic spin tensor is given by:
𝛚̇𝐯𝐩= ∑ 𝐒𝐬γ̇s N
s=1
(6)
where 𝐒𝐬 is the skew-symmetric Schmid orientation tensor. The material parameters n𝑠, Κ𝑠, r0s, cs and N are
specific to the phase and slip family. They are given and discussed in the next section (see Table 4).
4. Model parameters
The microstructure is composed of β grains for a volume fraction of 85% and primary αp nodules for
15%. The β phase and the α phase are represented by 2000 and 5000 grains with uniform volume fraction, respectively. For both phases, grains are considered to be spherical. The crystallographic texture is assumed random, as observed experimentally, which implies more orientations for the α phase with HCP structure than the β phase with BCC structure. The used numbers of grains are enough to describe correctly the experimental random texture (i.e. response insensitive to the direction of the tensile test). Each grain is actually assigned to a different crystallographic orientation defined by a set of Euler angles (φ1, φ,φ2). These angles are determined as follows [34]:
φ1 = 2π𝑟1 φ = arccos (2𝑟3− 1)
φ2 = 2π𝑟2
8
where (𝑟1,𝑟2,𝑟3) are numbers randomly generated within the range [-1, 1]. The Euler angles are updated at
each time step from the elastic rotation tensor, computed as 𝛚𝐞 = −𝛚𝐯𝐩 [26], where 𝛚𝐯𝐩 is the viscoplastic rotation tensor (see its time derivative in equation (6)).
Besides, in the whole paper, the tensile loading direction is parallel to the Z axis. Therefore, in figures, only the 33-component of a given tensor is shown. For analysis of results in Section 5, grain subsets are also defined based on initial diffraction conditions: i.e., for a given {hkl} plane, if the plane normal of the grain defined in the specimen reference frame is initially aligned within ±5° of solid angle with the tensile axis, then that grain contributes to the grain subset. Hereafter, these grain subsets are denoted {hkl} for the phase or {hkil} for the phase.
4.1. Single-crystal elastic constants
Table 2 provides the values of the SEC for both α and β phases used in this study. These SEC were not directly measured on our alloy but were chosen from the literature. Among all the SEC reported for the β phase, we have selected those given by Petry et al. [7]. In fact, these SEC were measured on pure β Ti single crystals at elevated temperature but were already applied to model β quenched Ti-5553 alloys and predict its effective Young’s modulus (about 68 GPa) [31, 35] and the overall elasto-viscoplastic behavior [3, 4]. These SEC correspond to a Zener elastic anisotropy factor of A=3. They fit correctly the effective Young’s modulus measured for the present two-phase Ti-1023 alloy. A comparison between numerical results and experiments is shown in the next section.
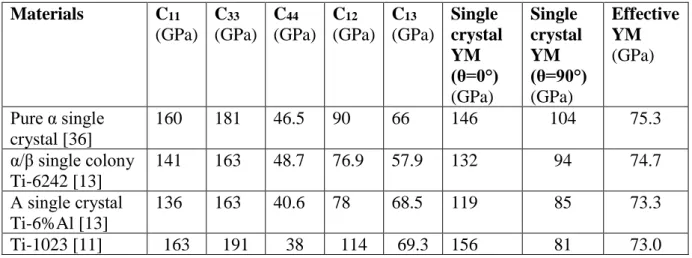
For the α phase, the SEC used in the model are the well-known ones taken from Hearmon et al. [36] which were directly measured on pure α-single crystals. Several SEC for α phase were also proposed in the literature for Ti-alloys. They are however generally obtained from indirect methods on polycrystalline samples by model/experiment comparisons [11, 13] and are thus subjected to significant uncertainties due to the high number of elastic constants to be fitted (5 SEC). Table 3 summarizes some of them and indicates the corresponding Young’s modulus at the scale of the α-single crystal for two orientations. The angle θ=0° means that the c-axis of the α single crystal is parallel to the tensile direction (TD) and θ=90° means that the c-axis is perpendicular to TD. For each set of SEC, Table 3 indicates also the effective Young’s modulus of the present two-phase α+β polycrystalline Ti-1023 alloy computed by the model. The effective Young’s modulus varies from 73 to 76 GPa. At the macroscopic scale, the influence of the α SEC is not observed since the volume fraction of α phase is low (15%) and its texture is random. However, the computed single-crystal Young moduli and the gap between θ=0° and θ=90° depend on the set of SEC.
Table 2- SEC of α and β phases used in this study.
Phase SEC (GPa) Refs.
C11 =160, C12 =90, C44=46.5, C33=181, C13=66 Hearmon et al. [36] β C11 =134, C12 =110, C44 =36 Petry et al. [7]
9
Table 3- SEC of Ti α phase from the literature. Using these SEC, the single crystal Young’s modulus (YM)
for axis c // TD (θ=0°), for c ∟TD (θ=90°) as well as the effective Young’s modulus for the Ti-1023 polycrystal of this study are computed.
Materials C11 (GPa) C33 (GPa) C44 (GPa) C12 (GPa) C13 (GPa) Single crystal YM (θ=0°) (GPa) Single crystal YM (θ=90°) (GPa) Effective YM (GPa) Pure α single crystal [36] 160 181 46.5 90 66 146 104 75.3 α/β single colony Ti-6242 [13] 141 163 48.7 76.9 57.9 132 94 74.7 Α single crystal Ti-6%Al [13] 136 163 40.6 78 68.5 119 85 73.3 Ti-1023 [11] 163 191 38 114 69.3 156 81 73.0 4.2. Viscoplastic parameters
Table 4 provides values of all viscoplastic parameters used in this work. The resulting elasto-viscoplastic response obtained by the EVPSC model fits well the experimental curves for the three strain rates as shown in Figure 5. For the β phase, {110}<111>, {112}<111> and {123}<111> slip systems are considered which corresponds to 48 possible systems. The value of ns, which is the inverse of the slip rate sensititivity, is
adjusted to describe the low strain rate sensitivity observed experimentally (see Section 2.3). The best agreement between numerical results and experimental curves is obtained when nβ=80 for all β phase slip
systems. In addition, the r0s parameter is set to 70 MPa for {110}<111> and {112} <111> slip systems (i.e.
the main active slip modes) and to 80 MPa for {123}<111> slip systems, which are supposed to be less active in BCC metals [37, 38]. As in the previous numerical study [3], a simple linear kinematic hardening at the scale of the slip system is chosen (equation 3) for which the values of cs for the different slip families are
identified from the stress/strain curve after the yield point. The cs parameter is set to 200 MPa for the
{110}<111> and the {112}<111> slip systems and to 400 MPa for {123}<111>, which is consistent with a low slip activity for this mode due to a stronger hardening. Note that the kinematic hardening parameter cs is
here used to describe, at the intra-granular level, the very low macroscopic hardening rate of the material during monotonous tensile loading and not during cyclic loading, which is here not studied. In order to be consistent with the generally lower strain rate sensitivity of α phase compared to β phase [39, 40], the ns parameter for the α phase is slightly higher than the one for the β phase (nα= 90). The contribution of α phase
to the overall strain hardening is not observed on the experimental tensile stress-strain curves when comparing the‘as-forged’ Ti-1023 alloy to a β quenched Ti-5553 (see Figure 4). Furthermore, several simulations were performed with various hardening parameter cs (cs=0, 10, 100 and 1000 respectively) for the phase and the effect on the macroscopic stress-strain curve was found to be negligible. Thus, cs=0 is considered for all α slip
systems.
For the α phase single-crystalline behavior, 24 slip systems, corresponding to 3 basal, 3 prismatic, 6 pyramidal <a> and 12 1st order pyramidal <c+a> systems, are considered. It is assumed that twinning does not occur in the studied alloy due to the high amount of Al in the phase [11, 41]. Parameters Κ𝑠 and r0s are given
in Table 4. These parameters are estimated in such a way that they fit well the experimental tensile stress-strain curves and are consistent with the observations of basal and prismatic slip bands in α nodules [17, 18, 42]. Hence, the considered basal/prismatic critical resolved shear stress (CRSS) ratio (considering here a CRSS defined by the quantity r0+K from Eq. (2)) is about 0.93 in agreement with the value found
experimentally by Hémery and Villechaise [17] and Duval [42] on Ti-5553 alloys. However, it should be underlined that the phase chemical compositions of the presently studied ‘as-forged’ alloy are different from those of the aged alloys used in the works of Hémery and Villechaise [17] and Duval [42]. Therefore, this comparison should be taken with care. For the α phase, parameter Κ𝑠 is a little lower than the one for the β phase. The low activity of pyramidal slip is taken into account in the model by using higher CRSS values for
10
pyramidal slip systems. As shown in Figure 6, not only the elastic behavior but also the viscoplastic behavior of the α phase is different from the effective behavior, in particular, due to the higher CRSS considered for α slip systems compared to β ones.
Table 4- Viscoplastic parameters of the β and α phases for each slip system family (48 slip systems for β
(BCC) phase and 24 slip systems for α (HCP) phase) used in the simulations.
Figure 5- Comparison between experimental and predicted macroscopic true stress-true strain response of
the‘as-forged’ Ti-1023 alloy at strain rates 2×10⁻³ s-1 (a), 2×10⁻⁴ s-1 (b) and 2×10⁻⁵ s-1 (c).
phase Slip family 𝐧𝒔 𝚱𝒔(𝐌𝐏𝐚. 𝐬𝟏/𝐧) 𝐫 𝟎𝒔(𝐌𝐏𝐚) 𝐜𝒔(𝐌𝐏𝐚) {110} <111> 80 300 70 200 {112} <111> 80 300 70 200 {123} <111> 80 300 80 400 α phase Basal 90 270 215 0 Prismatic 90 270 251 0 Pyramidal <a> 90 270 435 0 Pyramidal <c+a> 90 270 620 0
11
Figure 6- Effective stress-strain response of the ‘as-forged’ Ti-1023 alloy at strain rate 2×10⁻³ s-1 compared to the stress-strain responses of β phase and α phase.
5. Model results and discussion
5.1. Incompatibility stresses in β and α phases
Incompatibility stresses have both elastic and plastic origins. In the elastic regime, incompatibility stresses arise from the heterogeneity of the elastic moduli of the grains due to both elastic anisotropy and the presence of two different phases. The incompatibility stresses given in this section are defined as the difference between the local mean stress σ33 in a grain and the applied macroscopic stress Σ33. Figures 7a shows the
predicted incompatibility stresses in all β grains as a function of the macroscopic strain. Incompatibility stresses increase linearly with the macroscopic strain in the elastic domain, then decrease progressively at the onset of plasticity (internal stress relaxation due to plasticity).
It is interesting to see how incompatibility stresses of some grain subsets evolve with the applied loading. Therefore, incompatibility stresses in three representative subsets defined respectively, by {111}β,
{100} β and {110} β, are plotted in the same figure. The grain subset {111}β (blue points), {100}β (red) and
{110}β (green) are illustrated in Figure 7c. Note that the incompatibility stress of a grain subset corresponds
to the average of all points of the subset. Note also that a grain subset always represent the same set of grains even if diffraction conditions can be lost for some of the grains due to elastic rotations. For β phase, incompatibility stresses have a positive contribution in {111}β grains (i.e. local stresses higher than the overall
stress or tensile internal stresses) and a negative one in {100}β (i.e. compressive internal stresses) throughout
the loading. This behavior originates from the difference of elastic moduli, {111}β being the stiffest orientation
among the phase and {100}β the most compliant one during the elastic regime. Local stresses in {110}β
grains are the closest to the macroscopic stress compared to {111}β and {100}β. In addition to Figure 7a, the
distribution of incompatibility stresses as a function of the β grain orientation is given at E33=0.02 in Figure
7e. Note that the highest local stresses are achieved in {111}β but plasticity occurs first in {110}β grains due
12
Figure 7- Incompatibility stresses in all β grains (a) and in α nodules (b) as a function of the macroscopic
tensile strain for a strain rate of 2×10⁻³s-1 (shaded regions). The average response by phase is shown in solid black line for the phase and dotted black line for the phase. The colored lines give the average incompatibility stresses of different grain subsets of β and α. The numbers in the legend correspond to the effective number of grains in each grain subset. IPF in the Z direction of the 2000 β orientations (c). {111}β,
{100}β and {110}β grain subsets (considering ±5° around Z) are colored in blue, red and green, respectively
(c). IPF in the Z direction of the 5000 α orientations (d). {0001}α, {10-10}α and {2-1-10}α grain subsets
(considering ±5° around Z) are colored in blue, red and green, respectively (d). Average values of incompatibility stresses at E33=0.02 plotted in the standard triangle, respectively for the orientations of the β
13
Incompatibility stresses in all α nodules are given in figure 7b together with those predicted for {0001}, {10-10}α and {2-1-10}α grain subsets. The three α subsets considered in this study are illustrated in
Figure 7d. Unlike the β phase, the predicted incompatibility stresses of α nodules are all positive during loading (i.e. tensile internal stresses) irrespective of the nodule orientation. Regarding this issue, let’s recall that the predicted elastic moduli of all α nodules are between 104 and 146 GPa whereas the effective elastic modulus of the alloy is 75.3 GPa (see Table 3), mostly dictated by the β phase due to its large volume fraction (85%). In the elastic regime, the lowest incompatibility stresses are achieved in {10-10}α and {2-1-10}α subsets.
Nevertheless, in the plastic regime, incompatibility stresses in {10-10}α and {2-1-10}α are not the weakest
ones (see Figure 7b). Figure 7f shows the distribution of incompatibility stresses for the α orientations at E33=0.02. Note that incompatibility stresses start to decrease as soon as the grain deformation becomes plastic.
The highest incompatibility stresses are achieved in {0001}α throughout the loading. Knowing that the strain
of {0001}α grains does not become plastic (see Section 5.2), the noticeable decrease of incompatibility stresses
in {0001}α (from E33=0.4, see Figure 7b) should be explained by a Poisson’s effect given the difference of
behavior between the elastic {0001}α nodules and the effective behavior which is almost incompressible in
the plastic regime. Furthermore, it is interesting to explain the difference of incompatibility stress evolutions between {10-10}α and {2-1-10}α grain subsets. Indeed, considering perfectly oriented {11-20}α and {10-10}α
grains, the evolution should be the same as both grains have the same stiffness tensor and the same distribution of initial Schmid factors on slip systems. However, it is reminded that subsets of grains are defined within ±5° of solid angle with the ideal orientation and that grains are rotating during the simulations. Hence, a slight deviation from a {11-20}α orientation has not the same consequence as a slight deviation from a {10-10}α
orientation. In the present case, it actually appears that grains of the {10-10}α subset deviate more and more
from the ideal orientation, which is not the case for grains belonging to the {11-20}α subset. This explains the
difference between the {11-20}α and {10-10}α curves.
5.2. Plastic strain evolutions
Figures 8a and 8b (zoom of 8a) simultaneously show the evolution of the average plastic strains along the tensile axis in {100}β, {110}β , {111}β, {0001}α, {10-10}α and {2-1-10}α grain subsets with respect to the
macroscopic strain. Additionally, the average plastic strains of the overall β and α phases are given in the same figure. It is observed that for a random texture, the β phase first reaches plasticity. Furthermore, plasticity in the β phase sequentially progresses. The onset of plasticity starts in {110}β, then in {111}β and finally in
{100}β oriented grains due to their low local stress σ33 (Figure 7a). This sequential onset of plasticity in the β
phase is in agreement with the in-situ XRD observations on the forged Ti-1023 with a same microstructure as the present study [11]. For the α phase, plastic strain occurs in the {10-12} oriented grains (not shown) and then progresses eventually to {10-10}α and {2-1-10}α. From figure 8b, an interesting result is observed: plastic
strain in α phase starts before the occurrence of plasticity in the {111}β and {100}β grains. Besides, due to the
high CRSSs considered for pyramidal slip, the nodules {0001}α remain elastic throughout the loading since
14
Figure 8-Average plastic strain of β and α phases versus applied strain at strain rate 2×10⁻³ s-1. The average plastic strain of different β and α grain subsets are given too (a). For more legibility, the zoom of plastic strain between E33=0.01 and 0.03 is given in (b).
5.3. Study of β and α phase slip activity
Figure 9a shows that {112}<111> slip systems are predominant at the onset of plasticity and remain so throughout the loading. The parameter Φ designates the relative slip activity of a β phase slip family defined as follows: Φ =∑ ∑ fg|γ̇g s| q s=p Nβ g=1 ∑ ∑Nss=1fg|γ̇gs| Ng g=1 (8)
where fg is the grain volume fraction, Ng the total number of grains, Nβ the total number of β grains, p and q
are the first and the last slip system number of the family and Ns the total number of slip systems of each phase (Ns=48 for β and Ns=24 for α phase). It is shown that {112}<111> slip systems are more active than
{110}<111> ones. The initial preference can be attributed to the elastic anisotropy of the β phase since both families have the same material parameter values (Table 4) and a macroscopic Schmid factor analysis shows that there is no marked preference between these two slip system families for a random texture (see [4]).
15
Figure 9- Relative activities of β phase slip system families (dimensionless) as a function of the macroscopic
plastic strain predicted by the EVPSC model at strain rate 2×10⁻³s-1.
The contribution of the α phase to the overall plasticity given by Ф* (see equation (9)) is given with respect to the macroscopic plastic strain in Figure 10a. In equation (9), Nα designates the total number of α
nodules. Note that the parameter Ф* corresponds to the sum of the relative slip system activities of the four considered α-slip families.
Φ∗ =∑ ∑ fg|γ̇g s| Ns s=1 Nα g=1 ∑ ∑Nss=1fg|γ̇gs| Ng g=1 (9)
It is shown that the contribution of α phase to the overall plasticity is less than its volume fraction (15%°. Also, the α phase contribution globally tends to increase with the strain rate. This effect can be explained by the slightly lower strain rate sensitivity considered for α phase compared to phase (Table 4) and by a complex competition between basal and prismatic slip systems.
From the analysis of α phase slip activity (Figure 10b), only basal and prismatic slip systems are active. The parameter Φ′ designates the relative slip activity of an α phase slip system family with respect to the α phase only (see equation 10). Basal slip is predominant at the onset of plastic deformation compared to the prismatic one. The contribution of basal systems to α phase slip activity remains predominant throughout the loading (more than 50%), although the relative contributions of basal and prismatic slips are very close at high strains. Figure 10b reveals that basal slip systems are more active than prismatic ones with the increase of strain rate up to 4% overall plastic strain although the same strain rate sensitivity is considered for both slip system families (Table 4). After 6% of overall plastic strain, there is an opposite trend (see Figure 10b).
Φ′ =∑ ∑ fg|γ̇g s| q s=p Nα g=1 ∑Nαg=1∑Nss=1fg|γ̇gs| (10)
16
Figure 10- Contribution of α phase to the overall plasticity for different strain rates (a). Basal and prismatic
slip activities dependence on the strain rate (b).
5.4. Influence of the crystallographic texture
The effect of texture was assessed by comparing the previous results to the behavior of a textured sample. A sharp {001}<110> β texture typical from β-working [1, 20–24] was discretized using ATEX software [43] (see the crystallographic pole figures in Figure 11). This rotated cube texture was actually measured on a Ti-1023 alloy of another study [1] and had a texture index of 3.8 [44]. Since the α texture was not measured, it was chosen to model two extreme situations: a very strong and a very weak α texture (a realistic situation lies certainly somewhere in between these two extreme cases). The strong α texture was obtained by assuming that the α phase formed with variant selection and in BOR with the surrounding β phase. This was generated from the rotated cube β texture using the β→α transformation model of Stanford and Bate [45] with a k parameter of 105 to account for the variant selection. The weak α texture was modeled as a random one (see equation 7).
17
Figure 11- Rotated β cube crystallographic texture plot as stereographic projections of the {110}, {111} and
{100} pole figures (top). The texture of the α phase modeled from the β one assuming BOR and variant selection (bottom).
Figure 12a compares the macroscopic stress-strain responses. At the macroscopic scale, the effect of the rotated cube β texture on the elastic-viscoplastic behavior is obvious. The effective Young’s modulus drops down to 65.3 GPa, the elasto-viscoplastic transition is sharper and the flow stress at a given strain is lower compared to the random β texture. The effect of the α texture on the effective elasto-viscoplastic behavior is less noticeable macroscopically since the α volume fraction is low (15%). However, the presence of a sharp or a weak α texture modifies slip activity. The contribution of α phase to the overall plasticity (equation 9) for the three cases is presented in Figure 12b. When the α texture is in BOR with the rotated cube β texture, the contribution of α phase slip activity reaches 15% at the onset of plasticity. Irrespective of texture, the rotated cube β texture favors the α phase slip activity at start. The latter can be explained by globally less favorable Schmid factors in the β grains and a more compliant elastic behavior compared to a random β texture. This is confirmed by Figure 13 which shows a delayed initiation of plasticity of the β grains with a rotated cube texture compared to random one. From a Schmid factor analysis, it can also be noticed that the texture in BOR with β is favorable for basal slip (Figure 12c). Therefore, the relative slip activity of basal slip family is more important throughout the loading when the α texture is in BOR (Figure 12d). Another consequence of the rotated cube texture is noticeable on the onset of plasticity between both phases, which is illustrated in Figure 13. In contrast with the case β/α random textures where plastic strain evolution is much higher in the β phase than in from the initiation of plasticity, plastic strain evolution is more or less similar in both phases at start with a rotated cube β texture. For a rotated cube β texture and in agreement with Figure 12b, it is also observed that the difference of mean plastic strain between and phases is lower when the texture is in BOR with .
18
Figure 12- Macroscopic stress-strain curves predicted for three textures: rotated β cube texture with α random
(blue), rotated β cube texture with α in BOR (pink) and β/ α random (black) (a). Contribution of α phase slip activity and dependence on the texture (b). Cumulative distributions F(X ≥ X0) of maximum Schmid factors
for basal and prismatic systems when α texture is random and cube, i.e. F(X ≥ X0) designate the fraction of
grains having a Schmid factor equal or higher than X0 (c). Relative α phase slip activity as a function of the
19
Figure 13- Plastic strain of β and α phases versus applied strain. Numerical results are predicted for three
textures: rotated cube β texture and α random (blue), rotated cube β texture with α in BOR (pink) and both β and α random textures (black).
6. Conclusions
An EVPSC model was applied to theoretically investigate the elasto-viscoplastic tensile behavior of a two-phase polycrystalline near β Ti-1023 alloy. As found experimentally, the simulations considered a microstructure containing 15% of equiaxed primary α nodules mixed with equiaxed β grains and a random texture for both phases. Both α and β phases were considered elastically and plastically anisotropic. The elastic constants were selected among the wide choice given in the literature in such a way that they reproduce correctly the macroscopic elastic response. The viscoplastic parameters were chosen to fit the experimental tensile behavior performed at three different strain rates. A remarkable low strain rate sensitivity was observed experimentally for this alloy. It was successfully reproduced in the simulation by considering a high value of the inverse of the slip rate sensitivity at the scale of the slip systems for both phases. The CRSS given for α phase slip systems agree with the litterature considering a basal/prismatic CRSS ratio of 0.93 [17]. The main results are briefly recalled below:
1) Incompatibility stresses due to elasto-viscoplastic intergranular accommodation are present for both β and α phases. In the elastic regime, they arise from the heterogeneity of the elastic moduli of the grains due to both elastic anisotropy and the presence of two different phases. Incompatibility stresses have a positive contribution in {111}β grains and a negative one in {100}β throughout the
loading. For the α phase, incompatibility stresses of α nodules are all positive during the loading due to both higher elastic moduli of nodules and higher CRSS considered for α slip systems compared to β ones. The highest incompatibility stresses are reached for the stiffest orientation {0001}. Due to the high CRSSs considered for pyramidal slip, this orientation remains purely elastic throughout the loading since it is completely unfavorable for both basal and prismatic slip.
20
2) The onset of plasticity occurs in the β phase with a strong load transfer to the α nodules. The plastic deformation of the β phase is sequential: it starts in {110}β grains followed by {111}β and then
{100}β ones which are the most compliant in the elastic regime. However, the plasticity of the α
phase begins before {111}β and {100}β grains.
The effect of the crystallographic texture was also investigated. Simulations made with a synthetic rotated cube β texture coupled with a strong or a weak texture were compared to the one with randomly distributed β/ textures. The weak texture corresponded to random orientations whereas the strong one was in Burgers Orientation Relationship (BOR) with the rotated cube β texture. Two interesting results are summarized below:
3) Compared to random texture, the rotated cube β texture is favorable for α phase slip activity irrespective of the texture.
4) When the α texture is assumed to result from variant selection in BOR with a rotated cube β texture, basal slip activity is promoted compared to the case of a rotated cube β texture coupled with a random α texture.
Acknowledgments: The authors are thankful to Dr. Julien Capelle (University of Lorraine-LEM3) for his
support for the mechanical tensile tests. The authors also thank the Laboratoire Léon Brillouin (France) for beam time allocation and Sebastien Gautrot (LLB, France) for his help during the experiments. This work was supported by the “Région Grand Est” and by the French State through two programs operated by the National Research Agency (ANR), (1) “Investment in the future” referenced by ANR-11-LABX-0008-01 (Laboratory of Excellence “DAMAS”: Design of Alloy Metals for low-mAss Structures) and (2) “Plan d'Investissement d'Avenir” (PIA) in the frame of a research program managed by "Institut de Recherche Technologique Matériaux, Métallurgie, Procédés" (IRT M2P).
References
[1] M. R. Chini, L. Germain, N. Gey, S. Andrieu, T. Duval, « Advanced Microtexture Analysis of A Ti 10-2-3 Product for Better Understanding of Local Variations in Mechanical Behavior », in Proceedings of the 13th World Conference on Titanium, John Wiley & Sons, Inc., 2016, p. 1943–1948.
[2] V. Hounkpati, S. Fréour, D. Gloaguen, V. Legrand, J. Kelleher, W. Kockelmann, S. Kabra, « In situ neutron measurements and modelling of the intergranular strains in the near-β titanium alloy Ti-β21S », Acta Mater., vol. 109, p. 341-352, 2016, doi: https://doi.org/10.1016/j.actamat.2016.02.065.
[3] S. Lhadi, S. Berbenni, N. Gey, T. Richeton, et L. Germain, « Micromechanical modeling of the effect of elastic and plastic anisotropies on the mechanical behavior of -Ti alloys », Int. J. Plast., vol. 109, p. 88-107, 2018, doi: https://doi.org/10.1016/j.ijplas.2018.05.010.
[4] S. Lhadi, M.-R. Chini, T. Richeton, N. Gey, L. Germain, S. Berbenni, « Micromechanical Modeling of the Elasto-Viscoplastic Behavior and Incompatibility Stresses of β-Ti Alloys », Materials, vol. 11, no 7, 2018, doi: 10.3390/ma11071227.
[5] E. S. Fisher, D. Dever, « Relation of the c′ elastic modulus to stability of b.c.c. transition metals », Acta Metall., vol. 18, no 2, p. 265-269, 1970, doi: http://dx.doi.org/10.1016/0001-6160(70)90033-7.
[6] C. N. Reid, J. L. Routbort, et R. A. Maynard, « Elastic constants of Ti–40 at.% Nb at 298 °K », J. Appl. Phys., vol. 44, no 3, p. 1398-1399, 1973, doi: 10.1063/1.1662365.
[7] W. Petry, A. Heiming, J. Trampenau, M. Alba, C. Herzig, H. R. Schober, G. Vogl, « Phonon dispersion of the bcc phase of group-IV metals. I. bcc titanium », Phys Rev B, vol. 43, no 13, p. 10933–10947, mai 1991, doi: 10.1103/PhysRevB.43.10933.
21
[8] H. Ledbetter, H. Ogi, S. Kai, S. Kim, M. Hirao, « Elastic constants of body-centered-cubic titanium monocrystals », J. Appl. Phys., vol. 95, no 9, p. 4642-4644, 2004, doi: 10.1063/1.1688445.
[9] S. Fréour, D. Gloaguen, M. François, A. Perronnet, R. Guillén, « Determination of single-crystal elasticity constants in a cubic phase within a multiphase alloy: X-ray diffraction measurements and inverse-scale transition modelling », J. Appl. Crystallogr., vol. 38, no 1, p. 30–37, 2005, doi: 10.1107/S0021889804023441.
[10] S. Fréour, E. Lacoste, M. François, R. Guillén, « Determining Ti-17 β-phase single-crystal elasticity constants through X-ray diffraction and inverse scale transition model », Materials Science Forum, 2011, vol. 681, p. 97-102.
[11] S. L. Raghunathan, A. M. Stapleton, R. J. Dashwood, M. Jackson, D. Dye, « Micromechanics of Ti– 10V–2Fe–3Al: In situ synchrotron characterisation and modelling », Acta Mater., vol. 55, no 20, p.
6861-6872, 2007, doi: http://dx.doi.org/10.1016/j.actamat.2007.08.049.
[12] M. Tane et al., « Peculiar elastic behavior of Ti–Nb–Ta–Zr single crystals », Acta Mater., vol. 56, no 12, p. 2856-2863, 2008, doi: http://dx.doi.org/10.1016/j.actamat.2008.02.017.
[13] J.-Y. Kim, S. I. Rokhlin, « Determination of elastic constants of generally anisotropic inclined lamellar structure using line-focus acoustic microscopy », J. Acoust. Soc. Am., vol. 126, no 6, p. 2998-3007, 2009, doi: 10.1121/1.3245032.
[14] G. Martin, « Simulation numérique multi-échelles du comportement mécanique des alliages de titane bêta-métastable Ti5553 et Ti17 », PhD Thesis, Ecole nationale supérieure des Mines de Paris, 2012. [15] J. Nejezchlebová, M. Janovská, H. Seiner, P. Sedlák, M. Landa, J. Šmilauerová, J. Stráský, P. Harcuba,
M. Janeček, « The effect of athermal and isothermal ω phase particles on elasticity of β-Ti single crystals », Acta Mater., vol. 110, p. 185-191, 2016, doi: http://dx.doi.org/10.1016/j.actamat.2016.03.033. [16] C. M. Zener, S. Siegel, « Elasticity and Anelasticity of Metals. », J. Phys. Colloid Chem., vol. 53, no 9,
p. 1468-1468, 1949, doi: 10.1021/j150474a017.
[17] S. Hémery, P. Villechaise, « Influence of β anisotropy on deformation processes operating in Ti-5Al-5Mo-5V-3Cr at room temperature », Acta Mater., vol. 141, p. 285-293, 2017, doi: https://doi.org/10.1016/j.actamat.2017.09.023.
[18] F. Bridier, P. Villechaise, J. Mendez, « Slip and fatigue crack formation processes in an α/β titanium alloy in relation to crystallographic texture on different scales », Acta Mater., vol. 56, no 15, p. 3951-3962, 2008, doi: https://doi.org/10.1016/j.actamat.2008.04.036.
[19] R. R. P Purushottam raj purohit, S. Lhadi, N. Gey, O. Castelnau, T. Richeton, L. Germain, S. Berbenni, « Stress partitioning in a near-β Titanium alloy induced by elastic and plastic phase anisotropies: experimental and modeling », in The 14th World Conference on Titanium, Nantes, France, 2019, hal-02381002.
[20] G. Lütjering, « Influence of processing on microstructure and mechanical properties of (α+β) titanium alloys », Mater. Sci. Eng. A, vol. 243, no 1, p. 32-45, 1998, doi: https://doi.org/10.1016/S0921-5093(97)00778-8.
[21] S. L. Semiatin, « An Overview of the Thermomechanical Processing of α/β Titanium Alloys: Current Status and Future Research Opportunities », Metall. Mater. Trans. A, janv. 2020, doi: 10.1007/s11661-020-05625-3.
[22] N. Gey, M. Humbert, M. J. Philippe, Y. Combres, « Investigation of the α- and β- texture evolution of hot rolled Ti-64 products », Mater. Sci. Eng. A, vol. 219, no 1, p. 80-88, 1996, doi: https://doi.org/10.1016/S0921-5093(96)10388-9.
[23] A. L. Pilchak, S. Srivatsa, N. C. Levkulich, V. Sinha, E. J. Payton, S. L. Semiatin, « Characterizing and Modeling the Precursors to Coarse Grain Formation during Beta-Annealing of Ti-6 Al-4V », in The 14th World Conference on Titanium, Jun 2019, Nantes, France.
[24] C.-T. Nguyen, M. Balzer, T. Witulski, M. Böhm, M. Preuss, J. Quinta da Fonseca, « Understanding the β-phase texture development in Ti-6Al-4V during compression in the α+β regimes », in The 14th World Conference on Titanium, Jun 2019, Nantes, France.
[25] C. Mareau, S. Berbenni, « An affine formulation for the self-consistent modeling of elasto-viscoplastic heterogeneous materials based on the translated field method », Int. J. Plast., vol. 64, p. 134-150, 2015, doi: http://dx.doi.org/10.1016/j.ijplas.2014.08.011.
22
[26] K. E. K. Amouzou, T. Richeton, A. Roth, M. A. Lebyodkin, T. A. Lebedkina, « Micromechanical modeling of hardening mechanisms in commercially pure α-titanium in tensile condition », Int. J. Plast., vol. 80, p. 222-240, 2016, doi: https://doi.org/10.1016/j.ijplas.2015.09.008.
[27] T. W. Duerig, J. Albrecht, D. Richter, P. Fischer, « Formation and reversion of stress induced martensite in Ti-10V-2Fe-3Al », Acta Metall., vol. 30, no 12, p. 2161-2172, 1982, doi: https://doi.org/10.1016/0001-6160(82)90137-7.
[28] A. Bhattacharjee, S. Bhargava, V. K. Varma, S. V. Kamat, A. K. Gogia, « Effect of β grain size on stress induced martensitic transformation in β solution treated Ti–10V–2Fe–3Al alloy », Scr. Mater., vol. 53, no 2, p. 195-200, 2005, doi: https://doi.org/10.1016/j.scriptamat.2005.03.039.
[29] X. Ma et al., « Strain rate effects on tensile deformation behaviors of Ti-10V-2Fe-3Al alloy undergoing stress-induced martensitic transformation », Mater. Sci. Eng. A, vol. 710, p. 1-9, 2018, doi: https://doi.org/10.1016/j.msea.2017.10.057.
[30] C. Li, X. Wu, J. H. Chen, S. van der Zwaag, « Influence of α morphology and volume fraction on the stress-induced martensitic transformation in Ti–10V–2Fe–3Al », Mater. Sci. Eng. A, vol. 528, no 18, p. 5854-5860, 2011, doi: https://doi.org/10.1016/j.msea.2011.03.107.
[31] A. Settefrati, « Étude expérimentale et modélisation par champ de phase de la formation de alpha dans les alliages de titane bêta-métastable », PhD Thesis, Université de Lorraine, 2012.
[32] L. Méric, P. Poubanne, G. Cailletaud, « Single Crystal Modeling for Structural Calculations: Part 1— Model Presentation », J. Eng. Mater. Technol., vol. 113, no 1, p. 162-170, janv. 1991, doi: 10.1115/1.2903374.
[33] L. Méric, G. Cailletaud, « Single Crystal Modeling for Structural Calculations: Part 2—Finite Element Implementation », J. Eng. Mater. Technol., vol. 113, no 1, p. 171-182, janv. 1991, doi: 10.1115/1.2903375.
[34] A. Morawiec, « Orientations and Rotations Computations in Crystallographic Textures », Springer, 2004.
[35] N. Clément, « Phase transformations and mechanical properties of the Ti-5553 beta-metastable titanium alloy », PhD Thesis, UCL - FSA/MAPR - Département des sciences des matériaux et des procédés, 2010.
[36] R. Hearmon, « The elastic constants of crystals and other anisotropic materials », 1984.
[37] C.R. Weinberger, B.L. Boyce, C.C. Battaile, « Slip planes in bcc transition metals », Int. Mater. Rev., vol. 58, p. 296–314, 2013, doi: https://doi.org/10.1179/1743280412Y.0000000015
[38] P. Castany, M. Besse,T. Gloriant, In situ TEM study of dislocation slip in a metastable titanium alloy, Scripta Mater., vol. 66, p. 371–373, 2012, doi:10.1016/j.scriptamat.2011.11.036
[39] Z. Zhang, T.-S. Jun, T. B. Britton, F. P. E. Dunne, « Determination of Ti-6242 α and β slip properties using micro-pillar test and computational crystal plasticity », J. Mech. Phys. Solids, vol. 95, p. 393-410, 2016, doi: http://dx.doi.org/10.1016/j.jmps.2016.06.007.
[40] Z. Zheng, S. Waheed, D. S. Balint, F. P. E. Dunne, « Slip transfer across phase boundaries in dual phase titanium alloys and the effect on strain rate sensitivity », Int. J. Plast., vol. 104, p. 23-38, 2018, doi: https://doi.org/10.1016/j.ijplas.2018.01.011.
[41] A. Fitzner, D.G.L. Prakash, J.Q. da Fonseca, M. Thomas, S.-Y. Zhang, J. Kelleher, P. Manuel, M. Preuss, « The effect of aluminium on twinning in binary alpha-titanium », Acta Mater., vol. 103, p. 341-351, 2016, doi:http://dx.doi.org/10.1016/j.actamat.2015.09.048
[42] T. Duval, « Analyse multi-échelles des relations microstructure/propriétés mécaniques sous
sollicitation monotone et cyclique des alliages de titane β-métastable », PhD Thesis, Ecole Nationale Supérieure de Mécanique et d’Aérotechnique, 2013.
[43] B. Beausir, J.-J. Fundenberger, « ATEX-software,Analysis Tools for Electron and X-ray diffraction ». Université de Lorraine, 2018.
[44] H.-J. Bunge, Éd., « Preface to the English Edition », in Texture Analysis in Materials Science, Butterworth-Heinemann, 1982, p. vi-viii.
[45] N. Stanford, P. S. Bate, « Crystallographic variant selection in Ti–6Al–4V », Acta Mater., vol. 52, no 17, p. 5215-5224, 2004, doi: https://doi.org/10.1016/j.actamat.2004.07.034.