HAL Id: hal-02396259
https://hal.archives-ouvertes.fr/hal-02396259
Submitted on 12 Dec 2019HAL is a multi-disciplinary open access archive for the deposit and dissemination of sci-entific research documents, whether they are pub-lished or not. The documents may come from teaching and research institutions in France or abroad, or from public or private research centers.
L’archive ouverte pluridisciplinaire HAL, est destinée au dépôt et à la diffusion de documents scientifiques de niveau recherche, publiés ou non, émanant des établissements d’enseignement et de recherche français ou étrangers, des laboratoires publics ou privés.
Black Co oxides coatings for thermosensitive polymer
surfaces by low- temperature DLI-MOCVD
Thomas Duguet, Eliane Amin-Chalhoub, Diane Samélor, Alessandro Pugliara,
Constantin Vahlas
To cite this version:
Thomas Duguet, Eliane Amin-Chalhoub, Diane Samélor, Alessandro Pugliara, Constantin Vahlas. Black Co oxides coatings for thermosensitive polymer surfaces by low- temperature DLI-MOCVD. Surface and Coatings Technology, Elsevier, 2018, �10.1016/j.surfcoat.2018.05.087�. �hal-02396259�
*Manuscript
Black Co Oxides Coatings for Thermosensitive Polymer Surfaces by
Low-Temperature DLI-MOCVD
Thomas Duguet*, Eliane Amin -Chalhoub, Diane Samélor, Alessandro Pugliara Constantin Vahlas
CI R I MA T , CNRS, Université de Toulouse , France
Abstract. Black coatings are deposited at low temperature in order to enable the functionalization of thermosensitive substrates, such as epoxy-based carbon fiber reinforced polymers (CFRP). The direct liquid injection metalorganic chemical vapour deposition of Co oxide films is performed with the dicobalt octacarbonyl precursor, Co2(CO)8, in the temperature range 50°C - 160°C, on Si substrates, first. Films morphology can be
described by a dense sublayer on which the typical “cauliflower” microstructure grows, with a large amount of voids and open porosity. We obtain nanocrystalline CoO in the deposition temperature range 50°C - 125°C, and nanocrystalline (CoO + Co3O4) above 125°C. The bulk composition of the films is Co(45)O(45)C(10). Over the
deposition temperatures tested, films processed at 125°C repetitively show the lowest reflectivity in the visible range. An important role in the optical reflectivity is attributed to the carbon content, although it is not possible to decorrelate microstructural changes from the carbon elimination in calcination experiments. Finally, we reproduce the above-mentioned results with success on CFRP substrates, and demonstrate the applicability of the process on thermosensitive composite parts with results comparable to the state-of-the-art in the visible range. 1. Introduction
Cobalt oxide based versatile materials with high surface to volume ratios have attracted substantial research effort in the last twenty years because of their potential applications in various key enabling technologies [1]. Their promising optical [2], magnetic [3], (photo-)catalytic [4, 5], sensing [6], electrochromic [7], energy storage [8] and capacitance [9] functionalities find their origin in the appropriate combination of their electronic and morphological properties. The latter depend on the technique used for their production and on the corresponding process conditions. By tuning surface reactivity, and nucleation and growth modes, chemical vapor deposition (CVD) allows precise monitoring of the microstructure and the morphology of the processed coatings and films. This advantage has been considered in the production of cobalt oxide films and nanostructures [10-16]. However, such infatuation for the CVD of cobalt oxides also reveals that these processes require appropriate chemical routes and engineering to provide materials with the targeted functionalities (see Ref[2] and references therein). This situation also prevails in the investigation of low reflectivity, cobalt oxide films that are used in optical instruments with the purpose of noise attenuation, namely reduction of the stray effect and scattered light in different spectral domains [17]. In this perspective, the authors recently reported the successful, low temperature, CVD processing of black CoO films on silicon [2]. Deposition at low temperature was necessary since the targeted application of the process is the surface functionalization of carbon fiber reinforced polyepoxies (CFRP) composite materials. It was made possible by the use of dicobalt octacarbonyl, Co2(CO)8 as precursor. Co2(CO)8, a solid compound humidified in hexane, was transported to the deposition area by sublimation, in the absence of reactive gas, e.g. oxygen. The reflectivity of the obtained films was as low as 2-5 % and this promising value was attributed to the columnar, fractal, cauliflower-type morphology, a specificity offered by CVD as compared to other deposition techniques. Despite this successful demonstration, it was not possible to elaborate a process operating in a parametric window large enough to allow deposition of films with stable physicochemical and microstructural characteristics, thus providing reproducible high performance optical properties. One of the reasons for this was the sublimation technology adopted for the feeding of the reactor with precursor. Indeed, the thermal sensitivity of Co2(CO)8 which is required for low temperature processing on one hand, presents the drawback of limited shelf life of the compound in the sublimation conditions, on the other hand, with subsequent chemical and morphological modifications of the batch stored in the sublimator. Consequently, the precursor feeding rate decreases during the run, from one run to the other and between different runs, though using similar precursor loads [18].
Considering at the same time the demonstrated potential of the cobalt oxide films as black coatings, and the above reported drawbacks, we present in this contribution the results of a new CVD process for the deposition of low reflective cobalt oxide films. We use the direct liquid injection (DLI) technology which allows to overcome problems of uniform precursor delivery by dispensing a solution of precursor into the reactor. Ideally the solvent will evaporate quickly upon entering the vaporization chamber leaving the gas phase precursor to deposit the desired film on the substrate. An advantage of this approach results from the fact that the precursor is maintained at a lower temperature (where it is stable) until it reaches the vaporization chamber. While one remains limited by the equilibrium vapor pressure, this is now higher due to the higher temperature of the vaporization chamber. Nonetheless, problems can develop if supersaturation leads to formation of precursor particles or if the large quantity of solvent used results in film contamination. These aspects are also considered in this work.
2. Materials and Methods
10x20 mm2 silicon (0.5 mm thick) and CFRP composite (1 mm thick) coupons are used as substrates. Synthesis and preparation of the composite coupons can be found elsewhere [19]. Si coupons are cut from 4” Si (100) wafers (Sil’tronix). All substrates are cleaned in detergent, rinsed with water, acetone and ethanol, then dried in Ar flow, and finally baked at 60 °C for 20 min before introduction into the reactor. Si substrates are weighted before and after deposition in order to estimate the equivalent film thickness.
The 0.07M precursor solution is prepared by dissolving Co2(CO)8 powder (Alfa Aesar, stabilized in 1-10vol.% hexane) in anhydrous heptane (99%, Sigma Aldrich) in an Ar glovebox. Then, the Schlenk flask is connected to the injection system and purged several times with pressurized N2 (99.9999%, Praxair). Direct liquid injection (DLI) of the solution is carried out with a Kemstream Vapbox® system at a flow rate of 1 mL/min. The solution enters the mixing chamber where 99.9999% pure N2 (Air Products) is flowed at 200 standard cubic centimeters per minute (sccm). In addition, 120 sccm of 99.99 % pure O2 (Air Products) can be introduced at the entry of the deposition zone. The working pressure is regulated at 5 Torr. Deposition is performed in a horizontal, cylindrical cold wall reactor composed of a glass tube of 50 mm in diameter and 800 mm in length. Inside, a stainless steel sample holder is heated by a resistive coil gyred on its bottom surface. The surface deposition temperature (Td) is regulated with a K-type thermocouple attached to a dummy epoxy sample. It is worth noting that in these conditions the surface temperatures of Si or Epoxy are equal ±5°C.
Finally, in an attempt to understand the role of the C content on the reflectivity, calcination experiments are performed at annealing temperatures (Tc) of 400°C, 800°C, and 1000°C, for 1h in a furnace with flowing air.
Samples surface morphology and roughness are observed using scanning electron microscopy (SEM) on a LEO 435VP instrument. Cross section micrographs are prepared and observed with a FEI Helios 600i station composed of a focused ion beam (FIB) and a field emission gun (FEG) SEM operated at 5 kV. Cross sections are obtained by first depositing a 50x3x2 µm3 platinum protective layer on the surface. Transmission electron microscopy (TEM) imaging is performed using a JEOL JEM 2100F electron microscope operated at 200 kV. Diffraction patterns are recorded using selected area electron diffraction (SAED) mode with a 150 nm aperture. Crystallographic structures are also determined by X-ray diffraction
(XRD) on a SEIFERT-3000TT instrument using a Cu Kα (1.5418 Å) X-ray tube operated at 40 kV and 40
mA, a Ni filter and a solid-state Lynxeye detector. Compositions of the surface and the bulk of the films are determined with X-ray photoelectron spectroscopy (XPS) and Transmission Fourier transform infrared spectrometry (FTIR). XPS is performed on a Thermo Scientific K-Alpha instrument using monochromatic Al Kα (1486.6 eV) radiation. Depth profiling is performed by Ar+ ion etching (Ar+, 10 mA, 2kV). High resolution scans are obtained at constant pass energy of 30 eV with energy steps of 0.1 eV. FTIR experiments are performed with a Perkin Elmer Frontier-Microscope Spotlight400 Series. Spectra are
recorded in the 4000–400 cm-1 wavelength range with a 30 s scan accumulation and 4 cm-1 resolution. The
contribution of Si wafers is subtracted from the spectra and the baseline is subsequently corrected from interference fringes. Finally, the UV–Vis reflectance spectra are measured by a Perkin-Elmer Lambda-19 spectrophotometer equipped with an
integration sphere. The reflected light is collected in the directional-hemispherical geometry with an incidence angle of 8°.
3. Results and Discussion 3.1 The DLI-MOCVD Process
A first set of experiments with the DLI-MOCVD process is performed without O2 in the input gas
mixture. This leads to the formation of metallic Co films. It is worth recalling that the same O-free protocol
previously applied along with the sublimation of the humidified (Co2(CO)8 + 1-10% hexane) precursor led
to the formation of CoO [2]. From these former sublimation experiments, the atomic compositions of the films were all close to Co(44)O(44)C(12), in the form of stoichiometric CoO with C contamination. The
only consistent supply of oxygen came from the decomposition of the precursor carbonyls (CO → Cads +
Oads), hence if one tries to balance the post mortem stoichiometry (Co(44)O(44)C(12)) with elements
coming from carbonyls (1 Cads for 1 Oads), the Cads content is too low. Thus, it had to undergo surface
reactions to be eliminated. We assumed Fischer-Tropsch-like reactions that could be active in the synthesis of longer chain hydrocarbons. Moreover, there is a linear dependence on the rate of formation of stable
hydrocarbons with the amount of available Cads, in excess in these experiments [20]. In such a process, the
only source of hydrogen is hexane that has to undergo C-H bond activation to form longer organic chains or
to transform into alkene. Finally, the decomposition of Co2(CO)8 also produces an excess of carbonyls (1
Co for 4 (CO)), but they are likely consumed in the gas phase [21] and oxidized on the growing CoO, therefore eliminated in the form of
CO2(g) [22].
In the DLI experiments, we do not deposit Co oxide but metallic Co, instead. The only change is the use of a liquid solution of Co2(CO) 8 in heptane (0.1 mol/L) injected at a high flux. The growing Co surface is catalytic and the growth process is controlled by complex mechanisms for which we do not have an insight in the present work. Nonetheless, macroscopically, the surface kinetics is affected by this change in gas phase composition. A good illustration is the formation of an oxide on a sample that was placed downstream away from the metallic Co deposition zone (not shown). A large part of Co2(CO)8 has already been decomposed upstream in the deposition zone and consequently at that position its concentration in the gas phase is reduced, and may be close to the partial pressure of precursor prevailing in the sublimation process that leads to Co oxide deposition. Overall, we tentatively propose the occurrence of three global reactions to explain the deposition of metallic Co: (1) the catalyzed decomposition of CO → CO2 + Cads [23, 24], (2) the consumption of O in the catalyzed oxidation CO + 1/2O2 → CO2, and (3) a Fischer-Tropsch-like mechanism which partially consumes Cads.
In an attempt to stabilize the Co oxide, we added water vapor to the gas mixture (50 sccm of N2 bubbling in 0.1°C water). We observed a doubling of the growth rate, in conjunction with a decrease of the Co film resistivity (from 22 µOhm.cm without water to 6 µOhm.cm with water). We conclude that water enhances the deposition kinetics and cleans the film from contaminant by-products. The water gas shift reaction (CO + H2O
CO2 + H2) is likely responsible for this effect. Conversely, this confirms that CO and its by-products are responsible for the poor resistivity obtained without water.
Finally, we added O2 to the gas mixture, and again we could form black Co oxides-based films, similar to those obtained in the sublimation process, although with a different chemical scheme and kinetics. The growth rate now reaches two maxima: 1.7 µm/h at 50 °C, and 0.8 µm/h at 125 °C. These films are presented in the next sections below.
A significant advantage of the DLI-MOCVD process is the control of the precursor flow rate in a wide range, and the efficient use of the precursor, since the solution reservoir is stored and operated at room temperature. To the opposite, the flow rate of precursor in a sublimation process is limited and not well controllable, it varies with time, and it requires to heat the precursor over the whole experiment duration, hence accelerating degradation and agglomeration. Consecutively, films deposited from sublimed precursor were limited to a surface area of approximately 1 cm2 [2]. In contrast, due to the high precursor flux available, the deposition zone of the present DLI process was extended to approximately 2000 cm2. This is an important advantage of the DLI technology since it allows tailoring a coating process to treat large parts over a wide surface area.
3.2 Deposition on Si
Films processed on Si in the presence of O2 at Td = 50°C, 125°C, and 160°C, are visually matt and black. At Td = 75°C and 100°C, they are matt and gray, and they delaminate spontaneously. Except for XRD and EPMA results which present qualitative interest, these delaminated coatings are discarded for other characterizations.
The atomic composition of the coatings are determined by EPMA measurements on their surface. The average composition is 30 ±3 at.% Co, 47 ±6 at.% O, 23 ±6 at.% C and it is independent on Td. This is consistent with the results of Ye et al. who identified various carbonaceous species by X-ray photoelectron spectroscopy in Co-based CVD films processed in the same Td range from sublimated Co2(CO)8 [25]. Nonetheless, it is questioning that EPMA results suggest such a high amount of O. Hence, we double check the composition of the films by XPS depth profiling. Results are shown in Error! Reference source not found., where the atomic composition is plotted versus Ar+ etching duration.
INSERT FIGURE 1
The as-deposited film surface, which has been exposed to the atmosphere during its transfer from the DLI-MOCVD reactor to the XPS chamber, exhibits a high amount of C contamination (56 at.%). Ar+ sputtering is able able to remove this contamination layer entirely after about 700s. There, the atomic composition stabilizes and corresponds to the bulk composition of the film: Co(45)O(45)C(10). The god correspondence with the atomic composition of the films obtained by sublimation is noticeable.
We now analyze the different species within the contamination layer and within the film. Results are shown in Error! Reference source not found., with the high resolution spectra of the C1s, O1s, and Co2p1/2 core levels.
INSERT FIGURE 2
Before etching, two contributions of the O1s peaks (contamination 1 and 2) correspond to the C-O and C=O contributions of the C1s peak; both in terms of chemical shifts and of atomic percentage (10% total). After etching, there are 10% of C remaining which are composed of C-C, C=O, and Co carbides. And the O1s peak is divided into two components, O-I and O-II. O-II belongs to the CoO and Co3O4 oxides structures, whereas O-I arises from the reduction of O-II by the Ar+ ions during sputtering. Finally, based on Refs[26-29], we propose 7 contributions to decompose the Co2p1/2 peak in Fig.2e and f: metallic and/or carbidic Co at 793.3 eV (1), Co+III in octahedral sites at 795.3 eV (2) and its satellite at 803 eV (sat.2), Co+II in octahedral sites at 796.5 eV (3) and its satellite at 803.0 eV (sat.3), and Co+II in tetrahedral sites) at 798.0 eV (4) and its satellite at 804.0 eV (sat.4). By etching, the increase of the metallic/carbidic component and the joint decrease of the Co+III component only suggest the reduction of the oxide and the implantation of C because of Ar+ sputtering.
The crystallographic structures of the films are determined from the XRD diffractograms shown in Error! Reference source not found. for the different Td. The X-ray bands centered at 36.5°, 42.4°, 61.5°, 73.6°, and 77.5° correspond to (111) (200), (220), (331) and (222) planes of the cubic cobalt oxide (II) CoO phase. The XRD pattern of the film deposited at 50°C is composed of poorly defined peaks, both in position and intensity revealing poor crystallinity. Films deposited at 75°C and 100°C, show large X-ray reflections that mainly correspond to small CoO crystallites. Films deposited at 125°C and 160 °C show new X-ray reflections centered at 32.2°, 36.9°, 44.8°, 59.3°, and 65.2° that are attributed to small crystallites of the spinel oxide Co3O4 structure. Schmid et al. deposited cobalt oxide films by MOCVD from cyclopentadienylcobalt dicarbonyl CoCp(CO)2 in the range 200 °C - 600 °C. Films were composed of CoO for Td = 200 °C to 500 °C, and of Co3O4 for Td = 600 °C [30]. We assume that the difference with the present work in terms of temperature range, is mainly due to the difference of the initial Co oxidation degrees between the two precursors: 0 in Co2(CO)8, and +1 in CoCp(CO)2. Finally, the strong Si reflection at 55° has been removed of the 50°C and 75°C spectra for the sake of clarity.
INSERT FIGURE 3
To further explore the composition of the coatings we perform FTIR spectroscopy on the black coatings
deposited at Td = 50°C, 125°C, and 160°C. Results are summarized in the FTIR spectra in Figure 4. The
broad vibration bands centered at 3400 cm- 1 show that hydroxyl groups are present at all Td. Several peaks
from C-H (2960, 2925, 2860 cm-1) and C=C (1490, 1380 cm-1) confirm that residual by-products of
Co2(CO)8 are present in the films. The films deposited at 125°C and 160°C exhibit two absorption bands at
570 and 660 cm-1 that make us unambiguously identify the spinel Co3O4 structure
[31]. The band at 570 cm-1 corresponds to the BOB3 vibration in the spinel lattice, where B denotes the Co3+ cations in the octahedral positions. The band at 660 cm-1 corresponds to the ABO3 vibration, where A denotes Co2+ in the tetrahedral sites. At Td = 50°C, a large band is centered at 500 cm-1 that could be attributed to Co-O vibrations in CoO and/or to defects in the Co oxides structures [31, 32]. Overall, the FTIR measurements corroborate the phase transition from CoO at low Td to Co3O4 at higher Td observed in XRD, and the presence of a high content of C.
INSERT FIGURE 4
A selection of reflectivity measurements performed on the black coatings obtained at Td = 50°C, 125°C and 160°C, is presented in Figure a. We consistently observe that the best reflectivity (R) in the visible range is obtained for coatings deposited at 125°C; where R remains below 2% over the 400-800 nm range. This is twice lower than the coatings we obtained previously with the sublimation MOCVD process [2]. But this low reflectivity cannot be solely explained by the intrinsic optical properties of CoO and Co3O4 [33, 34]. We suspect a role of the C content, and decide to perform calcinations in air of the 125°C-coatings, at different temperatures (Tc). Figure shows the reflectivity (a), and the evolution of FTIR spectra (b) after annealing at Tc = 400°C, 800°C, and 1000°C. After 1h at 400°C, the reflectivity in the visible range remains unaffected and the reflectivity in the infrared range has significantly decreased. In the corresponding FTIR spectrum, the relative intensity of the Co3O4 absorption bands (570 and 660 cm-1) increased, to the expense of the C-H, C=C, and OH bands (3400 cm-1, 2960-2860 cm-1, and 1490, 1380 cm-1, respectively). Noticeable differences are observed after the 800°C annealing. The typical structure of the pure Co3O4 reflectivity spectra developed [33] and the reflectivity increased in the visible range (2-3%). The corresponding FTIR spectrum exhibits intense Co3O4 bands, and very low C contamination bands. Therefore, post deposition thermal treatment at 800°C for 1 h is efficient in the calcination of C and also likely in the complete oxidation of CoO to Co3O4. After annealing at 1000°C, R increases up to 6% in the visible range, and this rise is accompanied by strong structural and morphological changes (see Figure 6. SEM images of the surface of a coating processed at 125°C, as-processed (a) and after calcination at 1000°C (b). A cross-section prepared by FIB of the as-processed film is also presented in (c).
Figure 7. Bright field TEM micrograph along a cauliflower column (a), and SAED patterns obtained in circled regions 12 (b) and 15 (c). An field image (d) is constructed from the addition of 3 dark-field images obtained with the diffracted beams circled in A, B, and C in (c).
b and details in the section 3.3). The FTIR spectrum shows many additional peaks as compared to the one obtained at Tc = 800°C, but it is unclear whether these absorption bands belong to CoO; e.g. the band centered on 500 cm-1[32]. Anyway, XRD spectra (not shown) after the 1000°C calcination indeed exhibit reflections of the CoO phase, in good agreement with previous works showing that the spinel Co3O4 phase decomposes to CoO above 900°C [35-37].
INSERT FIGURE 5
Overall, this indicates that the low reflectivity in the visible range, of the black coatings obtained at 125°C, is due to the intrinsic absorption properties of the Co oxides in combination with the peculiar cauliflower morphology of the coatings, described elsewhere [2] and illustrated below.
Figure 6. SEM images of the surface of a coating processed at 125°C, as-processed (a) and after calcination at 1000°C (b). A cross-section prepared by FIB of the as-processed film is also presented in (c).
Figure 7. Bright field TEM micrograph along a cauliflower column (a), and SAED patterns obtained in circled regions 12 (b) and 15 (c). An field image (d) is constructed from the addition of 3 dark-field images obtained with the diffracted beams circled in A, B, and C in (c).
presents SEM surface micrographs of films processed at 125 °C, before (a) and after (b) calcination at 1000°C for 1h in air. The as-processed microstructure is composed of nodules that exceed 1 µm in diameter. Each nodule is composed of nanometric branches. The nodules distribution is dense enough to cover the entire surface, resulting in a rougher microstructure than that obtained at the two other temperatures 50°C and 160°C (not shown). The annealing at high temperature strongly modifies the microstructure, as shown in Figure 6. SEM images of the surface of a coating processed at 125°C, as-processed (a) and after calcination at 1000°C (b). A cross-section prepared by FIB of the as-processed film is also presented in (c).
Figure 7. Bright field TEM micrograph along a cauliflower column (a), and SAED patterns obtained in circled regions 12 (b) and 15 (c). An field image (d) is constructed from the addition of 3 dark-field images obtained with the diffracted beams circled in A, B, and C in (c).
b: the surface is still very rough, with a large amount of open porosity, but it is now composed of facetted grains; an indication for crystallization. Finally, the image in Figure 6. SEM images of the surface of a coating processed at 125°C, as-processed (a) and after calcination at 1000°C (b). A cross-section prepared by FIB of the as-processed film is also presented in (c).
Figure 7. Bright field TEM micrograph along a cauliflower column (a), and SAED patterns obtained in circled regions 12 (b) and 15 (c). An field image (d) is constructed from the addition of 3 dark-field images obtained with the diffracted beams circled in A, B, and C in (c).
c presents a cross section of the as-processed film, still at 125 °C, prepared by FIB. The film is composed of two parts: a compact layer of submicron thickness by the interface with Si, and an external layer whose thickness varies between 1 and 5 µm. The latter is composed of growth patterns which are oriented either perpendicular or inclined with regard to the surface, probably due to steric effects during growth. Their development results in a significant open porosity, at least at the external part of the film. At some particular points of the internal sublayer, the nucleation and development of such patterns results in the elongated, conical, cauliflower-type nodular branches, typical of these Co oxide films [2, 38], and which participate to the low reflectivity.
INSERT FIGURE 6
Finally, in order to have a complete overview of the structure and composition of the coatings, we perform TEM on a thin section obtained by focused ion beam milling on a 125°C coating. Results are presented in Figure 6. SEM images of the surface of a coating processed at 125°C, as-processed (a) and after calcination at 1000°C (b). A cross-section prepared by FIB of the as-processed film is also presented in (c).
Figure .
INSERT FIGURE 7
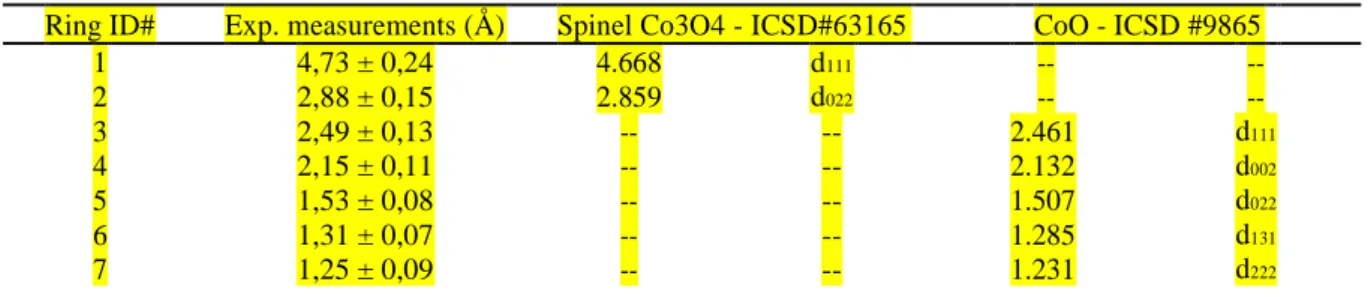
The micrograph in Figure 7a is obtained in bright-field mode. It reveals porosity around columnar grains that extend from the substrate (bottom) to the free surface (top). SAED patterns are collected in each areas numbered 1 to 15. Figure 7b and c show a selection of two representative diffraction patterns obtained in area 12 and 15, respectively. Diffraction rings are formed from the addition of many crystallites in many different orientations. this is a first indication of nanocrystallinity. The indexation of the diffraction patterns is shown in Table 1. Experimental measurements performed in reciprocal space correspond to the interplanar distances presented in the second column. The correspondence is excellent with the spinel Co3O4 d111 and d 022 distances, and with the cubic CoO d111, d002, d022, d131, and d222 distances. Same
rings are observed over the 15 SAED patterns studied. We note that SAED patterns 1 and 15 at the bottom of the section are pure CoO, whereas all other patterns
are diphasic with both Co3O4 and CoO. Nevertheless, further investigation is requested to assess if this is random or a real spatial distribution of the phases.
Table 1. Diffraction rings measurements and corresponding interplanar distances in the Co3O4 and CoO
structures.
Ring ID# Exp. measurements (Å) Spinel Co3O4 - ICSD#63165 CoO - ICSD #9865
1 4,73 ± 0,24 4.668 d111 -- -- 2 2,88 ± 0,15 2.859 d022 -- -- 3 2,49 ± 0,13 -- -- 2.461 d111 4 2,15 ± 0,11 -- -- 2.132 d002 5 1,53 ± 0,08 -- -- 1.507 d022 6 1,31 ± 0,07 -- -- 1.285 d131 7 1,25 ± 0,09 -- -- 1.231 d222
In order to check whether some electronic contrast is due to amorphous regions or not, we construct a dark-field image in Figure 7d by adding the 3 dark-field images obtained with the diffracted arcs A, B, and C shown in Figure 7c. Diffracting crystallites fill the majority of the image confirming that the coating are entirely nanocrystalline and that no amorphous Co oxide is formed.
3.3 Deposition on Poly-epoxy
Figure 8 presents X-ray diffractograms of the films processed at various Td. The X-ray peaks at 2θ equal 36.5°, 42.4°, 61.5°, 73.6° and 77.5° correspond to (1 1 1), (2 0 0), (2 2 0), (3 3 1) and (2 2 2) planes of the cubic cobalt oxide (II) CoO phase. The diffractograms of all films processed at Td up to 100 °C, present X-ray peaks which exclusively correspond to CoO. The diffractogram of the film processed at 50 °C presents undulations rather than clearly defined peaks, revealing poor crystallinity. Films processed at 160 °C present additional X-ray peaks at 2θ equal to 32.2°, 36.9°, 44.8° and 59.3°, and 65.2° which are attributed to the spinel oxide Co3O4. The film processed at Td 125 °C is composed of CoO with traces of Co3O4. Films present no preferential orientation.
Overall, the results obtained on Si wafers are qualitatively reproduced on CFRP; i.e. CoO is detected for 50°C ≤ Td < 125°C whereas (Co3O4+CoO) grow for Td ≥ 125°C.
INSERT FIGURE 8
We now perform a last experiment with a Si substrate and a CFRP substrate placed at the same position on the substrate holder for MOCVD deposition. Hence, except for the transitional regime where the substrate reactivity has an impact, the two black coatings are deposited in the same conditions. Figure 99 shows the reflectivity of these samples (thickness = 0.7 µm), along with the reflectivity of a commercial reference (Vacuum BlackTM, Acktar), a bare CFRP substrate and a bare Si substrate. The inset shows an optical photograph of the black coating obtained on the central part of a 20x10 cm2 CFRP sample that has been masked on each side with adhesive tape.
INSERT FIGURE 9
The reflectivities of the black coatings obtained on Si or CFRP are similar; i.e. they are constant from 400 to 700 nm and increase beyond. The reflectivity stems from 0.7 to 1.1% on the Si substrate, whereas it ranges from 1.0 to 1.4% on the CFRP substrate. The commercial reference has a little higher reflectivity but it remains constant at about 1.3% over the entire range. The reflectivity of of several black coatings processed in the same conditions with various thickness in the range 0.5-1.5 µm remains below 2%. Nonetheless, it is not possible to extract any correlation between thickness and reflectivity. It is interesting to note that the DLI-MOCVD Co oxide coating performs well on both Si and CFRP substrates despite the fact that the initial reflectivity of the two substrates is not in the same order of magnitude (30.6 - 45.5% and 5.8 - 7.6%, respectively).
4. Conclusions
The present work aimed at introducing a new MOCVD process for the controlled deposition of black coatings on thermosensitive carbon fiber reinforced poly-epoxy parts. We implemented the direct liquid injection technology which enables the use of large quantities of liquid precursors maintained at (or below) room temperature before they are flash-evaporated at the reactor entry. Storage degradation is limited and high fluxes can be achieved to treat large surface areas. As compared to previous experiments where the precursor was sublimed and transported by a vector gas, we could multiply the coated surface area by 2000. Nevertheless, the transfer of the process has not been straightforward: by sublimation of the humidified Co2(CO) 8 powder, black Co oxides readily grow, whereas by the injection of the (Co2(CO)8 + heptane) solution, metallic Co grows. Therefore, the adapted DLI-MOCVD process for the deposition of black Co oxide films includes the introduction of O2 in the gas mixture at the entry of the reactor. Black coatings are obtained at 50°C, 125°C, and 160°C. The lowest reflectivity within the optical range (<2%) is found for the deposition temperature of 125°C. Based on the low counts rates in XRD and on TEM experiments, we demonstrate that the films are entirely nanocrystalline. Diffracting phases are CoO for films deposited at low temperatures (50°C, 75°C, and 100°C) and (CoO + Co3O4) for films deposited at higher temperatures (125°C and 160°C). Calcination experiments of the 125°C-films show that (i) carbon plays an important role in the light absorption, and that (ii) the structures are stable for temperatures at least up to 400°C, i.e. well above the admissible temperatures of poly-epoxies. Interestingly, although the chemical scheme and kinetics are different than in the sublimation study, the morphologies are the same, with the typical micrometric “cauliflower” grains that developed on a denser layer. The composition, the crystallographic structures, and the morphology are reproduced on CFRP poly-epoxy substrates. The reflectivity is low, and comparable to commercial references used in the aerospace optics. Hence, we demonstrate that the DLI-MOCVD process is well-suited for the deposition of black coatings on thermosensitive substrates. A next step may be the evaluation of the ability of the process to treat large 3D parts.
Acknowledgements
The DIRECCTE Midi-Pyrénées is acknowledged for financial support in the framework of the AEROSAT 2012 program, under contract n°43186. We are indebted to Sophie Gouy and Claudie Josse, UMS Castaing (Toulouse, FR) for EPMA and FIB-SEM analyses, respectively.
References
[1] G. Wang, X. Shen, J. Horvat, B. Wang, H. Liu, D. Wexler, J. Yao, The Journal of Physical Chemistry C, 113 (2009) 4357-4361.
[2] E. Amin-Chalhoub, T. Duguet, D. Samélor, O. Debieu, E. Ungureanu, C. Vahlas, Applied Surface Science, 360, Part B (2016) 540-546.
[3] N. Lu, P. Zhang, Q. Zhang, R. Qiao, Q. He, H.-B. Li, Y. Wang, J. Guo, D. Zhang, Z. Duan, Z. Li, M. Wang, S. Yang, M. Yan, E. Arenholz, S. Zhou, W. Yang, L. Gu, C.-W. Nan, J. Wu, Y. Tokura, P. Yu, Nature, 546 (2017) 124.
[4] M. Risch, F. Ringleb, M. Kohlhoff, P. Bogdanoff, P. Chernev, I. Zaharieva, H. Dau, Energy & Environmental Science, 8 (2015) 661-674.
[5] J.A. Koza, Z. He, A.S. Miller, J.A. Switzer, Chemistry of Materials, 24 (2012) 3567-3573.
[6] J.M. Suh, W. Sohn, Y.-S. Shim, J.-S. Choi, Y.G. Song, T.L. Kim, J.-M. Jeon, K.C. Kwon, K.S. Choi, C.-Y. Kang, H.-G. Byun, H.W. Jang, ACS Applied Materials & Interfaces, 10 (2018) 1050-1058.
[7] C.R. Dhas, R. Venkatesh, R. Sivakumar, A.M.E. Raj, C. Sanjeeviraja, Optical Materials, 72 (2017) 717-729. [8] A. Jena, N. Munichandraiah, S.A. Shivashankar, Journal of Power Sources, 277 (2015) 198-204.
[9] L. Yang, S. Cheng, Y. Ding, X. Zhu, Z.L. Wang, M. Liu, Nano Letters, 12 (2012) 321-325.
[10] P.M. Kouotou, G.-F. Pan, J.-J. Weng, S.-B. Fan, Z.-Y. Tian, Journal of Industrial and Engineering Chemistry, 35 (2016) 253-261.
[11] N. Weidler, S. Paulus, J. Schuch, J. Klett, S. Hoch, P. Stenner, A. Maljusch, J. Brotz, C. Wittich, B. Kaiser, W. Jaegermann, Physical Chemistry Chemical Physics, 18 (2016) 10708-10718.
[12] P. Sravanthi, C. Chandrakala, S. Raj Bharath, M.G. Johnson, S. Arokiasamy, K.S. Nagaraja, B. Jeyaraj, Polyhedron, 110 (2016) 291-298.
[13] M. Melzer, C.K. Nichenametla, C. Georgi, H. Lang, S.E. Schulz, RSC Advances, 7 (2017) 50269-50278. [14] P.M. Kouotou, Z.-y. Tian, Chinese Journal of Chemical Physics, 30 (2017) 513-520.
[15] P. Mountapmbeme Kouotou, Z.-Y. Tian, Surface and Coatings Technology, 326 (2017) 11-17.
[16] M.N. Rumyantseva, S.A. Vladimirova, N.A. Vorobyeva, I. Giebelhaus, S. Mathur, A.S. Chizhov, N.O. Khmelevsky, A.Y. Aksenenko, V.F. Kozlovsky, O.M. Karakulina, J. Hadermann, A.M. Abakumov, A.M. Gaskov, Sensors and Actuators B: Chemical, 255 (2018) 564-571.
[17] H. Kaplan, Photonics Spectra, 31 (1997) 48.
[18] C. Vahlas, B. Caussat, W. L. Gladfelter, F. Senocq, E. J. Gladfelter, Recent Patents on Materials Science, 8 (2015) 91-108.
[19] A. Zhang, F. Addou, T. Duguet, N. Caussé, C. Vahlas, Journal of Vacuum Science & Technology A: Vacuum, Surfaces, and Films, 35 (2017) 061101.
[20] C.J. Bertole, G. Kiss, C.A. Mims, Journal of Catalysis, 223 (2004) 309-318.
[21] J. Lee, H.J. Yang, J.H. Lee, J.Y. Kim, W.J. Nam, H.J. Shin, Y.K. Ko, J.G. Lee, E.G. Lee, C.S. Kim, Journal of The Electrochemical Society, 153 (2006) G539-G542.
[22] H.-K. Lin, H.-C. Chiu, H.-C. Tsai, S.-H. Chien, C.-B. Wang, Catalysis Letters, 88 (2003) 169-174. [23] V.J. Kehrer, H. Leidheiser, The Journal of Physical Chemistry, 58 (1954) 550-555.
[24] L.J.E. Hofer, E. Sterling, J.T. McCartney, The Journal of Physical Chemistry, 59 (1955) 1153-1155. [25] D.X. Ye, S. Pimanpang, C. Jezewski, F. Tang, J.J. Senkevich, G.C. Wang, T.M. Lu, Thin Solid Films, 485 (2005) 95-100.
[26] H.A.E. Hagelin-Weaver, G.B. Hoflund, D.M. Minahan, G.N. Salaita, Applied Surface Science, 235 (2004) 420-448.
[27] T.J. Chuang, C.R. Brundle, D.W. Rice, Surface Science, 59 (1976) 413-429.
[28] J. Grimblot, A. D'Huysser, J.P. Bonnelle, J.P. Beaufils, Journal of Electron Spectroscopy and Related Phenomena, 6 (1975) 71-76.
[29] J.P. Bonnelle, J. Grimblot, A. D'Huysser, Journal of Electron Spectroscopy and Related Phenomena, 7 (1975) 151-162.
[30] S. Schmid, R. Hausbrand, W. Jaegermann, Thin Solid Films, 567 (2014) 8-13.
[31] Y. Li, W. Qiu, F. Qin, H. Fang, V.G. Hadjiev, D. Litvinov, J. Bao, The Journal of Physical Chemistry C, 120 (2016) 4511-4516.
[32] C.-W. Tang, C.-B. Wang, S.-H. Chien, Thermochimica Acta, 473 (2008) 68-73.
[33] P. Nkeng, G. Poillerat, J.F. Koenig, P. Chartier, B. Lefez, J. Lopitaux, M. Lenglet, Journal of The Electrochemical Society, 142 (1995) 1777-1783.
[34] K. Chidambaram, L.K. Malhotra, K.L. Chopra, Thin Solid Films, 87 (1982) 365-371. [35] M. Figlarz, J. Guenot, F. Fievet-Vincent, Journal of Materials Science, 11 (1976) 2267-2270. [36] G.A. El-Shobaky, I.F. Hewaidy, T. El-Nabarawy, Surface Technology, 10 (1980) 311-319. [37] G.A. El-Shobaky, I.F. Hewaidy, T. El-Nabarawy, Surface Technology, 10 (1980) 225-233. [38] M.G. Hutchins, P.J. Wright, P.D. Grebenik, Solar Energy Materials, 16 (1987) 113-131.
FIGURE CAPTIONS
Figure 1. Elemental depth profile on a 160°C sample.
Figure 2. C1s, O1s, and Co2p1/2 XPS core level spectra before and after etching of the 160°C sample. Figure 3. XRD diffractograms of the films deposited on Si coupons at various Td. JCPDS cards of CoO (00-009-0402), and of Co3O4 (00-009-0418) are depicted in gray, and red, respectively. Stars indicate reflections from the Si wafer.
Figure 4. FTIR spectra of the black coatings deposited on Si coupons at Td = 50°C, 125°C, and 160°C.
Figure 5. (a) UV-vis reflectivity spectra of the black coatings deposited on Si wafers at 50°C, 125°C, and 160°C. Samples obtained at Td = 125°C are annealed at calcination temperatures Tc = 400°C (empty squares), 800°C (empty triangles), and 1000°C (empty circles). (b) FTIR spectroscopy spectra of the 125°C-sample before and after calcination.
Figure 6. SEM images of the surface of a coating processed at 125°C, as-processed (a) and after calcination at 1000°C (b). A cross-section prepared by FIB of the as-processed film is also presented in (c).
Figure 7. Bright field TEM micrograph along a cauliflower column (a), and SAED patterns obtained in circled regions 12 (b) and 15 (c). An field image (d) is constructed from the addition of 3 dark-field images obtained with the diffracted beams circled in A, B, and C in (c).
Figure 1. X-ray diffractograms of the films processed at Td 50, 75, 100, 125, and 160 °C on CFRP substrates. Relative intensities vs. positions for the JCPDS cards #00-009-0402 of CoO (bright, grey) and #00-009-0418 of Co3O4 (dark, red) are also provided.
Figure 2. Reflectivity in the visible range of coatings deposited on Si and CFRP substrates, along with references.