Comprehensive Riser VIV Model
Tests in Uniform and Sheared Flow
The MIT Faculty has made this article openly available.
Please share
how this access benefits you. Your story matters.
Citation
Lie, Halvor, Henning Braaten, Vikas Gopal Jhingran, Octavio E.
Sequeiros, and Kim Vandiver. “Comprehensive Riser VIV Model Tests
in Uniform and Sheared Flow.” Volume 5: Ocean Engineering; CFD
and VIV (July 1, 2012).
As Published
http://dx.doi.org/10.1115/OMAE2012-84055
Publisher
American Society of Mechanical Engineers
Version
Final published version
Citable link
http://hdl.handle.net/1721.1/109462
Terms of Use
Article is made available in accordance with the publisher's
policy and may be subject to US copyright law. Please refer to the
publisher's site for terms of use.
COMPREHENSIVE RISER VIV MODEL TESTS IN UNIFORM AND SHEARED FLOW
Halvor Lie MARINTEK Trondheim, Norway Henning Braaten MARINTEK Trondheim, NorwayVikas Gopal Jhingran
Shell International E&P Houston, Texas, USA
Octavio E. Sequeiros
Shell International E&P Rijswijk, The Netherlands
Kim Vandiver
Massachusetts Institute of Technology Cambridge, MA, USA
ABSTRACT
Despite of considerable research activity during the last decades considerable uncertainties still remain in prediction of Vortex Induced Vibrations (VIV) of risers. Model tests of risers subjected to current have been shown to be a useful method for investigation of the VIV behavior of risers with and without suppression devices.
In order to get further insight on VIV of risers, an extensive hydrodynamic test program of riser models subjected to vortex-induced vibrations was undertaken during the winter 2010 by Shell Oil Company.
The VIV-model test campaign was performed in the MARINTEK Offshore Basin Laboratory. A new test rig was constructed and showed to give good test conditions. Three different 38m long riser models were towed horizontally at different speeds, simulating uniform and linearly varying sheared current. Measurements were made In-Line (IL) and Cross-Flow (CF) of micro bending strains and accelerations along the risers. The test program compromised about 400 tests, which give a rich test material for further studies.
In the present paper the test set-up and program are presented and selected results are reported.
INTRODUCTION
The key objectives of the riser VIV model test campaign were:
• To understand the influence of Reynolds number,
𝑅𝑅 =𝑈𝐷𝜈 on VIV amplitude and response frequency.
Here U is flow velocity, D is cylinder diameter and ν is kinematic viscosity. Different Reynolds numbers were achieved for the same response mode by using different diameter test pipes undergoing VIV in different ambient current speeds.
• To understand the difference in VIV response
(particularly away from the power-in region) when the response is dominated by travelling wave response, standing wave response or a combination of the two.
• Explore the spatial variation in VIV response in the
transition modes when the response is not fully standing nor is it completely travelling.
• Examine the effects of changing damping and
power-in regions uspower-ing VIV mitigation devices.
• Explore response with various mitigation devices
(strakes and fairings). Explore effects of marine growth, partial coverage, scattered coverage etc. The purpose of the present paper will be to describe the objectives of the test program, present the test set-up and to present selected results from the tests. The data is planned to be extensively analyzed to extract as much information as possible from the tests. The results from these analyses are planned to be presented in following up papers.
TEST SET-UP
A challenge when testing an elastic riser model with high mode and high frequency VIV responses is to get negligible vibration input at riser ends from the support rig over the entire frequency range associated with riser VIV response. This constraint on rig-riser interaction was achieved by use of a
Proceedings of the ASME 2012 31st International Conference on Ocean, Offshore and Arctic Engineering OMAE2012 July 1-6, 2012, Rio de Janeiro, Brazil
mass-dominated test rig, with eigenfrequencies well below the lowest riser VIV response frequency.
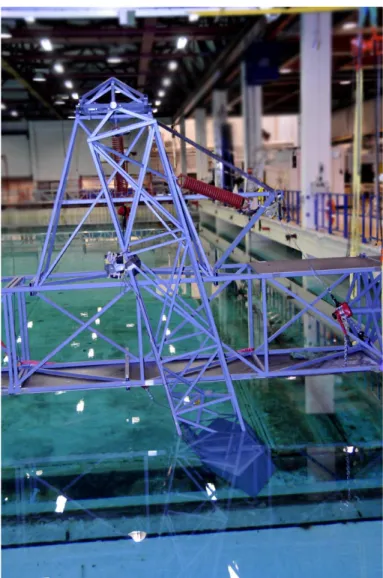
The design work ended up with a new test rig based on the same principles as the previous NDP High Mode VIV test rig [1]. In this new test rig a 40.5 m long cross beam is suspended to the gondola/crane system in the Ocean Basin Laboratory. Figure 1 presents an overview of the test set-up. To the horizontal truss beam two vertical pendulums are attached with clump weight located at the lower end of each pendulum. The riser ends are attached to these clump weights via universal joint and the force transducers.
In order get eigenfrequencies of the test rig well below the eigenfrequencies of the riser models coil springs were used in order to get a soft connection between the clump weights and the long horizontal cross beam. For the IL direction a spring was located horizontally between each pendulum and the long cross beam. In the CF direction the springs were attached in such a way that each of the pendulums (including clump weights) was allowed to move vertically relative to the long horizontal cross beam and kept in position by the spring. The test-rig is also presented in Figs. 2 - 4. For the model tests with triangular sheared flow, the complete test rig at the gondola side of the test set-up may rotate in order to make the clump weight follow a predefined arc. The horizontal truss beam was fixed to the basin wall at the landside for the sheared flow tests. The gondola was free to roll in the crane direction and the position was thus controlled by the cross beam.
Figure 1: Test principles and coordinate system, left in uniform flow, right in sheared flow.
Figure 2: Description of test set-up for uniform current profile
Figure 3: Test rig with riser model in water
Figure: 4 Details of test rig showing the clump weight system, soft springs and one end of the riser model
RISER MODELS
Pipe 1 was made of a rod of fiberglass and polyester. Pipe 2 was made of tube with the same type of material as Pipe 1. Both riser models were covered with a silicon layer. Pipe 3 used Pipe 2 as a core. Outside Pipe 2 half pipe sections where wrapped around the core in order to obtain a larger outer diameter of 80 mm. Figure 5 shows a picture of the Pipe 3 structure consisting of the core (Pipe 2) and the assembled half pipes. Confer also Fig. 8.
Some key characteristics of the three riser models are presented below.
Parameter Pipe 1 Pipe2 Pipe3
Total length between
pinned ends 38.00 m 38.00 m 38.00 m Outer diameter 12 mm 30 mm 80 mm Outer/Inner diameter of fiberglass rod/pipe 10/- mm 27/21 mm 27/21 mm Bending stiffness, EI1) 16.1 Nm2 572.3 Nm2 572.3 Nm2
Young modulus for
pipe, E1) 3.27 10 10 N/m2 3.46 10 10 N/m2 3.46 10 10 N/m2 Mass in air 0.197 kg/m 1.088 kg/m 5.708 kg/m Weight in water 0.078 kg/m 0.579 kg/m 0.937 kg/m Mass ratio 2) 1.74 1.54 1.14
1) EI determined from bending test with the pipe. E and EA determined from EI and measured pipe dimensions.
2) Equal to mass of water filled riser / displacement mass
RISER AND TEST CONFIGURATIONS
The purpose of using different diameters in the riser model was to be able to excite the riser models in various mode numbers. Pipe 1 with the smallest diameter of 12 mm was designed get a
CF response mode above 30. Pipe 2 should be excited up to 15th
mode, while Pipe 3 could be excited between mode 3 and 9. Thus testing the three pipes should give modal overlap.
Analytical equations for tensioned beams have been applied to see the influence from tension and bending stiffness on eigenfrequencies of the three riser models. The eigenfrequencies for the riser models are tension dominated for the entire cross-flow frequency interval of interest, while bending stiffness has some influence on the eigenfrequencies for the in-line frequency interval with very high speed cases.
The riser models were tested in bare configurations and in various other configurations, i.e.
• Wrap-on fairing, (Pipe 1)
• Bare (Pipe 1, Pipe 2 and Pipe 3)
• Short fairing, (Pipe 3)
• Triple start strakes (pitch=15 D, H=0.25D) with various %
coverage, (Pipe 3)
• Marine soft growth on the strakes, (Pipe 3)
• Increased Roughness for turbulence stimulation, (Pipe 3)
Figure 5: The structure of the riser model Pipe3.
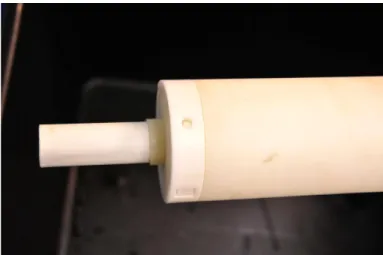
A relative short fairing with a cord length to outer diameter ratio of 1.45 was used in the model tests. The fairings were close to neutrally buoyant. The faring was tested with Pipe 3. Figure 6 presents a photo of the fairing.
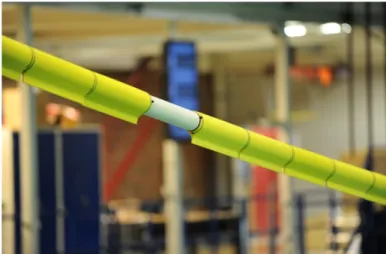
One set of strakes were used in the model tests. The strake model was especially made for these tests. The strake geometries were selected in order to be representative for present typical full-scale strakes used on risers offshore. The triple start helical strakes were cast from Polyurethane, and were delivered in sections of 430 mm. Each section is made as two thin walled half-pipes with the strakes mounted onto. The thickness of the half-pipes was 3 mm, making the outer diameter for the strakes tests equal to 86 mm. The geometries of the strakes are based on this outer diameter. The height of the strakes was 25 % of the outer diameter and the pitch was equal to 15 diameters. The strake-sections were mounted to the pipe by several strips. The strakes were close to neutrally buoyant. The straked riser model was also tested with artificial marine growth on the strakes, confer Fig. 7.
To study the effect of marine growth on the strakes carpet fabrics were glued to the pipe between the strakes. Two different materials were glued to the pipe, one with height equal to 30% of the strakes and one with thickness of 60% of the strakes height, confer Fig. 7.
Figure 6: Riser model (Pipe3) covered with short fairings
Figure 7: Riser model (Pipe3) covered with strakes with marine growth height corresponding to 30% of the strake fin height
INSTRUMENTATION
Pipe 1 was instrumented with fiber optic strain gages (Fiber Bragg Grating, FBG) at 50 equidistance locations. This implies 200 strain sensors. They are used to measure axial stress and bi-axial bending stresses. The fibers were glued outside the fiberglass rod, in four quadrants of the cross section (forming a cross) to capture all type of bending. The fibers were protected by the outer silicon layer.
Pipe 2 was instrumented similarly as Pipe 1 with FBG strain gages at 30 equidistance locations. This implies 120 strain sensors. In addition 22 bi-axial accelerometers were mounted on Pipe 2 in order to measure IL and CF accelerations, confer Fig. 8.
Figure 8: The structure of riser models Pipe 2 and Pipe 3. Upper: Pipe 2 with an accelerometer before sealing, FBG glued (black) to the central fiberglass pipe, Pipe 2 is partly covered by the outer silicon layer; Lower: Pipe 3 with the core with a sealed accelerometer (bump) and a half pipe
In addition to the transducers on the riser model, the following instrumentation was included:
Signal Direction Transducer
Accelerations of clump weight,
upper riser end x, y and z Linear accelerometers
Accelerations of clump weight,
lower riser end x, y and z Linear accelerometers
Riser force end, upper end x, y and z Strain gauge transducer
Riser force end, lower end x, y and z Strain gauge transducer
Angle measurements of the clump weights about the
x-axis at both ends roll
The FBG signals were sampled at a rate of 250 Hz. All other signals were sampled at a rate of 1200 Hz, after low-pass analogue filtering with a cut-off frequency of 250 Hz.
TEST PROGRAM
The tests performed can be divided into the following three groups:
1. Instrumentation verification and calibration tests.
2. Decay tests and pluck tests in air and in water
3. Riser VIV tests.
The test program for the Shell Riser VIV tests consisted of about 400 runs varying towing velocity, velocity profile (uniform or shear), riser diameter, suppression devices type, suppression devices coverage, marine growth and pipe roughness.
RESULTS
The test program generated a large amount of data and only limited analysis has been conducted. In the following more details of the test program will be presented. Further selected results will be highlighted and some trends commented.
Pipe 1
Pipe 1 was tested both in uniform and triangular sheared flow. For uniform flow the tow velocity was varied from 0.5 - 3.5 m/s while in sheared flow the maximum tow velocity was 2.9 m/s. The maximum tow speed corresponds to a Reynolds number, 𝑅𝑅 = 37 000. Most of the tests were performed with constant towing speed but for some tests the tow speed was varied during the test.
For Pipe 1 some experiments were done with the riser model covered by wrap-on fairings except in the center of the riser model, where it was bare. All tests were performed with constant current at high mode response. The idea is that the large L/D will simulate a gap with infinite length of the pipe on both sides.
Pipe 2
Pipe 2 was also tested in uniform and triangular sheared flow. For uniform flow the tow velocity was varied from 0.2 - 2.5 m/s while in sheared flow the maximum tow velocity was 2.9 m/s. The Reynolds number range was 5 200 - 67 000. As for Pipe 1 most of the tests were performed with constant towing speed but for some tests the tow speed was varied during the test.
Pipe 3
Bare Pipe 3 was tested both in uniform and triangular sheared flow. For uniform flow the tow velocity was varied from 0.6 – 1.8 m/s while in sheared flow the maximum tow velocity was 3.0 m/s. The Reynolds number range was 42 000 - 210 000. As
for Pipe 1 and Pipe 2 a few tests with varying tow speed were performed
In order to try to get fully turbulent flow and produce high Reynolds number flows around the riser model the roughness of Pipe 3 was increased by gluing P40 sand paper to the outside of the pipe. This may simulate supercritical Re number and was performed in both uniform and sheared flow for towing velocities up to 1.6 m/s in uniform and 2.8m/s in sheared flow. Pipe 3 was also tested with a short fairing, denoted Shell fairing. The riser and fairing models were tested with a low and a moderate rotational friction between the riser and the fairings. Pipe 3 fully covered with the Shell short fairing was tested both in uniform and sheared flow. The tow speed was varied from 0.5-2.25m/s in uniform flow and 0.25-3.0m/s in sheared flow. Even for full coverage not all the riser length was covered by fairings. In these tests “Full coverage” represents 81.7% of the riser length to be covered by fairings. The "Full coverage" represents the coverage typical for GoM risers.
As it was done for Pipe 1 some experiments with gaps in the center of the riser model were performed for Pipe 3. At each side of the gap the rest of the riser model is covered with Shell short fairings. 4 different gap sizes were tested: 5%, 10%, 15% and 25% of the riser length as gap length.
Pipe 3 was also tested with triple start helical strakes. As for the fairing tests full coverage was not 100% coverage, but ~83% coverage of the riser length.
Some experiments with gaps in the center of the riser model were also performed for Pipe 3 with strakes. At each side of the gap the rest of the riser model is covered with strakes. 4 different gap sizes were tested: 5%, 15%, 25% and 50% of the riser length as gap length. All strakes tests were performed in uniform flow and for towing speeds 0.25-1.5 m/s.
Pipe 3 was also tested with the same strakes with soft marine growth. First marine growth equal to 30% of the strake height was tested. The tow speed was varied from 0.25-1.75 m/s in uniform flow and 0.25-2.75m/s in sheared flow and full coverage of strakes was tested. Then the marine growth was changed to 60% of the strakes height. For this condition (full coverage) the tow speed was varied from 0.25-1.5 m/s in uniform flow and 0.25-2.5 m/s in sheared flow.
Later the upper 60% of the riser length was covered by marine growth (60% of strakes height) while the lower 40% was clean (only strakes). This is typical of what happens in the field where the top 300ft – 400ft are covered in marine growth and below that the strakes are clean. Results from the marine growth tests will be presented in a following section.
At the end of the test program Shell wanted an addendum activity that included testing of Pipe 2 (with outer diameter of
30 mm) with staggered buoyancy elements, where the elements from the largest diameter of 80 mm riser model, Pipe 3, were used as buoyancy elements. This activity is presented by Jhingran et al. [2].
Comparison of VIV response in uniform and sheared flow
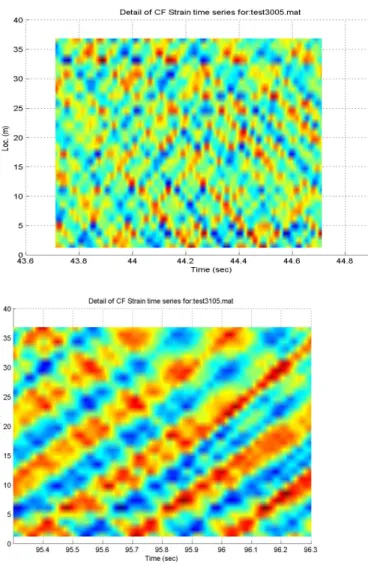
Figure 9 presents strain time series along the riser length for a short time window for uniform and sheared flow for Pipe 2 in a towing speed of 0.75 m/s. The figure shows that the traveling wave dominated the riser response for both cases. Figure 10 presents spectra for the same tests at a distance of about 1/10 of the riser length from top. The Strouhal frequency in this case is estimated to be around 4 Hz. As seen from both figures the case with uniform flow is significantly more influenced by higher order response compared to the sheared flow case.
Figure 9: Strain time series along the riser length from top of Pipe 2 for a short time window at a towing speed of 0.75 m/s. Upper: Uniform flow, Lower: Sheared flow
Figure 10: Spectra of curvature at position 1/10 of riser length from top of Pipe 2 at a towing speed of 0.75 m/s. 1X corresponds to 1st harmonic CF response frequency (near
the Strouhal frequency); 3X and 5X corresponds to the 3rd
and 5th higher-order CF response frequency component,
respectively. Upper: Uniform flow, Lower: Sheared flow
1X
5X 1X
Reynolds number effect on bare riser VIV
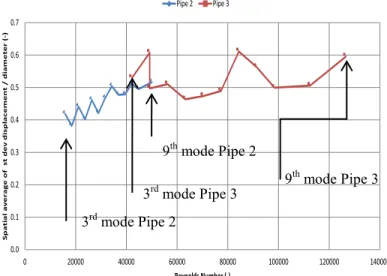
One of the largest uncertainties in VIV prediction is how sensitive the VIV response is with respect to Reynolds number. In the following we will presents some limited results on this issue. A simple parameter to describe the overall cross-flow displacement along the riser during one test is to apply the spatial average of the displacement standard deviation found
from each of the accelerometers, i.e. 𝜎� =𝑁1∑𝑁𝑖=1𝜎𝑖. Figure 11
presents 𝜎�/𝐷 for Pipe 2 and Pipe 3 versus Reynolds number. We have estimated roughly the responding mode number for each towing speed and the corresponding Reynolds number. The figure shows the displacement response where both risers have about the same responding mode, between of 3-9. As seen in the figure it seems that the CF displacements in average are higher for Pipe 3 compared to Pipe2. This is in accordance with previous observations [3]. The results in Fig. 11 should be considered as example and the effect of Reynolds number on the riser VIV response should be and is planned to be further investigated in the future.
Figure 11: Spatial average of the displacement standard deviation versus Reynolds number for Pipe 2 and Pipe 3 in uniform flow. Both risers have an estimated responding mode range of 3-9.
Effectiveness of strakes with marine growth
A study to investigate the influence of marine growth on the effectiveness of helical strakes to suppress VIV was conducted as a part of the test program. The aim was to provide guidance on the effect marine growth has on the hydrodynamic response of a riser fitted with strakes. One important result from such test is to make guidance on when it is necessary to clean the marine growth on the strakes in order to avoid unacceptable VIV.
Similar tests of elastic mounted rigid cylinder section have been reported before [4] [5]. In these "2D" tests the rigid cylinder with strakes represents a section of a long flexible riser. The present long elastic riser model represents the total riser. To the
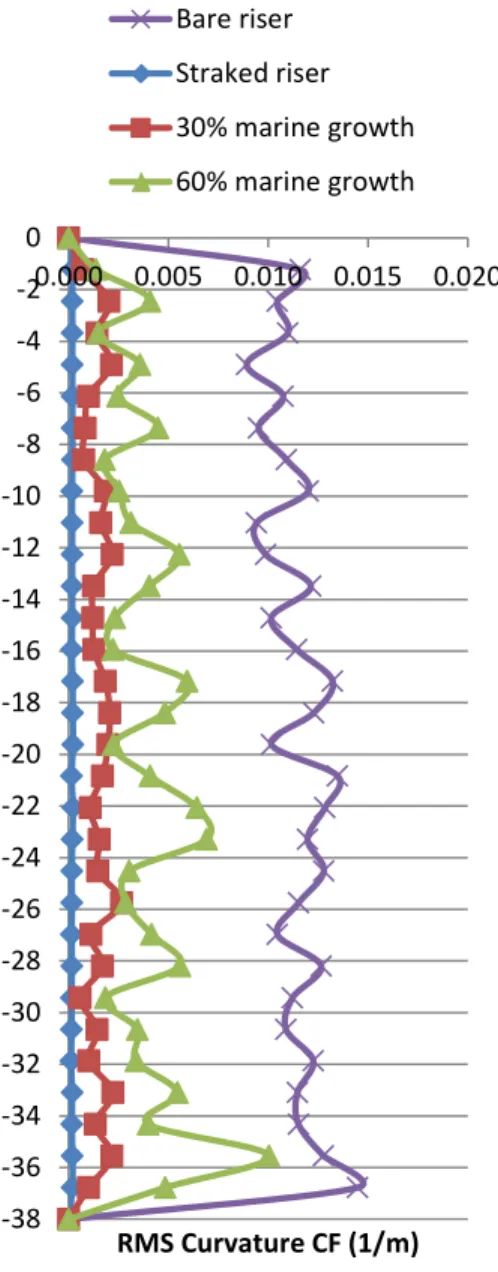
authors knowledge such a test with a long elastic cylinder has not been reported before. This test set-up is considered to be more realistic when studying the behavior of a long elastic riser fitted with strakes that are subjected with marine growth. One of the main results from the elastic mounted rigid cylinder tests [4], [5] was that both hard and soft marine growth lead to severe increase in the response compared to a clean straked riser. The transition between low and high VIV response is about 60% and 35% of the strake fin height for hard and smooth marine growth, respectively. Based on these findings it was concluded that the present tests should be done with modeling soft marine growth with a height of 30% and 60% of the of the strake fin height. Figure 12 presents typical results. Standard deviation of the CF curvature along the riser in uniform flow is presented for four various riser configurations, i.e. bare riser without strakes, "cleaned" straked riser, straked riser with 30% marine growth and straked riser with 60% marine growth.
As seen from the figure the 30% marine growth case showed increased response compared to the response of the clean straked riser. The 60% marine growth case has a response of about half or more of the response of the bare riser.
SUMMARY AND CONCLUSIONS
The paper presents a model test program which is considered successfully with respect to the stated objectives. The collected data seem to include results that can be used in further VIV research on a variety of subjects.
Selected cases have been analyzed and presented in the paper. For the bare riser test in uniform flow significant higher-order bending strain response was observed compared with the similar sheared flow case. This should be further explored in the future using the present data and using other experimental data.
A limited study on sensitivity of the VIV response on bare risers with respect to Reynolds number has been performed. The spatial average of the displacement standard deviation along the riser is found for various towing speeds for Pipe 2 and Pipe 3.
Pipe 2 has a Reynolds number range from about 20 000 to 50 000. The corresponding range for Pipe 3 is from about 40 000 to 130 000. Comparing the response of the two risers when they have about the same responding mode number indicates that the riser model with lowest Reynolds numbers tends to have lowest displacement of the two.
Selected results from the tests with artificial marine growth on the straked flexible riser model were analyzed. The 30% marine growth case showed increased response compared to the
0.0 0.1 0.2 0.3 0.4 0.5 0.6 0.7 0 20000 40000 60000 80000 100000 120000 140000 S p at ial av e rag e o f st d ev d is p la cem en t / d ia m et er ( -) Reynolds Number (-) Pipe 2 Pipe 3 3rd mode Pipe 3 3rd mode Pipe 2 9th mode Pipe 2 9th mode Pipe 3
response of the clean straked riser. The 60% marine growth case has a response of about half or more of the response of the bare riser.
The test using a long flexible riser model show similar test results when using an elastically mounted short rigid cylinder. One important result from such test is to make guidance on when it is necessary to clean the marine growth on the strakes in order to avoid unacceptable VIV.
Figure 12: Standard deviation of the curvature along the riser model for various riser configurations in uniform current
ACKNOWLEDGMENTS
The authors would like to acknowledge the financial support from Shell International E&P and for allowing the publication of the present paper.
REFERENCES
[1] A.D. Trim, H. Braaten, H. Lie, M.A. Tognarelli. “Experimental Investigation of Vortex-Induced Vibration of Long Marine Risers”. Journal of Fluids and Structures, 2005: p.335–361.
[2] Jhingran, V., Zhang, H., Lie, H., Braaten, H., Vandiver, K., 2012, “Buoyancy Spacing Implifications for Fatigue Damage Due to Vortex-Induced Vibrations on a Steel Lazy Wave Riser (SLWR)“ , Proc. of OTC 23672 46.
[3] Swithenbank, S. B., Vandiver, J. K., Lie, H., Larsen, C. M., ”Reynolds number dependence of flexible cylinder VIV response data”, OMAE2008-57531, June 2008, Estoril, Portugal
[4] Skaugset K. and Baarholm R. (2008), “Effect of Marine
Growth on an Elastically Mounted Circular Cylinder“, 27th
International Conference on Offshore Mechanics and Arctic Engineering (OMAE 2008), Estoril, Portuga
[5] Baarholm R. and Skaugset K. (2008), “Modeling and
Characterization of Artificial Marine Growth“, 27th
International Conference on Offshore Mechanics and Arctic Engineering (OMAE 2008), Estoril, Portugal
-38 -36 -34 -32 -30 -28 -26 -24 -22 -20 -18 -16 -14 -12 -10 -8 -6 -4 -2 0 0.000 0.005 0.010 0.015 0.020 RMS Curvature CF (1/m) Bare riser Straked riser 30% marine growth 60% marine growth