HAL Id: hal-01415884
https://hal.archives-ouvertes.fr/hal-01415884
Submitted on 13 Dec 2016
HAL is a multi-disciplinary open access
archive for the deposit and dissemination of
sci-entific research documents, whether they are
pub-lished or not. The documents may come from
teaching and research institutions in France or
abroad, or from public or private research centers.
L’archive ouverte pluridisciplinaire HAL, est
destinée au dépôt et à la diffusion de documents
scientifiques de niveau recherche, publiés ou non,
émanant des établissements d’enseignement et de
recherche français ou étrangers, des laboratoires
publics ou privés.
From precursors to prediction: a few recent cases from
Greece
Pascal Bernard, P Pinettes, P Hatzidimitriou, E Scordilis, G Veis, P Milas
To cite this version:
Pascal Bernard, P Pinettes, P Hatzidimitriou, E Scordilis, G Veis, et al.. From precursors to prediction:
a few recent cases from Greece. Geophysical Journal International, Oxford University Press (OUP),
1997, 131 (3), pp.467-477. �10.1111/j.1365-246X.1997.tb06590.x�. �hal-01415884�
From precursors
to
prediction:
a few recent cases from Greece
P.
Bernard,' P. Pinettes,' P. M. Hatzidimitriou,2 E. M. Scordilis,2
G.
Veis3 and P. Milas3
l D~;purtenwnt de Sisniologie, ( I R A CNRS 195, IPGP, 4 Pluce Jussieu, 15252 PuriJ, France. E-muil: hernurd([i,ipgp.jussieu. f r Thrssuloniki, Depurtment qf Geophysics, Aristoteliciun University, Thessuloniki 54006, Greece
Dyonisos Satellite Ohserwtory, Technicul University of Athens, 9 Heroon Polytechniou Sir., 15773 Zografos, Athens, Greece
Accepted 1997 September 2. Received 1997 August 22; in original form 1997 February 19
S U M M A R Y
The two destructive earthquakes of 1995 in Greece, the May 13 Ms=6.6 Kozani- Grevena and the June 15 Ms=6.2 Aigion events, provide interesting material for analysing problems related to the identification of precursors and to the efficiency and usefulness of prediction. The Kozani earthquake was preceded, within 30 minutes of the main shock, by five foreshocks with magnitude greater than 3.5 (Papazachos et al. 1995). We relocated these events with respect to each other, showing that they are clustered within 2 km of one another, about 5 to 10 km to the SSW of the main-shock epicentre. This size of foreshock clustering correctly fits the correlation law with the main-shock magnitude obtained by Dodge, Beroza & Ellsworth (1996) for Californian earthquakes. These foreshocks led to people leaving their houses, which explains the absence of casualties, despite the partial destruction of several villages. The possibility of issuing predictions in this area from the observation of earthquake clustering is analysed in light of the seismicity observed during the last 15 years. A prediction was issued by the VAN group before this earthquake, based on SES signals (IOA station, 18-19 April 1995), which is considered by VAN as a success (Varotsos et al. 1996a), but
is in fact a failure to predict (Geller 1996). This SES was also recorded by a magneto- telluric station installed by IPGP, a few kilometres from IOA (Gruszow et al. 1996).
Gruszow et al. (1996) suggested an artificial origin for the SES, but could not track it. Simple amplitude estimates show that a local, natural source such as a n electrokinetic effect is unlikely, and that a remote electrokinetic source in the epicentral area can be even more confidently rejected. Another SES onVAN's network (VOL station, 30 April 1995) led the VAN group to predict an earthquake outside the IOA sensitivity area (IOA did not record any anomaly), and to announce a success when the Aigion earth- quake occurred (Varotsos et al. 1996a); however, this event was located inside the IOA sensitivity area, and the prediction was hence a failure (Wyss 1996; Geller 1996; Bernard
et al. 1997). Furthermore, at the time of this SES, no tilt nor strain was observed above
the noise level of a few lo-' at the IPGP/NTUA Galaxidi geophysical observatory, 20 km from the hypocentre, leading Pinettes et al. (1996) to conclude that the electrical source of this SES was most probably located near VOL, 100
km
away, whatever its correlation with the earthquake.Key words: earthquake precursors, earthquake prediction, Greece.
physical signal. Sometimes, even, scientists launch predictions, with little thought of their impact on the society; the public's reaction, panic or indifference, is mostly unpredictable. All
these attitudes are often the source of controversies which can go far beyond the field of science, and give the impression of a messy battlefield around the questions of precursors and predictions.
I N T R O D U C T I O N
Each major, destructive earthquake raises the same double question: the public asks the scientists whether the catastrophe could have been, or was, predicted and the scientists ask themselves whether precursors occurred, looking back at their records to try to discover some precursory, anomalous geo-
0 1997 RAS 467
at Observatoire de la Côte d'Azur - Geoazur on December 13, 2016
http://gji.oxfordjournals.org/
468
P.
Bernard et al.The strong seismicity of Greece-the most active area in the
Mediterranean-makes this country an excellent laboratory
for exploring these questions. In this paper we consider the
two destructive earthquakes of 1995, the May 13 Kozani
(Ms=6.6) and June 15 Aigion (Ms=6.2) events (Fig. 1). Both earthquakes had a catastrophic impact on the economy of the respective regions, destroying thousands of houses, with a
direct monetary loss greater than 500 million US dollars for
each event. The Kozani earthquake occurred in the area of
lowest seismicity in central Greece, and activated a normal fault with a centrimetric offset at the surface (Hatzfeld et al.
1995; Meyer et al. 1996). The Aigion earthquake occurred in
the western part of the Gulf of Corinth, which is the most
active continental area of Greece, and ruptured a normal
fault cropping out under the gulf, less than 5 km from the
town of Aigion (Bernard ef a / . 1997). Both events produced interesting data and information concerning precursors and predictions.
T H E 1995 M A Y 1 3 K O Z A N I - G R E V E N A E A R T H Q U A K E
Foreshocks
The Kozani-Grevena earthquake was preceded by several moderate shocks in the epicentral area, starting 30 minutes
before the main shock (Papazachos et al. 1995). These events
led people to leave their houses, which explains the absence of
20"
21
"
22"
23"
24"
25"
26"
42
"
41
"
40"
39"
38"
37"
36"
20"
21
"
22"
23"
24"
25"
26"
Figure 1. Locations of the 1995 May 13 Kozani-Grevena and 1995 June 15 Aigion earthquakes.
42"
41"
40"
39"
38"
37"
36"
0 1991 RAS, GJI 131,461471at Observatoire de la Côte d'Azur - Geoazur on December 13, 2016
http://gji.oxfordjournals.org/
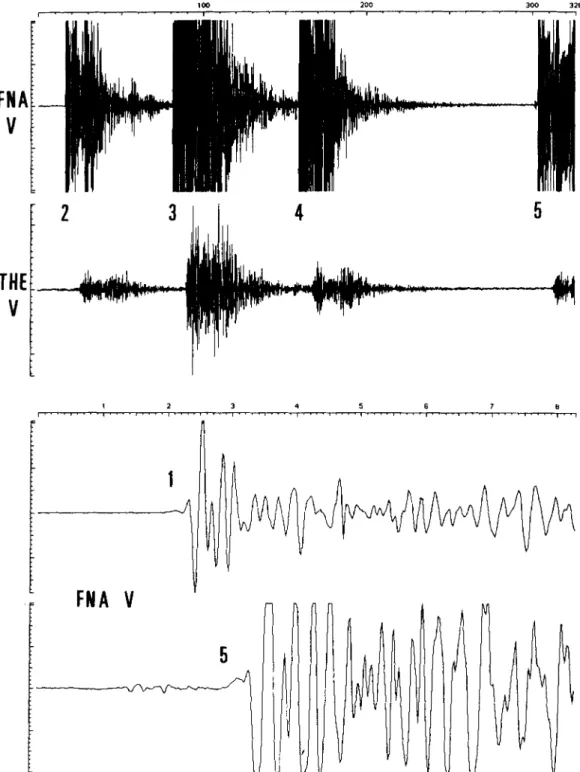
casualties, although several villages were partially destroyed with the collapse of hundreds of houses. Five foreshocks had
a magnitude greater than 3.5 and were clearly recorded on
the digital, three-component stations of the regional network
of the University of Thessaloniki (Fig. 2, top). The closest
station, FNA, was about 70 km from the main-shock epi-
centre. The preliminary location of these events by Papazachos et ul. (1995) showed a large scatter of the epicentres over
an area of diameter 10 km, which motivated the present study.
If this scatter were confirmed, these foreshocks would be very atypical with respect to the sequences studied by Dodge
et al. (1996) in California. Indeed, according t o the correlation
law presented in Fig. 16 of their paper, a magnitude 6.6
earthquake is expected to have a 1 km radius of foreshock
zone. An accurate relocation of the Kozani foreshocks is therefore required to assess the capability of such a correlation law for predicting the magnitude of the impending main shock. 100 200 300 326
FNA
V
t
I
F
-Figure 2. Records of the foreshock sequence. Top: 300 s of record of the vertical component at stations FNA and THE, at the time of the foreshocks
(numbers 2 to 5 ) . Foreshock #1 occurred 24 min before #2. The main shock occurred about 15 s after event #S. Bottom: First P arrival on the
vertical component at FNA for the foreshocks #1 and #5, showing similar waveforms for the first second of the signal.
0 1997 RAS, GJI 131,467477
at Observatoire de la Côte d'Azur - Geoazur on December 13, 2016
http://gji.oxfordjournals.org/
470
P.
Bernard et al.At some stations, the first few seconds of the P wave present
rather similar waveforms (Fig. 2, bottom). We therefore
used the largest earthquake (event #3, M=4.5) as a master
event for locating the other four foreshocks (events #1,
M = 3 . 4 , # 2 , M = 3 . 9 , # 4 , M = 3 . 7 a n d # 5 , M = 4 . 2 ) . Foreach
of the latter events, we found three to five records which could
be correlated in time with the P phases of event #3, with a
relative precision of about 0.05 s. We thus located event #3
with the same stations by using its P arrival time with
HYP071, assuming a depth of 9 km [mean depth of the after-
shocks, according to Hatzfeld ef al. (1995)l. The related station
delays (OBS-CAL) were then used t o correct the P arrival
times of event #3, providing a reference location with a 0 s rms
residual. The corresponding phases of the event to be relocated with respect to this reference were then corrected by the same
40.
40.
4 0 .
39.
(OBS-CAL) delay, and located with HYP071, assuming the same depth.
The relative locations are plotted in Fig. 3. All fore-
shocks are within 1 km of each other i n map view, except
#4, about 2 km to the NE. The cross centred on event #3
gives the uncertainty: 300 m corresponding to the 0.05 s
of relative time error, and an additional 300 m due t o the
projection of the hypocentres on the plane at 9 km depth.
The latter accounts for the possibility that the correlated
events may have depth differences up to 5 km. which is not
accounted for in the location; this corresponds to the hypo- central distance variation for a station at 70 km and a
5 km change in depth. The sizes of the circles give a rough
idea of the source dimensions: the analysis of the wave- form spectra of event #3 shows a corner frequency near
u
1
km
1
I
I I I AKozanhi I I 20 21.40 21.60 21:80 25.00 ' 20Figure 3. Location of the Kozani earthquake foreshocks. Top: relative locations of the foreshock epicentres. The symbol sizes are related to the fault
areas (see text). The cross gives the uncertainty. Bottom: aftershocks and active faults of the Kozani 1995 earthquake (from Hatzfeld et rrl. 1995). The
large star is the main-shock epicentre; the smaller star on the white disk is the location of the foreshocks.
6) 1997 RAS, GJI 131,461 411
at Observatoire de la Côte d'Azur - Geoazur on December 13, 2016
http://gji.oxfordjournals.org/
t
3
3 Hz, so assuming a 3 km s - ' rupture velocity one obtains
a radius of 1 km for a circular source, consistent with the magnitude. The source dimensions of the other events have been deduced from the former by assuming a constant stress drop.
Unfortunately, the main shock was not recorded by the digital network, which failed at the time of the earthquake. It was therefore not possible to relocate event # 3 with respect to
the main-shock epicentre. We used 10 readings of the P arrival times of event #2, unperturbed by coda waves, assuming a hypocentral depth of 9 km. The location is 40.1OoN, 21.62'E, with an rms residual time of 0.5 s and an uncertainty of less than 5 km. It is located about 10 km to the SSW of the main- shock epicentre proposed by Hatzfeld et al. (1995) (Fig. 3,
bottom). We believe that this difference is significant, owing to the uncertainty of a few kilometres allowed by these authors. The foreshock cluster would thus be located near the centre of the aftershock cloud, possibly bearing some relationship with geometrical complexities of the fault, such as the antithetic normal fault activated at depth proposed by Hatzfeld et u1.
(1995).
In conclusion, the inferred 1.5 km radius of the foreshock zone for a magnitude 6.6 main shock is in excellent agreement with the correlation reported by Dodge et ul. (1996): the latter might thus provide a way to predict the size of a future earth- quake, based on a quasi-real-time relocation of earthquake clusters that are believed to be possible precursory events. However, a much larger number of observations is necessary for this 'law' to be statistically reliable and useful for earth- quake prediction. In addition, further analysis is required for a better understanding of this sequence of foreshocks with respect to the main-shock location.
SES at IOA: an ambiguous prediction
A prediction was issued by the VAN group before the Kozani earthquake (Varotosos et al. 1996b). It was based on seismic
electric signals (SES) (Varotsos & Alexopoulos 1984; Varotsos
& Lazaridou 1991) recorded on April 18 and 19 1995 on
the telluric lines of the IOA station. Two faxes were sent by VAN to the authorities, on April 21 and 30. The first fax was a double prediction, referring to an earthquake in the Vartholomio area (epicentre of the 1988 earthquake), with magnitude Ms(Ath) N 6.0 (based on the similarity of the 1995
SES with the 1988 SES; see Fig. 4, bottom), or an earthquake a few tens of kilometres to the NW of IOA, with Ms(Ath) N 5.5
(Fig. 5)*. The second fax made the same double prediction, except that Ms(Ath) N 5.5 - 6.0 for the second prediction area
to the NW of IOA.
For evaluating the success or failure of these predictions, one has to define a precise range of time, magnitude and distance. Unfortunately, this was not specified in the fax, and we will consider the same range of parameters as those generally used for the statistical studies conducted by various groups on VAN predictions (see Lighthill 1996). In particular, a magnitude uncertainty of 0.7 units and a distance up to 100 km are currently accepted.
* Ms(Ath) is the magnitude provided in the Preliminary Seismological
Bulletin of the National Observatory of Athens; Ms(Ath)-ML+0.5 (Wyss 1996; Varotsos etal. 1996~).M
JAN E 31 d b a n
Figure 4. Top: location of the IOA (VAN) and JAN (IPGP) electro- telluric stations in the Ioannina basin. Bottom: SES recorded before the 1988 (IOA station) and the 1995 (JAN and IOA stations) earthquakes.
The Kozani earthquake occurred about 70 km N60"E of the IOA station, and 200 km from the Vartholomio area. The latter area is therefore not acceptable, but the former is. The time lag of less than two weeks is also acceptable.
0 1991 RAS, GJI 131,461471
at Observatoire de la Côte d'Azur - Geoazur on December 13, 2016
http://gji.oxfordjournals.org/
472 P. B e r n a r d e t al.
However, the magnitude, Ms=6.6, is much larger than the maximum acceptable magnitude 5.5+0.7=6.2 of the first fax (April 27). The prediction in the first fax is therefore a failure. In the second fax, one has to make some interpretation of the range 5.5-6.0 for an earthquake near IOA, which is not as obvious as it seems. We will follow first the line of argument of Geller (personal communication, 1996). The most common understanding of a range of acceptable magnitudes is that the real magnitude should belong to the range (otherwise one usually does not specify a range, but only a mean value). In that case, the prediction is a failure, as 6.6 is not in the range 5.5-6.0. A second possible interpretation is that only the mean value of the range is relevant, with a 0.7 standard uncertainty. In this case, the maximum magnitude is 5.75 f 0. 7 = 6.45, hence the prediction is a failure. The last interpretation is that 0.7 should be added to the range limits, which would then become 4.8-6.7, thus the prediction is a success. It is clear that the first interpretation is more acceptable than the second-why bother giving a range if it is not used sensu stricto? It is also clear that
the third interpretation is much more difficult to defend than the others because it would mean an acceptable magnitude range of 1.9 units, which nobody considered in previous work on the VAN predictions: the rule of the game should not be changed a posteriori, conveniently transforming a prediction
failure into success.
Varotsos et al. (1996b) provided a different interpretation of
the magnitude range above, based on their postulated obser- vation of a linear increase of log (A V r ) with magnitude M and a
slope of about 0.35 (AV is the dipole voltage and r is the dis- tance): ‘In case that the earthquake would occur just in the vicinity of IOA, the expected magnitude was about 5.5, while at a larger epicentral distance (i.e., a few tens of kilometres NW of
IOA) Ms(Ath)=6.0’. This a posteriori adjustment of the fax
annoucement looks like an ad hoc excuse: had an earthquake of magnitude 6.6 occurred ‘just in the vicinity of ION, we
believe that this new interpretation would most probably not have been put forward by VAN, as it would have led to a missed event and failure to predict with a magnitude error of 1.1 (i.e. 6.6-5.5), far above the acceptable range. However, let us examine this argument more carefully, assuming that the pre- dicted magnitude 5.5 (respectively 6.0) concerns the shortest (respectively largest) predicted distance r1 (respectively rz). The proposed slope of 0.35 leads to r2IrI = 1.5 for the 0.5 difference in magnitude. Thus, if one of the two extreme distances, rl or r2, is estimated to be ‘a few tens of kilometres’
NW of IOA, so is the other. In other words, the predicted distance is not significantly altered by the new interpretation of Varotsos et al. (1996b): these authors only increase the allowed magnitude range to 4.8-6.7 (accounting for the 0.7 units of uncertainty), and we are back to the unacceptable third interpretation of the previous discussion. Let us now play VAN’S game in a different way: assume that ‘a few tens of kilometres NW’ means 40 km NW, and corresponds to a pre- dicted magnitude 5.75 (mean value of the prediction range). For a magnitude 6.7, the 0.35 slope would predict a distance of 40 x x(6.6-5.75) = 79 km N45”W from IOA. The result is that the ‘predicted’ M = 6.6 earthquake would be located about 120 km WNW from the true location, outside the acceptable distance range.
Our opinion is thus that sensu stricto, VAN’S predictions of the April 27 and 30 are both false alarms, and that the Kozani earthquake is a missed event. Claiming the contrary would
mean adjusting the rule of the game after the event. which i s
not acceptable.
Searching for the source of the SES a t IOA
An electrotelluric station, JAN E, and a magnetic station. JAN M, have been installed by IPGP a few kilometres away from the IOA site (Gruszow et ul. 1996) (Fig. 4, top). JAN E recorded the SES from April 18 and 19, which showed very similar waveforms to those of IOA, and were associated with a magnetic anomaly at JAN M as well as at 10A. The polarization difference between the SES electrical fields a t
IOA and JAN E and power considerations led these authors to propose a local source of the electrical currents. They further argued that the general waveform and timing of the SES is characteristic of an industrial source: round hours for the starting and ending times of the SES (multiples of 10 minutes), one-sided signals with constant peak-to-peak value, and similarity with the 1988 SES.
However, we believe that these last characteristics are not specific to industrial sources: first, we note that the ‘round hours’ of the beginning and the end of the signals are not exactly round, and could be obtained by chance. Second, the one-sided potential oscillations can be generated by natural sources, such as an intermittent, underground water flow coupled with an electrokinetic phenomenon, which could be suggested by the existence of important karsts and artesian boreholes in the area; furthermore, if the same fluid instability is triggered several times, one would expect rather similar waveform characteristics and duration.
The only strong argument against a local, natural source is the amplitude of the electric and magnetic signals (10 to 60 mV km-’ and 0.4 nT, respectively). Considering electro- kinetic effects, by far the most efficient electromechanical sources observable in crustal rocks, Bernard (1992) showed that with g x C = 10 mV (atm R m)-’ (where o is the con- ductivity and C the streaming coefficient), a 1 M Pa pore- pressure drop on a 1 km long, horizontal electrokinetic source at a few kilometres depth generates a current dipole of lo5 A m and surface electrotelluric fields of 10 mV km-‘ within a few kilometres, which is the level of Gruszow et ul.’s
(1996) observations. However, in the case of the Ioannina basin, more realistic values for G x C are 10 to 100 times
smaller, as resistivities are about 10 R m in the sediments of the basin and a few hundred R m in the limestone bedrock (Rossignol, personal communication, 1997), and as a standard streaming coefficient for such rocks is 100 mV MPa-’. This leads to predicted electric and magnetic fields at least one order of magnitude smaller than that reported by Gruszow et al.
(1996).
Electrical sources at distances greater than a few tens of kilometres are even less likely; in particular the detection at IOA and JAN of an electrical source which would be located in the epicentral area of the Kozani earthquake, 70 kin away, would need the unlikely conjunction of the following very favourable circumstances: a powerful crustal source (such as the streaming potential due to fluid flow under a thousand bar of pore-pressure gradient over 1 km), the guiding of the currents in a conductive layer, and a local amplification under the site (Bernard 1992; Bernard & Le Moue1 1996). The latter condition means that this amplification would concern both the IOA and JAN E electrode pairs as the signals have
0 1997 RAS, GJI 1 3 1 , 4 6 1 4 7 7
at Observatoire de la Côte d'Azur - Geoazur on December 13, 2016
http://gji.oxfordjournals.org/
similar amplitudes. This would imply that a very strong heterogeneity exists at the scale of 10 km or more near the sites. The absence of any evidence for such a large structure is thus a strong argument against a remote source in the epicentral area, and hence in our opinion is one of the most important results of GruszoW et a/.'s (1996) experiment.
THE 1995 J U N E 15 A I G I O N EARTHQUAKE sES a t VOL: a failure t o predict
On April 30 an SES was recorded at station VOL, which led VAN to issue a prediction (Varotsos et d. 1996b). The VAN group noted that the IOA station did not record any signal, and thus excluded the IOA sensitivity area as a possible area for the predicted earthquake (Fig. 5). When the Aigion earthquake occurred, one and a half months later, VAN claimed success in the prediction, based on a preliminary location of the epicentre (about 38.5"N, 22.6"E), which is indeed outside the sensitivity area of IOA.
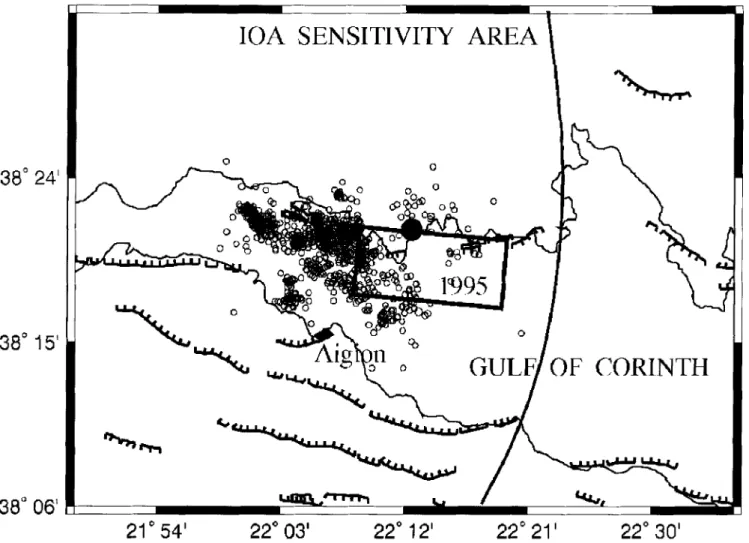
However, the true location of the earthquake differs from this location, as was noted by Geller (1996) and Wyss (personal communication, 1996). Bernard rt a/. (1997) relocated the
earthquake using regional and local seismograms, and InSAR and GPS data (Fig. 6). They found that the epicentre was located at 38.36"N, 22.20°E, with an uncertainty of 2 km, and that GPS and InSAR data accurately constrained the eastern limit of the activated fault segment to be at longitude 22"20'E, significantly west of the boundary of the IOA sensitivity area. Consequently, Varotsos et d ' s (1996b) statement that
'a portion of the seismic volume lies clearly outside the IOA selectivity map' is wrong. The prediction issued on April 30 is
therefore a failure, and the Aigion earthquake is a missed event, following VAN'S own location rule.
1
I '
l
P U
>
z
Figure 5 . VAN network and sensitivity areas. Crosses are close to the two predicted epicentres for the telegrams issued 1995 April 27 and 30.
The stars are the epicentres of the 1995 May 13 Kozani (KOZ) and
1995 June 15 Aigion earthquake (AIG). The shaded area to the west
corresponds to the IOA sensitivity area (from Varotsos et al. 1993).
Searching for the source of the SES a t VOL
Although from the formal point of view the prediction of 1995 April 30 is a failure, we do not think that defining a sensitivity boundary in a precise way has much meaning, that is we do not believe that an electrical source from each side of the boundary would be either seen or not seen at IOA. In the particular case of the Aigion area, a very broad-band magnetotelluric survey (about 60 broad-band soundings in the central and western part of the Corinth rift) conducted by IPGP and NOA pro- vided an image of the electrical conductivity in the whole crust, showing no particular structure near the boundary of the IOA sensitivity area which would explain some selectivity or screening effect (Pham et a/. 1996).
It was therefore tempting to look for some other geophysical activity in the epicentral area of the earthquake at the precise time of the SES, which started at about 5 h 40 min UT, and ended at about 7 h 00 min UT (Varotsos et a/. 1996b). No specific earthquake activity was observed. Pinettes et al. (1996) carefully examined the records from the Galaxidi geophysical observatory. This multiparameter observatory was installed in a cave by IPGP and NTUA, on the northern coast of the Gulf of Corinth, and is located about 20 km east of the epicentre of the 1995 Aigion earthquake. Tilt and strain at different places in the cave are continuously measured with a sampling rate of 2 pt min-', along with meteorological parameters (rain, pressure, temperature), sea level and radon activity. The resolutions of the tilt and strain sensors are about
5 x lo-' and l o p 8 , respectively, for the frequency range of interest. As seen in Fig. 7, no deformation above the noise level can be detected at the time of the SES at VOL. The only perturbations on the geophysical sensors are due to some coupling to the battery voltage, and to the numerical noise of the digitizer seen on the short-circuit output.
Based on this strain observation, Pinettes et al. (1996, 1997)
attempted to place some constraints on the source of the SES under the working hypothesis that it is located at the hypo- centre of the Aigion earthquake, about 20 km from the Galaxidi observatory, and has a dimension L smaller than the ruptured area. Following the lines of argument of Bernard (1992) and Bernard & Le Moue1 (1996), the dipolar electrical field decays with distance r as (Llr)". For a homogeneous half- space, n e 3 ; for a dipole inbedded in a horizontal, highly
conductive layer, n N 2 . Recent magnetotelluric investigations
show that the electrical structure of the crust is highly heterogeneous, in particular near the centre of the rift, and becomes more homogeneous and resistive to the north (Pham
et a / . 1996; Pham e t a / . , personal communication, 1997). They also reveal a relatively conductive layer between 10 and 15 km in depth, which may partially channel the electrical currents, at least in the central part of the rift. No evidence for any specific conductive path from the 1995 earthquake hypocentre towards the NE was found, which would have led to n of the order of 1. Thus, the available data suggest that 2
<
n<
3. Taking a rather high but plausible value n = 2.5 corresponding to somepartial channelling in a horizontal layer, the observation of 10 mV km pl at VOL, 100 km from the source, leads to 1000 V km-' in the source volume for L = 1 km. We did not consider here a specific site amplification at VOL, because such amplification has not been found yet in any of the VAN stations [in particular, Gruszow et ai.'s (1996) results show no significant amplification at IOA, as discussed above].
0 1997 RAS, GJI 131,461471
at Observatoire de la Côte d'Azur - Geoazur on December 13, 2016
http://gji.oxfordjournals.org/
474 P. Bernurdet a1
38"
24'
38"
15'
30"
06'
0 O4
' \-
BY
CORINTH
. ._ .U I . .-
7
-
I
21
54'
22"
03'
22"
12'
22"
21'
22" 30'
Figure 6 . Fault model and aftershocks of the 1995 Aigion earthquake (from Bernard et al. 1997). The large dot is the relocated epicentre.
The rectangle is the limit of the activated fault segment (about 0.9 m mean slip). The curved line is the IOA sensitivity area redrawn from Varotsos
et al. (1993) (see Fig. 5). The epicentre and the whole activated fault lies within the IOA sensitivity area.
Considering now the mechanical process at the origin of the electrical signal, the strain at the source should be smaller than a few lop4 to account for the absence of detected strain
at Galaxidi, using a cubic decay of the strain amplitude with distance. This leads to an electromechanical coupling coefficient of more than 1000 V for a few tens of bars, which is more than 100 times more efficient than the typical coupling coefficients of an electrokinetic effect. As the latter is by far the most efficient process known for converting mechanical to electrical energy in the crust, one can reject the possibility of an electrical source of the observed SES located in the epicentral area. Its location is therefore most probably much nearer to VOL, whatever its physical origin and its correlation with the Aigion 1995 earthquake.
PREDICTION S C E N A R I O S
Some difficulties inherent in the definition and evaluation of prediction schemes have already been mentioned above, when we noted changes in the rules of the game for VAN'S self-evaluation of the Kozani and Aigion predictions. Other problems related to this topic can be clearly illustrated by these two earthquakes.
As already reported, the inhabitants of the epicentral area of
the Kozani earthquake left their houses before the main shock, due to the unusual and worrying foreshock activity. They thus issued some kind of prediction for themselves, which possibly saved hundreds of lives. Let us examine the recent seismicity of
the area about 30 km around the epicentre. Since 1981, the earthquake catalogue is complete above magnitude 4, with 19 earthquakes (Papazachos ef ill. 1995). Among these, 11 were associated in five short sequences, lasting from minutes to hours (Fig. 8). Out of these five sequences, two led to a signi- ficant earthquake (1984, Ms=5.6; 1995, Ms=6.6). If one defines a prediction scheme for a magnitude greater than 5.5
based on the observation of at least two almost colocated earthquakes with magnitude greater than 4 occuriiig within less than one day, one would obtain the following result: no missed events, three false alarms and two successful pre- dictions. The data set is unfortunately not large enough to
find the statistical reliability of such a rule. We do not know if the people fled their houses for the sequences before 1995, but obviously such events were rare enough to frighten the
people at the time of the Kozani foreshocks. Most probably, the very short time between the events (a few minutes), and their numbers (five above magnitude 3.5) were determinants in
C 1997 RAS, G f I 1 3 1 . 4 6 7 4 7 1
at Observatoire de la Côte d'Azur - Geoazur on December 13, 2016
http://gji.oxfordjournals.org/
on w e b:W 7 Y
Figure 7. Strain and tilt at the Galaxidi Observatory at the time of the 1995 April 30 SES. Records of various geophysical and instrumental
parameters (from Pinettes et al. 1996). The SES recorded at VOL (amplitude 10 mV km-’) is from Varotsos et al. (1996b).
leading the people out, in which case only the 1985 sequence might have had the same psychological impact. However, we should recall that the 1995 foreshocks occurred at noon on a Saturday, so one may thus wonder if people would have similarly left their homes if this sequence of events had happened, for instance, during a cold winter’s night.
One also wonders if a public alert based not on clear earth- quake activity, but on a rather obscure geophysical precursor detected on some nearby instrument, would have had the same impact. This would certainly depend on the confidence that people have in the prediction issued by the authorities, and hence in the number of past successes, failures to predict and false alarms (Fig. 9). The authorites themselves would have had to make up their own minds about whether or not to issue a prediction, usually based on possibly worrying but statistically insignificant data sets presented by geophysicists. Here, psychological, sociological and even political reasons may well influence their final decision.
The case of the 1995 Aigion earthquake also deserves some comment. Let us assume that a public warning had been issued, broadcasting through the media the map of the area believed to be in imminent danger by VAN. Most probably, the hotels in the dangerous part of the Gulf of Corinth would have
been deserted, to the benefit of the hotels in its western part, west of the eastern limit of the IOA sensitivity area. What actually happened was that the earthquake nucleated 15 km within the safe region, the fault cropping out a few kilometres from Aigion city, causing severe damage. In particular, the nearby Helike Hotel partially collapsed, killing 10 people among 167 staying inside; the death toll would have been much larger had more people stayed there that night. Hence, such a public warning might have generated a significantly greater number of victims than occurred in reality. Who would have been to blame for that? This simple scenario thus raises the important, but rarely answered, question of the responsibilities of the authorities as well as of the scientists when issuing earthquake predictions.
C O N C L U S I O N S
The search for, detection and modelling of earthquake precursors is a fundamental issue for understanding physical processes of fault zones before the nucleation of seismic ruptures, and in this context the 1995 Kozani fore- shock sequence deserves some further study. However, such studies with an unambiguous identification of earthquake
0 1991 RAS, GJI 131,461411
at Observatoire de la Côte d'Azur - Geoazur on December 13, 2016
http://gji.oxfordjournals.org/
476 P. Bernard et al.
time
Figure 8. Clustered seismicity since 1979 in the Kozani region, with M s r 4 (from the catalogue in Papazachos et al. 1995).
precursors have not yet provided enough observations and well-constrained models for defining a reliable earthquake prediction scheme; on the contrary, the rather erratic and non- systematic character of the reported precursors suggests that earthquake prediction might never become highly reliable, that is, that a large proportion of future large earthquakes
PREDICTION WINDOW
I
EARTHQUAKEt
SPACE SUCCESSFUL PREDICTION a @-+FAILURE TO PREDICT TIME *Figure 9. Sketch of the history of a prediction scheme with unambiguous precursors. The efficiency of the related prediction rule will depend on the relative weight given to the impact of false alarms, failures to predict and successes.
might remain unpredictable in the short term, and that a high proportion of false alarms is to be expected.
From the decision maker’s point of view, the usefulness of earthquake prediction schemes would depend on the psycho- logical, economic and political impacts of false alarms, failures to predict and successful predictions, which are extremely difficult to assess with confidence. Predicting the quality of an earthquake prediction scheme might thus be almost as difficult as predicting the earthquakes themselves.
The cases of the Aigion and Kozani destructive earthquakes in Greece strongly suggest that neither the scientists nor the public or the authorities are ready to cope safely with earth- quake predictions. In particular, our comments on VAN’s
‘predictions’ clearly illustrate that VAN’s method cannot be properly evaluated as long as these predictions are not clearly and unambiguously presented, referring to well-defined rules; hence, it is not, sensu stricto, a testable prediction method. The only public alerts which seem to have worked up to now are those produced by nature itself, in the form of foreshock sequences strong enough to generate anxiety and to lead people to leave buildings. Such alerts have the invaluable advantage that no scientist or authority will be to blame in the case of a false alarm.
A C K N O W L E D G M E N T S
We particularly thank the Ephoria of Paleo-anthropology, Ministry of Culture, Greece, for allowing access to the
0 1997 RAS, GJI 131,467411
at Observatoire de la Côte d'Azur - Geoazur on December 13, 2016
http://gji.oxfordjournals.org/
G a l a x i d cave. We a r e grateful t o R. Geller a n d M. Wyss for enlightening discussions a b o u t important features con-
cerning VAN’S predictions of t h e Kozani and Aigion earth-
quakes. We also t h a n k the t w o a n o n y m o u s reviewers for
their i m p o r t a n t a n d constructive criticisms. This work was supported by t h e P N R N program, I N S U / C N R S , a n d t h e
C.E. Environment and Climate Program, Topic Seismic risk,
Contracts #EV5V-CT94-0513 and # ENV4-CT96-0276. This
is IPGP contribution 1498. R E F E R E N C E S
Bernard, P., 1992. Plausibility of long distance electrotelluric
precursors to earthquakes, J. geophys. Res., 97, 17 531-17 546.
Bernard, P. & Le Mouel, J.-L., 1996. On electrotelluric signals, in
A Critical Review of VAN, pp. 118-152, ed. Lighthill, J., World Scientific, Singapore.
Bernard, P. ef a/., 1997. The M ~ 6 . 2 , June 15, 1995 Aigion earthquake
(Greece): evidence for low angle normal faulting in the Corinth rift,
J. Srism., in press.
Dodge, D.A., Beroza, G.C. & Ellsworth, W.L., 1996. Detailed
observations of California foreshock sequences: implications for
the earthquake initiation process, J. geophys. R e x , 101, 22
371-22 392.
Geller, R.J., 1996. VAN: a critical evaluation, in A Critical
Review of VAN, pp. 153-238, ed. Lighthill, J., World Scientific,
Singapore.
Gruszow, S., Rossignol, J.C., Tzanis, A. & Le Mouel, J.-L., 1996.
Identification and analysis of electromagnetic signals in Greece: the case of the Kozani earthquake VAN prediction, Geophys. Res. Lett., 23,2025-2028.
Hatzfeld. D. et al., 1995. The Kozani-Grevena (Greece) earthquake of May 13, 1995, Ms=6.6. Preliminary results of a field multi- disciplinary survey, Seism. Res. Lett., 66,61-70.
Lighthill, J. (ed.), 1996. A Critical Review of VAN, World Scientific,
Singapore.
Meyer, B. et a/., 1996. The 1995 Grevena (northern Greece) earth-
quake: fault model constrained with tectonic observations and SAR interferometry, Geophys. Res. Leti., 23,2677-2680.
Papazachos, B.C. et a/., 1995. Focal properties of the 13 May 1995 large (Ms=6.6) earthquake in the Kozani area (north Greece),
Proc. X Y congress Carpatho-Balcun geol. Assoc., September 17-20,
Athens.
Pham, V.N., Boyer, D., Chouliaras, G. & Bernard, P., 1996.
Conductivite electrique et structure de la croute dans la region du Golfe de Corinthe (Grece) d’apres les resultats de sondage
magnetotellurique (SMT), C. R. Acad. Sci. Paris., t. 323, serie IIa,
651-656.
Pinettes, P., Bernard, P., Blum, P.-A., Verhille, R., Milas, P. & Veis, G.,
1996. On the absence of epicentral strain anomaly at the time of the alleged VAN precursor of the 1995 Aigion earthquake, EOS, Trans. Am. geophys. Un., Fall Mtg (abstract).
Pinettes, P., Bernard, P., Blum, P.-A., Verhille, R., Milas, P. &
Veis, G., 1997. Strain constraint on the source of the alledged
VAN precursor of the 1995 Aigion earthquake, J. geophys. Res.,
submitted.
Varotsos, P. & Alexopoulos, K., 1984. Physical properties of the
variations of the electric field of the earth preceding earthquakes, I,
Tectonophysics, 110,73-98.
Varotsos, P. & Lazaridou, M., 1991. Latest aspects of earthquake pre-
diction in Greece based on seismic electric signals, Tectonophysics, 188,321-347.
Varotsos, P., Alexopoulos, K. & Lazaridou, M., 1993. Latest aspects of
earthquake prediction in Greece based on seismic electric signals, 11, Tectonophysics, 224, 1-37.
Varotsos, P., Lazaridou, M., Eftaxias, K., Antonopoulos, G.,
Makris, J. & Kopanas, J., 1996a. Short term earthquake prediction
in Greece by seismic electric signals, in A Critical Review of VAN,
pp. 29-76, ed. Lighthill, J., World Scientific, Singapore.
Varotsos, P. et al., 1996b. Recent earthquake prediction results in Greece based on the observation of seismic electric signals, Acta
Geophys. Pol., XLIV, 301-327.
Varotsos, P., Eftaxias, K., Lazaridou, M., Dologlou, E. &
Hadjicontis, V., 1996c. Reply to ‘Inaccuracies in seismicity and magnitude data used by Varotsos and co-workers’ by M. Wyss,
Geophys. Res. Lett, 23, 1303-1306.
Wyss, M., 1996. Inaccuracies in seismicity and magnitude data used by Varotsos and co-workers, Geophys. Res. Lett, 23, 1299-1 302.
0 1997 RAS, GJI 131,467477
at Observatoire de la Côte d'Azur - Geoazur on December 13, 2016
http://gji.oxfordjournals.org/