HAL Id: hal-02046015
https://hal.sorbonne-universite.fr/hal-02046015
Submitted on 22 Feb 2019
HAL is a multi-disciplinary open access
archive for the deposit and dissemination of
sci-entific research documents, whether they are
pub-lished or not. The documents may come from
teaching and research institutions in France or
abroad, or from public or private research centers.
L’archive ouverte pluridisciplinaire HAL, est
destinée au dépôt et à la diffusion de documents
scientifiques de niveau recherche, publiés ou non,
émanant des établissements d’enseignement et de
recherche français ou étrangers, des laboratoires
publics ou privés.
Matthew Mills, Zachary Brown, Samuel Laney, Eva Ortega-Retuerta, Kate
Lowry, Gert van Dijken, Kevin Arrigo
To cite this version:
Matthew Mills, Zachary Brown, Samuel Laney, Eva Ortega-Retuerta, Kate Lowry, et al.. Nitrogen
Limitation of the Summer Phytoplankton and Heterotrophic Prokaryote Communities in the Chukchi
Sea. Frontiers in Marine Science, Frontiers Media, 2018, 5, pp.362. �10.3389/fmars.2018.00362�.
�hal-02046015�
doi: 10.3389/fmars.2018.00362 Edited by: Claire Mahaffey, University of Liverpool, United Kingdom Reviewed by: Allison A. Fong, Alfred-Wegener-Institut, Helmholtz-Zentrum für Polar-und Meeresforschung (HZ), Germany Jun Sun, Tianjin University of Science and Technology, China *Correspondence: Matthew M. Mills mmmills@stanford.edu
Specialty section: This article was submitted to Marine Biogeochemistry, a section of the journal Frontiers in Marine Science Received: 06 July 2018 Accepted: 20 September 2018 Published: 15 October 2018 Citation: Mills MM, Brown ZW, Laney SR, Ortega-Retuerta E, Lowry KE, van Dijken GL and Arrigo KR (2018) Nitrogen Limitation of the Summer Phytoplankton and Heterotrophic Prokaryote Communities in the Chukchi Sea. Front. Mar. Sci. 5:362. doi: 10.3389/fmars.2018.00362
Nitrogen Limitation of the Summer
Phytoplankton and Heterotrophic
Prokaryote Communities in the
Chukchi Sea
Matthew M. Mills1* , Zachary W. Brown2, Samuel R. Laney3, Eva Ortega-Retuerta4,
Kate E. Lowry3, Gert L. van Dijken1and Kevin R. Arrigo1
1Department of Earth System Science, Stanford University, Stanford, CA, United States,2Inian Islands Institute, Gustavus,
AK, United States,3Biology Department, Woods Hole Oceanographic Institution, Woods Hole, MA, United States, 4Laboratoire d’Océanographie Microbienne, Observatoire Océanologique, CNRS, Sorbonne Université, UMR 7621,
Banyuls-sur-Mer, France
Major changes to Arctic marine ecosystems have resulted in longer growing seasons with increased phytoplankton production over larger areas. In the Chukchi Sea, the high productivity fuels intense benthic denitrification creating a nitrogen (N) deficit that is transported through the Arctic to the Atlantic Ocean, where it likely fuels N fixation. Given the rapid pace of environmental change and the potentially globally significant N deficit, we conducted experiments aimed at understanding phytoplankton and microbial N utilization in the Chukchi Sea. Ship-board experiments tested the effect of nitrate (NO3−) additions on both phytoplankton and heterotrophic prokaryote abundance, community composition, photophysiology, carbon fixation and NO3−uptake rates. Results support the critical role of NO3−in limiting summer phytoplankton communities to small cells with low production rates. NO3−additions increased particulate concentrations, abundance of large diatoms, and rates of carbon fixation and NO3− uptake by cells >1 µm. Increases in the quantum yield and electron turnover rate of photosystem II in +NO3− treatments suggested that phytoplankton in the ambient dissolved N environment were N starved and unable to build new, or repair damaged, reaction centers. While some increases in heterotrophic prokaryote abundance and production were noted with NO3− amendments, phytoplankton competition or grazers likely dampened these responses. Trends toward a warmer more stratified Chukchi Sea will likely enhance summer oligotrophic conditions and further N starve Chukchi Sea phytoplankton communities.
Keywords: phytoplankton, nitrogen, Chukchi Sea, nitrate, nutrient limitation
INTRODUCTION
The Arctic Ocean is currently undergoing massive alterations due to global climate change. Of paramount importance is the loss of sea ice. Annual mean open water area has increased ∼2.8% yr−1 between 1998 and 2012 (Arrigo and van Dijken, 2015), and evidence suggests the
trend will continue, with the monthly average ice extent for September decreasing 13.3% per decade relative to the 1981–2010 average (Perovich et al., 2016). The primary contributors to the increasing loss of ice are higher global temperatures due to greenhouse gas emissions (Zhang and Walsh, 2006;
Stroeve et al., 2007), increased warm water input to the Arctic from both the Pacific and Atlantic Oceans (Spielhagen et al., 2011;
Woodgate et al., 2012), and an increase of ice flowing out of the Arctic to the Atlantic (Smedsrud et al., 2017). The loss of sea ice in the Arctic decreases albedo and results in further warming of the ocean, which perpetuates additional loss of ice. Evidence suggests that the loss of sea ice in the Arctic is consistent with this ice albedo feedback cycle (Perovich et al., 2007, 2011), with the number of open water days increasing over time (Arrigo and van Dijken, 2015).
Coincident with increased open water area across the Arctic Ocean has been a 30% increase in net primary production (NPP) between 1998 and 2012 as greater areas of the ocean are exposed to light, thereby facilitating more rapid phytoplankton growth (Arrigo and van Dijken, 2015). However, in addition to light, phytoplankton growth requires nutrients, and thus the increase in Arctic NPP may also be coincident with an increase in nutrient availability. Flow through the Bering Strait has increased between 2001 and 2011 (Woodgate et al., 2012) and is a possible source of new nutrients to the Arctic Ocean. Likewise, increased input from rivers may supply useable nutrients for phytoplankton (Ardyna et al., 2014). Finally, shelf break upwelling can entrain nutrients into surface waters (Spall et al., 2014), and an increase in this process would likely increase NPP as well. Which, if any, of these processes are contributing to the higher NPP in the Arctic Ocean is unclear.
The flow of water within the Chukchi Sea is to first order dictated by the bathymetry of the shelf (Weingartner et al., 2005; Spall, 2007; Pickart et al., 2016). Three main pathways emanate northward from the Bering Strait (Figure 1): a western branch that goes through Herald Canyon, a middle branch
that progresses through the Central Channel (the gap between Herald Shoal and Hanna Shoal), and an eastern branch that flows adjacent to the coast of Alaska. In summertime, the eastern branch is known as the Alaskan Coastal Current (ACC), which transports relatively warm and fresh Alaskan Coastal Water (ACW) originating from coastal runoff in the Gulf of Alaska and Bering Sea. The middle branch is believed to transport a combination of Bering Shelf Water (BSW) and Anadyr Water (AW), which ultimately mix to form Bering and Chukchi Summer Water (BCSW). The western branch is thought to advect primarily AW. The ACC is typically warm (>2◦
C, Figure 1), depleted in nutrients, and has a significant contribution from river input (Weingartner et al., 2013;Gong and Pickart, 2016). In contrast, the summertime BCSW is generally colder (−1 to 2◦
C) than the ACW and has higher nutrient concentrations. Some fraction of the AW in the western flow branch is diverted eastward toward the BCSW (e.g., Pickart et al., 2010) and the combined flow is then steered around Hanna Shoal toward Barrow Canyon. Recently, the Central Channel flow path was shown to bifurcate and pass around both sides of Hanna Shoal prior to flowing into Barrow Canyon (Pickart et al., 2016). As such, all three Pacific water masses primarily exit the Chukchi Sea through Barrow Canyon (Gong and Pickart, 2015).
In early winter, ice formation and brine rejection over the Chukchi shelf drive convective overturning that mixes the water column. As winter progresses, the whole of the Chukchi Sea becomes ice covered, daylight disappears, and inorganic nutrient concentrations increase due in part to microbial net remineralization of organic matter. The combination of the brine-induced mixing and nutrient regeneration results in a fully mixed, nutrient-rich water column, known as winter water
FIGURE 1 | Map of the Chukchi Sea showing the stations sampled during the ICESCAPE 2011 field campaign (A). Stations where nutrient addition bioassays were carried out are shown as colored dots. Temperature (T) and salinity (S) relationship of waters sampled during ICESCAPE 2011. Vertical lines indicate water mass density (B). The colored dots represent profiles at stations where nutrient addition bioassay were conducted, where colors match the stations in (A). The largest dot in each profile is T-S of the sampled depth.
(WW), that persists until ice melt begins in the spring (Arrigo et al., 2017), when light levels are high enough for phytoplankton to draw down nutrients and begin fixing carbon (Lowry et al., 2018). In recent years, thinner ice with high melt pond fractions have increased light penetration into the water below, allowing phytoplankton to bloom and consume nutrients even when sea ice is still present (Arrigo et al., 2012, 2014).
With respect to nutrient limitation, nitrogen (N) is considered the nutrient that limits autotrophic productivity in the Arctic once the spring bloom is complete (Kattner and Budeus, 1997;
Tremblay et al., 2002, 2008; Simpson et al., 2008; Tremblay and Gagnon, 2009). Likewise, Ortega-Retuerta et al. (2012)
demonstrated that heterotrophic prokaryotes were N-limited in the Western Arctic Ocean. The low concentrations of inorganic N relative to dissolved inorganic phosphorus (DIP) and dissolved silica (DSi) are primarily the result of high rates of denitrification in the sediments of the Bering Sea and Chukchi shelf that reduce nitrate (NO3−) and nitrite (NO2−) to the gaseous products nitric
oxide (NO), nitrous oxide (N2O), and dinitrogen gas (N2) (Devol
et al., 1997;Chang and Devol, 2009;Brown et al., 2015). A recent study (Mills et al., 2015) showed that excess N (N∗∗
) decreased from the south to the north over the Chukchi Shelf, an indication that denitrification had removed N from the water during transit. Estimates of denitrification in the Arctic suggest it is a globally important N sink (Chang and Devol, 2009;Mills et al., 2015).
Phytoplankton can acclimate to N limitation in multiple ways. One primary response is to reduce the cell quota for N by lowering the amount of N-containing chlorophyll a (Chl a) per cell. Likewise, cells can reduce the cellular concentration of protein-rich light harvesting complexes, as well as other components of the photosynthetic electron transport chain that are composed of N-rich proteins. However, decreasing the size of the antennae that captures photons has the disadvantage that it either reduces the functional absorption cross section (σPSII) or decreases the number of photosystem components,
thereby reducing the rate at which electrons can flow through the photosynthetic electron transport chain (1/τPSII) (Moore
et al., 2006;Lewis et al., 2018). Another phytoplankton response to N limitation may be an increase in NO3− transporters
(Hildebrand and Dahlin, 2000) which likely leads to increased N uptake rates when NO3− becomes available. However,
other data suggest transporter numbers per cell are constant whether N is limiting or not (Zehr et al., 1988). In addition to changes in transporter proteins, N-limited phytoplankton cells have increased protease activities and decreased protein concentrations, particularly the carbon fixation enzyme ribulose 1,5-bisphosphate carboxylase/oxygenase (Berges and Falkowski, 1998).
The composition of the phytoplankton community can also change upon depletion of nutrients. Typically, the community shifts toward smaller cells more adapted to low nutrient concentrations (Moore et al., 2013). Smaller cells have a higher surface area to volume ratio and lower nitrogen requirements, and thus a competitive advantage under low nutrient conditions. Evidence in the Arctic shows that as the freshwater content has increased, nutrient availability has decreased and phytoplankton communities are shifting toward smaller cells (Li et al., 2009;
Lee et al., 2013). If trends of decreasing ice concentrations and increasing sea surface temperatures continue for the Arctic Ocean, a potential future could include a more stratified water column with less available nutrients for phytoplankton and heterotrophic prokaryotes. As such, the shift toward smaller phytoplankton cells described in Li et al. (2009) would be expected to continue and become more widespread.
Given the current Arctic Ocean environmental changes, we designed the present study with the objective of gaining a better understanding of how phytoplankton and heterotrophic prokaryotes currently utilize NO3− in the Chukchi Sea. As
such, we tested the response of the phytoplankton and heterotrophic prokaryote communities to additions of NO3−,
and followed changes in nutrient concentrations, bulk Chl a, and active fluorescence. Additionally, we measured changes in the abundance of the ∼<10 µm sized phytoplankton cells, taxon-specific C content of phytoplankton ∼>8 µm, size fractionated (<1 µm and >1 µm) particulate organic N and carbon (C), and NO3− and CO2 uptake rates. Finally, we
measured changes in the abundance and production of the heterotrophic prokaryote populations. The results are discussed with respect to how predicted changes in the Western Arctic Ocean will affect phytoplankton and heterotrophic prokaryote communities and their impact on the biogeochemistry of the region.
MATERIALS AND METHODS
Study Site and Sampling Locations
Between June 25 and July 29, 2011, six nutrient addition bioassays were conducted in the Chukchi Sea as a part of the Impacts of Climate on EcoSystems and Chemistry of the Arctic Pacific Environment (ICESCAPE) field campaign (Figure 1A). Experiments were conducted at four on-shelf and two off-shelf stations. The experiments were conducted in three different surface water masses (Figure 1B), including ACW (Stations 8, 46, and 152), BCSW (Station 73), and off-shelf meltwater-influenced waters (Stations 101 and 128).
NO
3−Addition Experiments
Seawater was collected from the upper mixed layer at all stations using a CTD rosette outfitted with twelve 30 L Niskin bottles. Water was sampled from within the mixed layer at all sites except the two farthest offshore (Stns. 101 and 128) (Table 1). Mixed layer depth (MLD) was determined as inPalmer et al. (2013). Once onboard, water was randomly dispensed into 2 L acid-washed polycarbonate bottles through 100 µm Nitex mesh to remove grazers. The experiments were not intended to quantify grazers or grazing rate and thus they were removed from both treatments to isolate the effect of NO3−
on the phytoplankton and heterotrophic prokaryote community. Triplicate bottles were filled for two treatments (control and +NO3−) and 5–7 sampling time points. The +NO3− bottles
were amended with NO3− such that final concentrations were
∼5 mmol NO3− m−3, except at station 8 where the NO3−
T ABLE 1 | Initial conditions for bioassay experiments. Station 8 46 73 101 128 152 Latitude ( ◦N) 65.7 72.0 72.1 73.9 72.8 71.3 Longitude ( ◦W) 168.8 165.9 163.8 159.1 151.9 157.1 MLD (m) 8 25 14 19 38 16 Euphotic depth 1% (m) 21.8 NA 11.5 NA 89.9 31.5 Sampling depth (m) 2.0 6.0 3.0 25.0 63.0 7.0 Surface P AR (µ mol photons m − 2s − 1) 881 817 1849 1941 767 948 Temperatur e ( ◦C) 2.6 2.9 0.39 − 1.03 − 0.68 7.0 Salinity 32.0 31.7 30.8 28.6 30.8 31.2 NO 3 − (mmol m − 3) 2.7 (0.13) b.d. b.d. 0.03 (0.01) 0.5 (0.02) b.d. NO 2 − (mmol m − 3) 0.06 b.d. b.d. b.d. 0.06 b.d. NH 4 + (mmol m − 3) 1.6 (0.06) 0.1 (0.01) b.d. b.d. b.d. b.d. PO 4 3 − (mmol m − 3) 0.9 (0.01) 0.5 (0.03) 0.6 (0.01) 0.6 (0.01) 0.9 (0.01) 0.5 (0.01) Si(OH) 4 (mmol m − 3) 13.4 (0.06) 1.3 12.2 (0.12) 2.8 (0.06) 5.2 2.4 (0.06) POC (mmol m − 3) 16.5 (2.80) 12.8 (0.06) 19.2 (1.6) 4.1 (0.20) 4.5 (2.0) 8.7 (0.60) POC < 1.0 µ m (mmol m − 3) 12.2 (0.80) 2.0 (0.40) 6.3 (0.80) 2.0 (0.40) 1.9 (0.10) 5.1 (0.50) PON (mmol m − 3) 1.8 (0.20) 2.4 (0.70) 1.4 (0.20) 0.7 (0.70) 0.4 (0.12) 1.0 PON < 1.0 µ m (mmol m − 3) 1.6 (0.10) 1.4 (0.1) 1.3 0.2 (0.10) 0.3 (0.10) 0.8 (0.10) Chlor ophyll a (mg m − 3) 1.3 (0.11) 0.6 (0.18) 0.7 (0.09) 0.1 (0.01) 0.3 (0.03) 0.3 (0.02) phytoplankton (cells m − 3) 4.9 × 10 9(2 × 10 9) 1.4 × 10 10 (4.7 × 10 10 ) 2.8 × 10 9(5.7 × 10 9) 3.1 × 10 9(6.2 × 10 7) 1.0 × 10 10 (2.6 × 10 8) 9.3 × 10 9(7.5 × 10 8) Fv /F m 0.37 (0.010) 0.43 (0.005) 0.31 (0.010) 0.39 (0.007) 0.44 0.49 σPSII (× 10 − 20 m 2quanta − 1) 360 (10.0) 334 (4.1) 297 (10.0) 375 (8.1) 495 (5.9) 306 (3.6) 1/ τQA (ms − 1) 1.0 (0.01) 1.3 (0.14) 1.0 (0.05) 0.7 (0.09) 1.1 (0.08) 1.2 (0.06) CO 2 -fixation (mg C m − 3d − 1) 8.3 (0.45) 12.6 (0.25) 3.4 (1.82) 3.6 (0.09) 37.7 (0.66) NO 3 − uptake (mmol NO 3 − m − 3d − 1) 1.0 (0.16) 0.4 (0.26) 0.02 (0.003) 0.2 (0.016) 0.01 (0.002) 0.01 (0.006) > 1 µ m cells % contribution of NO 3 − uptake 100 3.3 100 100 37.5 100 Heter otr ophic pr okaryote Abundance (× 10 8cells m − 3) 2.2 (0.002) 1.9 (0.006) 1.7 (0.002) 0.7 (0.0002) 2.4 (0.001) 0.6 (0.0001) Heter otr ophic pr okaryote Pr oductivity (µ g C m − 3d − 1) 69.5 (21.10) 38.9 (19.40) 70.9 (16.70) 14.9 (11.00) 58.5 (3.20) 11.1 (8.90) % High nucleic acid cells 73.2 (0.30) 57.6 (2.90) 79.5 (1.70) 45.9 (1.60) 34.8 (0.40) 30.6 (1.20) Numbers in () are ± 1 standard deviation.
The bottles were sealed and placed in on-deck flow-through incubators cooled with surface seawater and shaded to 50% of incident irradiance using neutral density screening. Triplicate bottles of each treatment were analyzed at multiple sampling time (T) points (T = 0, 24, 48, 72, and 96 h). At the two off the shelf stations (Stations 101 and 128), samples were also collected at T = 120 and 144 h. Incubation times were relatively long because sea surface temperatures were low (−1.0 – 2.9◦
C) at all sites except one (St. 152) (Table 1) and phytoplankton growth rates were expected to be low.
Samples were collected at each time point for the measurement of nutrient concentrations [NO3−, NO2−,
NH4+, PO43−, Si(OH)4], Chl a concentration, maximum
photochemical efficiency of PSII (Fv:Fm), effective optical
cross section of PSII (σPSII), turnover time of the primary
electron acceptor at PSII (τQa), phytoplankton cell abundance
(∼<10 µm) and heterotrophic prokaryote abundance and production. At the initial and final time points, size fractionated samples (<1.0 µm and total community fractions) were also collected for quantification of particulate organic carbon and nitrogen (POC and PON) concentrations and CO2fixation and
NO3−uptake rates. Finally, the C content of the most abundant
phytoplankton taxa (∼>8 µm) was measured as described in
Laney and Sosik (2014).
Nutrient Analysis
Nutrient samples were analyzed on a segmented continuous flow autoanalyzer (AA3, Seal Analytical) within an hour of collection. NO3− + NO2− and Si(OH)4 concentrations were determined
using a modification of the Armstrong et al. (1967) methods. NH4+ concentrations were determined fluorometrically
(Kerouel and Aminot, 1997). PO43− concentrations were
measured using the ammonium molybdate method described in Bernhardt and Wilhelms (1967). It should be noted that all nutrients were measured on unfiltered seawater which can impact measured concentrations when particulate loads are high due to nutrient release from particles. For the most part, surface nutrients were depleted, indicating that our sampling was after the major growth season and consequently, particulate loads were low.
Particulate Analysis
Samples for fluorometric analysis of Chl a were filtered onto 25 mm Whatman GF/F filters (nominal pore size 0.7 µm), placed in 5 mL of 90% acetone, and extracted in the dark at 3◦
C for 24 h. Chl a was measured fluorometrically ( Holm-Hansen et al., 1965) using a Turner Fluorometer 10-AU (Turner Designs, Inc.). POC and PON samples were size-fractionated by filtering samples onto 0.2 and 1.0 µm silver filters (Sterlitech Corporation). Blank filters for each size fraction were made by passing ∼25 ml of 0.2µm filtered seawater over the respective pore-sized silver filters and processed the same as the particulate samples. The filters were immediately dried at 60◦
C and stored dry until processing. Prior to analysis, the samples were fumed with concentrated HCl (37%) for ∼12 h, dried (60◦
C), and packed into tin capsules (Costech Analytical Technologies, Inc.) for analysis on an Elementar Vario EL Cube or Micro Cube
elemental analyzer (Elementar Analysensysteme GmbH, Hanau, Germany) interfaced to a PDZ Europa 20-20 isotope ratio mass spectrometer (Sercon Ltd., Cheshire, United Kingdom). Peach leaves and glutamic acid were used as calibration standards. The limits of detection for POC and PON, calculated as three times the standard deviation of the average blank filters, were 1.8 and 18µg N and C, respectively.
Phytoplankton and Heterotrophic
Prokaryote Abundance
A flow cytometer (Accuri C6, Becton-Dickson) was used to determine the abundance of phytoplankton<10 µm. A detailed description of the flow cytometric protocols used here is outlined in Laney and Sosik (2014). Briefly, seawater samples were prefiltered through Nitex screening (200 µm mesh size) to remove larger cells, chains, and colonies that might clog the instrument flow cell. For phytoplankton cells, approximately 200 µl of sample were counted. Distilled water blanks were measured after each set of samples at every station, and standard beads (PeakFlow P14827, 2.5 µm, 515 nm emission) were also run periodically during the cruise to track instrument behavior, to determine the instrument sensitivity in detecting cells or other particles, and to provide reference data for normalizing the phytoplankton cell scattering measurements into bead units. Custom software was used to interpret the measured cell scattering and fluorescence data and determine the abundance of <10 µm cells. Phytoplankton cells were discriminated from other particles by their relative combinations of chlorophyll fluorescence and side scattering. Phytoplankton taxa (∼>8 µm) were enumerated using an Imaging FlowCytobot (IFCB) as described inLaney and Sosik (2014). The IFCB uses a combination of flow cytometric and video technology to capture high-resolution images of phytoplankton in the nano- and micro-size fraction (Olson and Sosik, 2007). Briefly, seawater samples (5 ml) were injected through an 860 µm × 180 µm flow cell through which a 635 nm laser beam was focused. Chl a-containing particles that passed through this beam emitted a fluorescence signal that triggered the digital camera capturing a micrograph of that particular cell, chain, or colony. A Nitex screen (nominal mesh size 130µm) placed on the sample intake prevented large particles from clogging the flow cell. This screen, combined with the camera field of view, set the effective upper size limit of cells, chains, or colonies to a length <∼300 µm. The lower size limit of cells was a function of the minimum fluorescence intensity needed to trigger the camera, typically>8 µm. The cells imaged using the IFCB allowed for quantification of different taxa in the> 8 µm size class. Additionally, non-algal classes such as detritus and diatom frustules were also identified in images where present. Using the same methods presented in
Laney and Sosik (2014), the data were converted to equivalent C units for each taxonomic group.
Heterotrophic prokaryotes were counted on board using a 488 nm laser on the flow cytometer. Samples were fixed with glutaraldehyde (0.25% final concentration) and stored at −80◦
C until processing (within a few days after collection). Samples were thawed and SYBR Green-I was added at a final dilution of 1:10,000. Samples were incubated in the dark for 15 min before
analysis. Heterotrophic prokaryotes were identified on a plot of green fluorescence (515–545 nm) versus right-angle light scatter (SSC), using the green fluorescence as a threshold parameter. The prokaryote population was sorted into the commonly grouped high nucleic acid (HNA) and low nucleic acid (LNA) containing cells (Gasol and Del Giorgio, 2000) according to their green fluorescence and counted separately (Marie et al., 1997).
FRRf Measurements
The bulk Fv:Fm, σPSII, and 1/τQa of the phytoplankton
community was measured on dark-acclimated (30 min.) aliquots of initial and treated waters using a Light Induced Fluorescence Transients Fast Repetiton Rate fluorometer (LIFT-FRRf1). Briefly,
the sample chamber was exposed to a FRRf excitation protocol composed of a series of microsecond-long flashlets of controlled excitation power. The saturation phase of the excitation was comprised of 100 flashlets at 2.5 ms intervals. With the pulse excitation power of 30,000–50,000 µmol quanta m−2 s−1, the
rate of excitation delivery to PSII centers far exceeded the capacity of photosynthetic electron transport between PSII and PSI. This resulted in a progressive saturation of the observed fluorescence transients within the first 40–60 flashlets, at a rate proportional to the functional absorption cross section. The saturation phase was followed by 90 flashlets applied at exponentially increasing time intervals starting at 20 ms, over a period of 250 ms. As the average excitation power decreased, the fluorescence signal relaxed with kinetics mostly defined by the rate of electron transport between PSII and PSI. Each sample measurement consisted of an average of 32 transients, and each sample was measured three times. Blanks for individual samples analyzed by FRRf were prepared by gentle filtration through a 0.2 mm polycarbonate syringe filter before measurement using identical protocols. All reported values were corrected for blank effects (Cullen and Davis, 2003). Recorded fluorescence transients were processed with FRRf software1to estimateFm,Fv/Fm,σPSII, and
1/τQa for all Chl a-containing cells (excitation wavelength of
470 nm).
Rate Measurements
Samples for the determination of 14CO2-fixation and NO3−
uptake rates were measured at T = 0 and T = final. 14CO2
-fixation rates were determined by measuring14C-incorporation
in subsamples collected from the triplicate control and NO3−
amended bottles. To 150 mL of sample, 0.74 MBq of H14CO3was
added and incubated in the on-deck incubators at 50% incident irradiance for 24 h. After incubation, 30 mL was filtered onto 25 mm GF/F filters in triplicate under very low vacuum pressure (<2.5 mm Hg). The filters were transferred to glass scintillation vials acidified with 0.1 mL of 6 N HCl and allowed to sit over the next 24 h to drive off unincorporated inorganic C. After the acidification step, 5 mL of scintillation cocktail (Ecolume) was added to each sample, which were counted (after >3 h) on a PerkinElmer Tri-Carb liquid scintillation counter. Total activity was determined on each sample by combining 50µL of sample with 50µL of ethanolamine, 0.5 mL filtered seawater, and 5 mL
1http://soliense.com/
of scintillation cocktail.T = 0 samples were filtered (30 mL in triplicate) and acidified at the start of the incubation period. Rates of CO2 fixation were then calculated as outlined inKnap et al.
(1996).
Initial and final NO3− uptake rates were determined by
measuring the incorporation of15NO
3−into the total and>1 µm
particulate matter fractions. At each time point, a 20 mL sample was collected to determine the concentration of NO3−in the 2 L
experiment bottles and then trace additions (∼10% of ambient [NO3−]) of 99% Na15NO3were made to each bottle. Immediately
following this spike, subsamples collected from each bottle were filtered onto silver filters (0.2 or 1.0µm pore size for the total and>1.0 µm size fractions, respectively) for determination of theT = 0 atom%15N. The spiked bottles were returned to their incubators for 24 h after which subsamples were collected onto silver filters, as done at the start of rate measurement. All filters were prepared for analysis in the same manner as the POC/PON filters. All enriched isotope analyses took place on a Micro Cube elemental analyzer (Elementar Analysensysteme GmbH, Hanau, Germany) interfaced to a PDZ Europa 20-20 isotope ratio mass spectrometer (Sercon Ltd., Cheshire, United Kingdom). The isotopic enrichment of each sample was determined as atom% 15N where atom%15N = 14N+15N15N and NO3− uptake
rates were determined as inGlibert and Capone (1993). The limit of detectable enrichment (0.04%) was determined as three times the standard deviation of theT = 0 samples.
Heterotrophic prokaryote production (BP) was measured by
3H-leucine incorporation (Smith and Azam, 1992). Samples
(1.5 mL in triplicate plus one killed control) were added to sterile microcentrifuge tubes containing 20–30 nM [4,5-3 H]-leucine. This concentration was sufficient to saturate heterotrophic prokaryote leucine uptake. Incorporation rates were measured after 2 h incubations at in situ temperature and incubations were stopped by the addition of trichloroacetic acid (5% final concentration). The mean sample dpm was on average 4.4-fold greater than the mean blank dpm. Contamination was not detected in the leucine batches. Leucine incorporation rates were converted to C production using the conversion factor of 1.5 kg C produced per mole leucine incorporated (Kirchman, 1993), assuming no isotope dilution.
Comparison Between Experiments
The similarity of responses between the different experiments were analyzed by comparing the treatment to the control response at T = final for multiple variables. Hierarchical clustering using Ward’s minimum variance method was used to group experiments with similar relative responses. Visualization of the relative responses and the hierarchical clustering were calculated using RStudio v.1.1.453 and the gplots and ggdendro packages.
RESULTS
Initial Conditions
The initial starting conditions were partially dictated by where on the shelf, and thus in what water mass, the experimental
water was collected (Figure 1B). The temperature and salinity relationships indicate that surface waters at Stns. 8, 46, and 152 were ACW. Of these, the coastal Stn. 152 was the warmest (∼7◦
C), with both Stns. 8 and 46 being approximately 4◦
C cooler. While the entire water column was well mixed at Stn. 8, the same was not true at Stn. 46 (MLD = 25 m, Table 1) where surface ACW overlaid a BCSW layer and a WW bottom layer. Stratification at Stn. 152 was relatively weak, with only a 0.25 difference in salinity between the surface and bottom water. The surface water at Station 73 was a shallower (MLD = 14 m) BCSW layer while the bottom layer was WW. Finally, the two stations located furthest north, at the shelf break (Stn. 101, MLD = 19 m) and off the shelf (Stn. 128, MLD = 38 m), were characterized by low salinity meltwater at the surface overlying BCSW and WW (Figure 1B).
Significant concentrations of dissolved inorganic nitrogen (DIN) were detected only at Stn. 8 (Bering Strait) and Stn. 128 (off-shelf easternmost site) (Table 1 and Figure 1A). At the Bering Strait station, both NO3− (2.7 ± 0.3 mmol m−3,
mean ± SD) and NH4+ (1.6 ± 0.6 mmol m−3) concentrations
were relatively high, while at Stn. 128, detectable NO3−
concentrations (0.5 ± 0.02 mmol m−3) were measured only
in relatively deep (63 m) waters. At the sampling depth at all other stations, the DIN concentrations were below or at the limit of detection of our instrument. In contrast, PO43−
was detectable at all sites, and as with DIN, Stns. 8 and 128 had the highest concentrations (0.9 mmol m−3) (Table 1).
Si(OH)4 was also detectable at all stations, with Stn. 8 having
the highest concentrations (13.4 ± 0.06 mmol m−3
). Similarly, high concentrations of Si(OH)4were measured at the shelf Stn. 73
(12.2 ± 0.12 mmol m−3), while at the remaining stations, initial
Si(OH)4concentrations ranged between 1.3 and 5.2 mmol m−3.
The initial concentrations of Chl a in waters used for the experiments ranged from 0.1 to 1.3 mg m−3
, being highest at the southernmost Bering Strait station (1.3 ± 0.11 mg m−3
) and generally decreasing northward (Table 1). Additionally, initial Chl a concentrations were significantly correlated to Si(OH)4
concentrations [slope = 0.6µg Chl a µmol−1Si(OH)
4,r = 0.78,
p < 0.05], although not to other dissolved nutrient pools. Autotrophic cell abundance showed no trends with latitude. Concentrations of POC and PON were higher at the shelf stations relative to the two northern off-shelf stations (Stns. 102 and 128). Fv:Fmof initial samples ranged approximately 1.5-fold, from
0.31 to 0.49, while σPSIIranged 1.6-fold (297–495 × 10−20 m2
quanta−1
) and 1/τQA ranged 1.9-fold (0.7–1.3 ms−1). Neither
Fv:Fm, σPSII, nor 1/τQA changed systematically with either
latitude, surface irradiance, or nutrient concentrations. However, bothFv:Fm andσPSIIincreased significantly with MLD (Fv:Fm
vs. MLD: m = 0.003 m−1, r = 0.63, p< 0.05; σ
PSII vs. MLD:
m = 4.6 × 10⁻²⁰m quanta−1,r = 0.77, p< 0.05). There was no
relationship between 1/τQAand MLD.
CO2 fixation rates of the initial samples were highest at the
inshore coastal station (Stn. 152: 37.7 ± 0.66 mg C m−3 d−1)
followed by the two mid-shelf stations (Stn. 46: 8.3 ± 0.45 mg C m−3 d−1 and Stn 73: 12.6 ± 0.25 mg C m−3 d−1). The
lowest initial rates of CO2 fixation were measured at the two
northern stations (Stn 101: 3.4 ± 1.82 mg C m−3
d−1
and Stn.128: 3.6 ± 0.09 mg C m−3d−1). No data were available for the Bering
Strait station (Stn. 8). Overall, the rate of CO2fixation was highly
correlated with sea surface temperature (CO2 fixation rate vs.
temp.: m = 3.9 mg C m−3 d−1 ◦C−1,r = 0.92, p< 0.05), but
was independent of nutrient concentration and MLD.
The initial rate of NO3−uptake was highest at the Bering Strait
(Stn. 8, 1.0 ± 0.16 mmol NO3− m−3d−1, Table 1). At the two
mid-shelf sites, NO3−uptake was variable, with the rate at Stn. 46
(0.4 ± 0.26 mmol NO3−m−3d−1) being 20-fold higher than at
Stn. 73 (0.02 ± 0.003 mmol NO3−m−3d−1). Similarly, the rate
of NO3− uptake differed between the two most northern sites,
where rates measured at Stn. 101 (0.2 ± 0.016 mmol NO3−m−3
d−1
) were 20-fold higher than at Stn. 128 (0.01 ± 0.002 mmol NO3− m−3 d−1). At the coastal ACC site (Stn. 152), rates
were also low (0.01 ± 0.006 mmol NO3−d−1). Similar to CO2
fixation rate, NO3− uptake rate was independent of nutrient
concentrations or MLD, but was highly correlated with sea surface temperature (NO3−uptake rate vs. temp.:m = 0.16 mmol
NO3−m−3d−1 ◦C−1,r = 0.89, p< 0.05).
Lastly, initial heterotrophic prokaryote abundance was highest at the Bering Strait site (Stn. 8: 2.2 ± 0.20 × 10⁸cells m−3) and
the coastal ACC station (Stn.152: 2.4 ± 0.05 × 10⁸cells m−3).
Only slightly lower abundances were measured at the two mid-shelf sites (Stn. 46: 1.9 ± 0.06 × 10⁸ cells m−3
and Stn. 73: 1.7 ± 0.16 × 10⁸cells m−3) while the northern, shallower, station
(Stn. 101) and the deeper northern site (Stn. 128) had the lowest abundance of heterotrophic prokaryotes (0.6 ± 0.01 × 10⁸and 0.7 ± 0.02 × 10⁸ cells m−3, respectively). The %HNA of the
community ranged from 30.6 to 79.5% (Table 1) but showed no relationship to heterotrophic prokaryote abundance (r = 0.40, p > 0.05). Heterotrophic prokaryote production, on the other hand, was positively correlated with heterotrophic prokaryote abundance (r = 0.84, p < 0.05). As such, the mid-shelf site (Stn. 101) and the coastal ACC station (Stn. 152) had the lowest heterotrophic prokaryote production rates while the highest rates (∼5-fold higher) were measured at the Bering Strait and the other mid-shelf (Stn. 73) station (Table 1). Additionally, a weak relationship was observed between %HNA and heterotrophic prokaryote production (m = 0.53%[µg C m−3d−1]−1,r = 0.71,
p< 0.05). While heterotrophic prokaryote abundance was weakly correlated to Chla concentrations (m = 1.02 × 10⁸cells m−3
[mg Chla m−3]−1,r = 0.57, p< 0.05), both BP and %HNA were more
strongly correlated with Chla (%HNA vs. Chl a: m = 35.74%[mg Chla m−3]−1,r = 0.77, p< 0.05; BP vs. Chl a: m = 44.37 µg C m−3 d−1 [mg Chla m−3 ]−1 ,r = 0.72, p< 0.05).
Treatment Responses
NutrientsConsumption of NO3− in the control treatment at the two
sites with detectable NO3− in the sampled waters (Stns. 8 and
128) was complete during the incubations (Figures 2A,E). At all other sites, initial NO3− concentrations were undetectable
and remained so for the entirety of the experiments. NO3−
was consumed in the treated bottles of most of the experiments (Figures 2A–F). The greatest consumption was at the Bering Strait site (Stn. 8) where close to 7.0 mmol m−3
was taken up during the 96 h experiment. Consumption of NO3− at the
FIGURE 2 | Average (±SD) nutrient concentrations measured during the nutrient amendment experiments. Solid lines are control and dashed lines are treated bottles. NO3−and PO43 −(A–F), NH4and NO2−(G–L), Si(OH)4(M–R).
mid-shelf site (Stn. 46) NO3− consumption was ∼1.75 mmol
m−3. Likewise, NO
3−was taken up in the treated bottles at the
coastal shelf site (Stn. 152, ∼1 mmol m−3) and at the deeply
sampled off-shelf site (Stn. 128, ∼3 mmol m−3
). At only the shallow off-shelf site (Stn. 101) there was an insignificant amount of NO3−consumed in the treated bottles during the experiment.
PO43− was consumed more in the +NO3− treatments than
in the controls in three of the six experiments (Stns. 8, 73, 152) (Figures 2A–F). The greatest difference between treated and controls was at the mid-shelf site (Stn. 73), where close to 0.3 mmol PO43− m−3 was consumed in waters with added
NO3−, relative to no PO43− uptake in the control. At Stns.
8 and 128, the differences in PO43− consumption between
the control and treated bottles was <0.15 mmol m−3. At the
more deeply sampled off-shelf site, which had initially detectable NO3− concentrations, approximately 0.05 mmol PO43− m−3
was consumed in both the control and treatment, while at the shallowly sampled off-shelf site, no PO43−uptake was detected
during the incubation. Likewise, at the mid-shelf site (Stn. 46) no PO3−uptake was recorded in either the control or the NO3−
treated bottles.
NH4+ concentrations were only initially detectable
(∼1.65 mmol m−3) at the Bering Strait site (Stn. 8) and
were depleted at the same rate in both the control and +NO3− treatments by theT = 72 h sampling (Figures 2G–L).
Concentrations then rose to ∼0.25 mmol m−3
in both treatments at the finalT = 96 h time point. The only other site with detectable T = 0 NH4+ concentrations was the mid-shelf site (Stn. 46)
where concentrations were ≤0.1 mmol m−3. These NH 4+
concentrations remained low until the final 48 h in both treatments when they started to increase. NH4+concentrations
remained below detection (0.02 mmol m−3
) in both treatments at the other mid-shelf site (Stn. 73) and at the shallowly sampled off-shelf site (Stn. 101). At the more deeply sampled off-shelf site (Stn. 128), NH4+ was only detectable at theT = 48 h time
point in the +NO3− treatment, while at the coastal site (Stn.
152) NH4+concentrations rose to detectable levels (∼0.04 mmol
m−3
) in both the control and NO3−treated bottles.
Concentrations of NO2− were only initially detectable at
the Bering Strait site (Stn. 8) and the deeply sampled off-shelf site (Stn. 128) (Figures 2G–L). The NO2−concentrations were
depleted in the control treatment during all experiments at these sites. At all other sites, NO2− remained undetectable in the
controls throughout the experiments. At multiple sites, however, NO2−concentrations increased in the +NO3−treatment during
the incubations. For example, at the Bering Strait site (Stn. 8), the NO2− concentrations were 0.04 mmol m−3 higher
at the end of the experiment (Figure 2G). Likewise, NO2−
concentrations rose 0.08 and 0.03 mmol m−3 at the mid-shelf (Stn. 73) and coastal sites (Stn. 152), respectively (Figures 2I,L). No significant increases in NO2− concentrations were recorded
in the treated bottles at the shallowly sampled off-shelf site (Stn. 101) (Figure 2J), and they remained below detection (0.03µmol L−1
) at the deeply sampled off-shelf site (Stn. 128) (Figure 2K). Finally, Si(OH)4 was detectable at the start of all the
experiments (Figures 2M–R). At only three sites (Stn. 8, Stn. 73, and Stn. 152) did concentrations decrease over the course of the experiments. There was no treatment effect at the Bering Strait site (Stn. 8) (Figure 8M), while consumption of Si(OH)4 was
stimulated in the NO3− treated bottles relative to the control at
the mid-shelf (Stn. 73) (Figure 2O) and coastal (Stn. 152) sites (Figure 2R). At Stn. 73, ∼4 mmol Si(OH)4m−3was consumed
in the +NO3− treatment while only 0.8 mmol Si(OH)4 m−3
was consumed in the control. This difference was less at the coastal site [Stn. 152, Control: 0.5 mmol Si(OH)4m−3, +NO3−
treatment: 0.8 mmol Si(OH)4m−3].
Pigments and Biomass
NO3− addition resulted in Chl a concentrations that were
1.4 – 6.8-fold above the control at all sites except the mid-shelf sites (Stn. 46) (Figures 3A–F). The difference between control and treatment Chl a concentrations was lowest at the two sites with initially detectable levels of NO3−
(Stn. 8. treatment:control accumulation ratio = 1.4, Stn. 128 treatment:control accumulation ratio = 1.8) (Figures 3A,E). At those sites where NO3−was not detected in the sampled water,
the treatment:control Chl a accumulation ratios were much higher (4.6 – 6.8) (Figures 3C,D,F).
The abundance of phytoplankton cells <10 µm responded similarly to the addition of NO3− as did Chla concentrations,
with two exceptions (Figures 3G–L). First, there was no significant treatment difference in the abundance of the<10 µm phytoplankton in the Bering Strait experiment (Stn. 8), with both the control and NO3−treatments showing similar increases.
Secondly, a treatment difference in<10 µm phytoplankton cell abundance was detected at the mid-shelf site Stn. 46 with the NO3− treatment having ∼2-fold higher abundance than the
control (which showed no increase) at the final time point (T = 96 h). This was in contrast to the Stn 46 Chl a response which showed no increase in either the control or NO3− treatments
(Figure 3B). At all other sites, the final abundance of the <10 µm phytoplankton cells was higher (1.5–3.6-fold) in the +NO3− treatment than in the control. It should be noted that
in those experiments with no initially detectable NO3−, the final
abundance of the<10 µm phytoplankton cells in the control was not significantly different from the start, while at the Bering Strait and deeply sampled off-shelf site, increases were observed in both the control and NO3−treatments (Figures 3G,K). Additionally,
in all experiments, except for the shallowly sampled off-shelf station (St. 101), the C concentration of the >8 µm class increased in response to the addition of NO3−(Figures 4A–L).
Concentrations of POC and PON also tracked the changes observed in Chla concentrations, with relatively greater increases observed in the NO3−-amended waters (Figures 3M–X). Notable
exceptions were again observed in the experiments at the Bering Strait (Stn. 8) and the first mid-shelf site (Stn. 46). At the former
FIGURE 3 | Response of chlorophyll a (A–F), phytoplankton (<10 µm) cell concentration (G–L), POC (M–R) and PON (S–X) concentrations to the addition of NO3−. Shown are average (±SD) concentration at each time point sampled.
0.0 0.5 1.0 1.5 2.0 0 48 72 96 0.0 0.5 1.0 1.5 2.0 0 48 72 96 0.0 0.1 0.2 0.3 0.4 0.5 0 48 96 0.0 0.1 0.2 0.3 0.4 0.5 0 48 96 0.0 1.0 2.0 3.0 4.0 0 24 72 0.0 1.0 2.0 3.0 4.0 0 24 72 0.00 0.01 0.02 0.03 0 48 144 0.00 0.01 0.02 0.03 0 48 144 0.0 0.1 0.2 0.3 0.4 0.5 0 48 144 0.0 0.1 0.2 0.3 0.4 0.5 0 48 144 0.0 0.1 0.2 0.3 0.4 0.5 0 Time (h) 96 Time (h) 0.0 0.1 0.2 0.3 0.4 0.5 0 96 Algal C (mmol m -3) Algal C (mmol m -3) Algal C (mmol m -3) Algal C (mmol m -3) Algal C (mmol m -3) Algal C (mmol m -3) Unclassified nanophytoplankton Unclassified nanophytoplankton Unclassified nanophytoplankton Unclassified dinoflagellates Unclassified pennates other classes other classes Chaetoceros Psuedonitzschia Chaetoceros Psuedonitzschia Thalassisira Thalassisira Fragilariopsis Chaetoceros Unclassified dinoflagellates other classes Unclassified pennates Thalassiosira Unclassified nanophytoplankton Chaetoceros other classes Diatom Fragments Unclassified dinoflagellates Unclassified nanophytoplankton Chaetoceros other classes Unclassified dinoflagellates Leptocylindrus Thalassisira Fragilariopsis CONTROL +NO3-St. 8 St. 46 St. 73 St. 101 St. 128 St. 152 A B C D E F G H I K J L
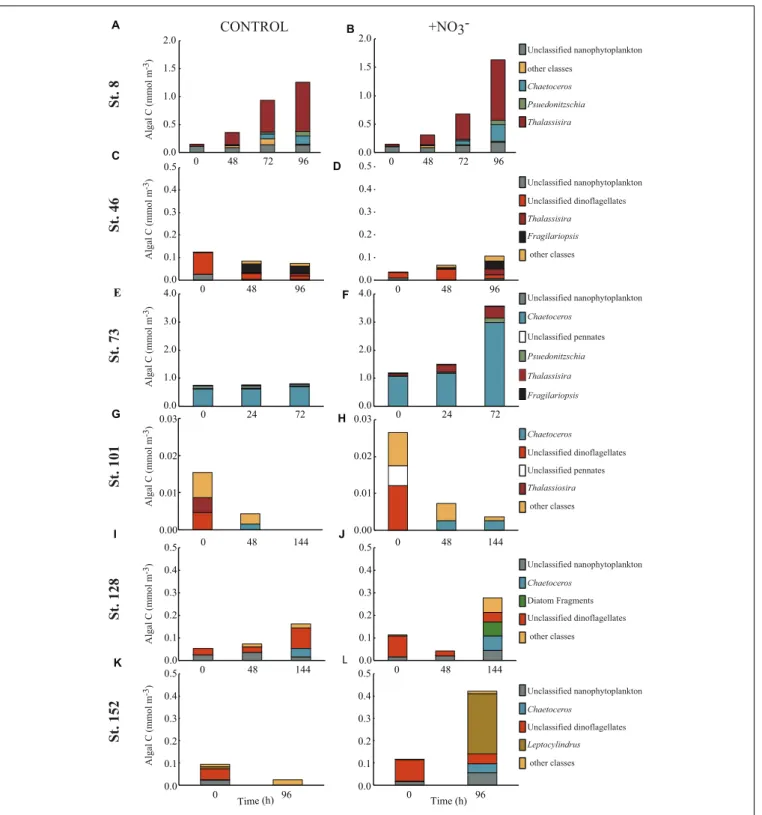
FIGURE 4 | Concentration of phytoplankton biomass (mmol C m−3) found in the top 5–6 contributing taxonomic classes in the control (A,C,E,G,I,K) and nutrient
amended (B,D,F,H,J,L) treatments.
site, both the control and treated waters increased two–threefold in POC and PON while at the latter site POC and PON remained unchanged in both the control and treated bottles. At the remaining sites, relatively greater increases in both POC and PON were detected where NO3−was added, although little
difference in PON was detected at the shallowly sampled off-shelf site (Stn. 101) (Figure 3V) because of high variability due to sample mass being close to detection limits.
The POC and PON responses by the two size classes measured varied in the different experiments. At the second mid-shelf site
(Stn. 73), the >1 µm-sized POC comprised ∼33% of the total POC pool. AtT = final, this increased to 85 and 96% in the control and +NO3− treatments, respectively. PON of the>1 µm size
class, on the other hand, made up 80–90% of the initial PON pool but was only 70% of the total pool in the control, and 94% of the total pool in the NO3−-amended bottles, atT = final. The
two off-shelf sites differed from one another in that the primary particulate organic response at the shallowly sampled site was dominated by the<1 µm size fraction (i.e., while the total POC concentration increased, the>1 µm fraction remained constant) (Figure 3P). At the more deeply sampled off-shelf site (Stn. 128), this was not the case; the>1 µm sized POC increased from 30–40 to 50–60% of the total POC pool between the start and end of the incubation (Figure 3Q). Thus, while the<1 µm fraction was a significant component of the initial POC pool, accumulation of POC during the incubation was dominated by the >1 µm fraction. This was similar for PON at this station as well. Finally, there was no change in the amount of POC, or relative fraction of the>1 µm component in the control at the coastal site (Stn. 152). However, POC was stimulated by the addition of NO3−at
this site, although the relative fraction of POC>1 µm remained unchanged at 60% over the course of the experiment (Figure 3R). The PON response at this site differed with the fraction of total PON in the >1 µm size class, dropping from ∼73 to 63% in both the control and NO3− treatments during the experiment
(Figure 3X).
Composition of the POC Pool
The >8 µm phytoplankton size fraction decreased 86% at the shallowly sampled off-shelf site (Figure 4H). At all other sites, the POC concentration of the>8 µm phytoplankton size class increased where NO3− was available, primarily due to
diatom growth (Figures 4B,D,F,J,L). The diatom Thalassiosira was dominant, responding in the experiments at the Bering Strait site (Stn. 8) and the second mid-shelf site (Stn.73) (Figures 4B,E), while at the first mid-shelf site (Stn. 42) diatoms (e.g.,Thalassiosira and Fragilariopsis) combined for ∼60% of the C increase in the>8 µm phytoplankton size class (Figure 4D). At the deeply sampled off-shelf site (Stn. 128), a mix of diatoms, nanoflagellates, and “other classes” all increased, while dinoflagellates decreased (Figure 4J). At the coastal site (Stn. 152) diatoms dominated the increase, primarilyLeptocylindrus which increased ∼200%, from<0.01 to 0.27 mmol C m−3(Figure 4L).
However, phytoplankton did not comprise the largest fraction of the>8 µm particulate pool. At all sites, except for the mid-shelf sites (Stn. 46 and 73), detritus made up >50% of the initial particulate C pool (Figures 5C,E). In the case of Stn. 46, the particulate pool was composed of a mix of detritus (∼46% in T = 0 control) and phytoplankton that could not be classified as either diatom, dinoflagellate, prymnesiophyte, or nanoflagellate (i.e., “other taxa”) (53%), while at Stn. 73, diatoms made up 85–88% of the initial particulate C pool. Composition of the initial non-detrital C pool at the non-mid-shelf sites was a mix of different algal taxa. At the Bering Strait site (Stn. 8), nanoflagellates and diatoms dominated the algal portion of the particulate C pool while at the off-shelf shallow site (Stn. 101), the algal particulate pool was composed primarily of equal
fractions (5–14%) of diatoms and dinoflagellates (Figures 5G,H). At the more deeply sampled off-shelf site, nanoflagellates (5–15%) and dinoflagellates (17–28%) dominated the starting algal community (Figures 5I,J). Finally, at the coastal site, the algal fraction of the particulate C pool was made up of diatoms (2–5%), nanoflagellates (4–6%), and dinoflagellates (15–26%) (Figures 4K,L).
Across all experiments, diatoms were the phytoplankton taxonomic group that responded most to the addition of NO3−
(Figure 5). Changes in the relative abundance of diatoms ranged from 12 to 41% across all experiments, with the greatest relative increases being at the first mid-shelf site (Stn. 46, 41%), the deeply sampled off-shelf site (Stn. 128, 37%) and the coastal site (Stn. 152, 39%) (Figures 5D,I,J). Diatoms in the control also became a relatively greater fraction of the phytoplankton community at several sites, although the changes were smaller (max = 16% at Stn. 42).
Active Fluorescence Measurements
Fv:Fmwas variable with respect to treatment differences between
experiments (Figures 6A–F). At three sites there was a clear increase in Fv:Fm in the NO3− treated waters relative to the
controls. At the second mid-shelf site (Stn. 73), the shallowly sampled off-shelf site (Stn. 101), and the coastal site (Stn. 152), Fv:Fmwas 1.3-, 1.7-, and 1.1-fold higher in the +NO3−treatment
than in the control atT = final (Figures 6C,D,F). At the Bering Strait site,Fv:Fm was higher atT = final relative to the initial,
although the response in the control and NO3− treated waters
was the same (Figure 6A). In contrast to these four sites, the +NO3− treatment had a lowerFv:Fmrelative to the control at
some point during the incubation (Figures 4B,E) at the first mid-shelf site (Stn. 46) and the deeply sampled off-shelf site (Stn. 128), although the control and NO3− treated waters were the
same at T = final. At both these sites, Fv:Fm was depressed at
T = final relative to initial values, while the reverse was true (i.e., it was stimulated) at Stns. 8, 73, 101, and 152 in the NO3−treated
bottles.
There was no clear trend across experiments in the response of σPSIIwith respect to the addition of NO3−(Figures 6G–L).σPSII
decreased in both the control and treated bottles at the Bering Strait site (Stn. 8), both mid-shelf sites (Stn. 46 and 73), and the deeply sampled off-shelf site (Stn. 128). The decrease ranged from 6 to 30% of initial values, and was greater in the control than the +NO3−treatment at Stns. 46 and 128. In contrast, a greater
σPSII decrease was observed in the control at Stn. 73 while no
treatment difference was observed at the Bering Strait site (Stn. 8). At the shallowly sampled off-shelf site (Stn. 101),σPSIIincreased
10% relative to initial values whereas the control showed little difference atT = final (Figure 6J). There was little to no treatment effect inσPSIIover the incubation period at the coastal site (Stn.
152) (Figure 6R).
Lastly, 1/τQawas generally higher in the +NO3−treatments
relative to the control at all sites during the incubation period (Figures 6M–R), except for the coastal station (Stn. 152) (Figure 6R). The difference was greatest at the off-shelf sites where 1/τQa in the +NO3− treatment was 34 and 52% higher
Time (h) Time (h) Particulate C (%) Particulate C (%) Particulate C (%) Particulate C (%) Particulate C (%) Particulate C (%) Particulate C (%) Particulate C (%) Particulate C (%) Particulate C (%) Particulate C (%) Particulate C (%) 0% 25% 50% 75% 100% 0 48 72 96 0% 25% 50% 75% 100% 0 48 72 96
Diatom
Nanoflagellates
Dinoflagellates
Prymnesiophytes
Detritus
Other Groups
0% 25% 50% 75% 100% 0 48 96 0% 25% 50% 75% 100% 0 48 96 0% 25% 50% 75% 100% 0 48 96 0% 25% 50% 75% 100% 0 48 96 0% 25% 50% 75% 100% 0 48 144 0% 25% 50% 75% 100% 0 48 144 0% 25% 50% 75% 100% 0 48 144 0% 25% 50% 75% 100% 0 48 144 0% 25% 50% 75% 100% 0 96 0% 25% 50% 75% 100% 0 96 CONTROL +NO3-St. 8 St. 46 St. 73 St. 101 St. 128 St. 152 A B C D E F G H I J K LFIGURE 5 | Fraction of particulate C biomass separated into algal taxonomic groups or detritus during the control (A,C,E,G,I,K) and nutrient amended (B,D,F,H,J,L) treatments. Other groups represent phytoplankton that do not fall into one of the listed categories.
mid-shelf sites and the Bering Strait site, the +NO3−treatment
increased 12–23 and 5%, respectively.
CO2Fixation and NO3−Uptake Rates
CO2fixation rates were stimulated 1.3–8.0-fold above the initial
rates in the +NO3treatment in all experiments, and significantly
above the control treatment (2.1–14.3-fold) in all experiments except at Stn. 8 (Bering Strait) and Stn. 73 (mid-shelf station)
(Figures 7A–F). The greatest increase in stimulation relative to the control was at the shallowly sampled off-shelf (Stn. 101) and coastal sites (Stn. 152) where the treated waters were ∼13–14-fold higher than the controls. NO3− stimulated CO2 fixation rates
above the controls at one of the mid-shelf sites (Stn. 46) and at the deeply sampled off-shelf site (Stn. 128), although the increases were less than above, exhibiting 2.2- and 3.3-fold higher rates, respectively.
FIGURE 6 | Response of FRRf parameters [Fv:Fm(A–F),σPSII(G–L), 1/τQA(M–R)] to the addition of NO3−. Shown are averages (±SD) at each time point sampled.
NO3− uptake rates were stimulated relative to initial rates
in the +NO3− treatments in all the experiments except at the
mid-shelf station 46 (Figures 7G–L). However, the addition of NO3−stimulated uptake relative to the control at only three of
those five stations (73, 128, and 152). In these experiments, NO3−
uptake rates were 14–78-fold higher in the +NO3− treatment
than in the controls (Figures 7I,K,L). NO3− uptake rates were
usually highest in the >1 µm size fraction (Figures 7M–R), although uptake by<1 µm cells was still significant in several experiments. For example, the<1 µm sized cells accounted for ∼40–90% of NO3−uptake at the mid-shelf Stn. 46 (Figure 7N).
Additionally, at the shallow off-shelf site (Stn. 101), the<1 µm sized cells accounted for>90% of measured NO3− uptake rates
in the control treatment, but only 25% in the +NO3−treatment
(Figure 7P). The reverse was true at the coastal site (Stn. 152) where NO3−uptake in the<1 µm size fraction was undetectable
in the control but accounted for ∼50% of the measured rate in the +NO3−treatment (Figure 7R).
Heterotrophic Prokaryote Abundance and Production
There was little treatment difference with respect to abundance of heterotrophic prokaryotes across all experiments
FIGURE 7 | Carbon fixation rate (A–F) and NO3−uptake rates (G–L) of the bulk phytoplankton and microbial community at initial and final (Control and +NO3−) time
points in the NO3−amendment experiments. Fraction of the NO3−uptake rate attributable to the<1 µm and >1 µm fractions of the community in each NO3−
(Figures 8A–F). Only the two mid-shelf sites (Stn. 46 and 73) showed a higher abundance (∼12 and 26%, respectively) of heterotrophic prokaryotes where NO3− was added
(Figures 8B,C). Despite changes in heterotrophic prokaryote production during the experiments, within treatment variability was high and virtually no treatment differences were detected (Figures 8G–L). Only at the shallowly sampled off-shelf site (Stn. 101) was a treatment difference in heterotrophic prokaryote production rate detected, with the +NO3− treatment having a
4.8-fold higher rate than the control at T = final (Figure 8J). Finally, while changes in the percent of the heterotrophic prokaryote community composed of HNA-containing cells changed in the different experiments (e.g., increased 20–50% in 4 of the 6 experiments), no effect of the added NO3−was detected
(Figures 8M–R).
Summary
The relative responses of different variables in the treatments compared to the controls can be used to determine how similarly the different experiments responded to the +NO3− additions
(Figure 9). For example, across all experiments, consumption of PO43− was greater in the NO3− treatment than in the
control by the final time point. The same was not true for Si(OH)4, where only three of the experiments (Stns. 73, 128, and
152) responded to the NO3− addition with increased Si(OH)4
consumption. Likewise, total POC concentrations increased in the treated waters, relative to the controls, at all sites except the Bering Strait site (Stn. 8). Overall, the cumulative response to NO3− additions was similar between Stns. 73 and 152. These
two stations showed relatively greater nutrient consumption, phytoplankton biomass, particulate nutrient concentrations, and NO3−uptake rates in the treated waters than in the control. Of
the remaining stations, which clustered together despite some differences, the response to NO3−was most similar between Stn.
46 and 128. Both had relatively similar responses in POC and PON concentrations, CO2fixation, NO3−uptake, heterotrophic
prokaryote production rates, and 1/τQAStn. 8 was the next most
similar to these stations, while the response at Stn. 101 was the most different from any of the stations in this second cluster. Despite the differences between the stations, the overall biological response across all experiments suggested that NO3−resulted in
greater consumption of PO43− and increases in phytoplankton
cell abundance (<10 µm), POC and PON, CO2fixation, NO3−
uptake, andFv/Fm, but a decrease in 1/τQA.
DISCUSSION
Phytoplankton Response to Added NO
3−Oura priori hypothesis was that N availability was the primary factor limiting phytoplankton productivity in the Chukchi Sea during the summertime. Apart from the Bering Strait, the surface waters of the Chukchi Sea were depleted of DIN, and thus were consistent with this hypothesis. The three sites on the shelf (Stns. 46, 73, and 152) all had undetectable surface concentrations of NO3− and NO2−, while NH4+ was detectable only at Stn. 46.
Additionally, while NO3−was barely detectable at the shallowly
sampled off-shelf site (Stn. 101), both NO2−and NH4+were also
depleted. On the other hand, Stn. 128, which was sampled deeper, did have some available NO3− and NO2−. In contrast to DIN,
PO43− and Si(OH)4 were detectable at all sites on and off the
shelf.
The biological responses from the three shelf sites, and both off-shelf sites, suggested that the phytoplankton community
FIGURE 8 | Heterotrophic prokaryotic abundance (A–F), heterotrophic prokaryotic production (G–L), and percent of heterotrophic prokaryotic abundance comprised by high nucleic acid (HNA) cells (M–R) in the NO3−addition experiments.
FIGURE 9 | Comparison of different experiments showing the relative response (+NO3−: Control) for multiple variables in each experiment. Dotted
line indicates value of 1 while solid line indicates the value of the responses. Values ≥ 3 are indicated by solid line on the right edge of the box. Hierarchical clustering using Ward’s minimum variance method was used to group experiments with similar relative responses.
was N-limited. Concentrations of Chl a, POC, PON, and the proportion of phytoplankton <10 µm increased more in the NO3−-treated samples than in the controls. Likewise,
CO2 fixation and NO3− uptake rates were higher in the
NO3−-amended treatment at four of the six stations (not Stns.
8 and 46), especially where surface N was fully depleted. Across multiple experiments, diatom abundance increased in response to this NO3− addition. However, the expected coincident
decrease in Si(OH)4 concentrations due to this diatom growth
was not always observed. Finally, while both the Fv/Fm and
σPSIIresponses were variable, with only three of the six stations
showing a similar response to NO3−(i.e., an increase), 1/τQAwas
consistently higher in the +NO3−-treatment than in the control
(discussed below). Together, these biological responses can be interpreted as direct confirmation of proximal N-limitation of the summertime Chukchi Sea phytoplankton community.
Previous work supports N-limited phytoplankton productivity in Arctic waters, with several studies indicating that N is the first nutrient depleted during the spring bloom.
Tremblay and Gagnon (2009) reviewed multiple studies and found that the magnitude of the N inventory at the start of the phytoplankton growing season was the primary predictor of water column primary productivity, more so than light or temperature. They noted a positive relationship between phytoplankton productivity and depth and open water duration,
suggesting that deeper waters have a larger reservoir of available N that can be mixed upward during storms and/or upwelling periods. The longer ice-free periods allow for a greater likelihood of mixing of nutrients into surface waters, and thus productivity in these waters is sustained by the vertical nutrient fluxes.
Tremblay and Gagnon (2009) concluded that only external N inputs, such as river runoff rich in DON or atmospheric deposition, can increase phytoplankton productivity of shallow seas, like the Chukchi Sea, beyond what the start of the season N inventory provides.
Likewise, Yun et al. (2016) related primary production of the Chukchi Sea to nutrient availability. However, they indicated that increased freshwater content results in a decreased NO3− inventory, and consequently, decreased rates of primary
production. In fact, they note a decreasing trend in primary production rates in the Chukchi Sea between 1974 and 2012, and suggest that this is the result of a 30–50% decrease in the Chukchi Sea nutrient inventory and associated 40% decrease in depth-integrated Chl a concentration associated with the noted increase of freshwater to the Chukchi Sea (Serreze et al., 2006). Data from the ICESCAPE campaign do not support the conclusion of Yun et al. (2016) that primary productivity is decreasing in the Chukchi Sea. Lewis et al. (2018) show that productivity during our study period averaged 2.5 ± 4.6 g C m−2d−1over 39 stations in the Chukchi Sea, which was greater
than in any of the studies cited by Yun et al. (2016). In fact, the highest numbers they cite (Hameedi, 1978) were collected in July, the same month as the ICESCAPE campaign. Generally, primary productivity is relatively high in June/July and decreases as nutrients are consumed during the summer season, such that by August/September nutrients are consumed and productivity is low. Satellite ocean color data confirm this seasonal cycle between July and September (Pabi et al., 2008). The multi-decadal decreasing trend noted by Yun et al. (2016) likely reflects the expected annual cycle of productivity and nutrient consumption over the shelf captured during field campaigns conducted over multiple years, with each sampling progressively later in the seasonal cycle. TheYun et al. (2016)conclusions directly contrast the continued increase of Chukchi Sea open water annual net primary production rates estimated by Arrigo and van Dijken (2015) using ocean color satellites, which was linked to greater open water areas and longer open water duration. If the greater open water area is associated with deeper regions of the shelf, the longer open water duration may provide greater opportunity for storms to result in mixing of deeper nutrient reservoirs that increase areal phytoplankton productivity rates (Pabi et al., 2008).
Additional evidence from the ICESCAPE field campaign supports the importance of N as the primary driver of phytoplankton productivity on the Chukchi Shelf during the summer. Enhanced phytoplankton biomass in the Chukchi Sea during both 2010 and 2011 was usually associated with WW (Lowry et al., 2015), defined as water with a potential temperature of ≤−1.6◦
C, but also containing high nutrient concentrations (Pickart et al., 2016). For example, during ICESCAPE, NO3−
concentrations on the Chukchi Shelf were ∼11 times higher in WW than non-WW (Lowry et al., 2015). In regions on the


![FIGURE 6 | Response of FRRf parameters [F v :F m (A–F), σ PSII (G–L), 1/ τ QA (M–R)] to the addition of NO 3 −](https://thumb-eu.123doks.com/thumbv2/123doknet/14797550.604606/14.892.61.829.95.459/figure-response-frrf-parameters-f-psii-qa-addition.webp)


