HAL Id: hal-00303832
https://hal.archives-ouvertes.fr/hal-00303832
Submitted on 11 Feb 2005HAL is a multi-disciplinary open access
archive for the deposit and dissemination of sci-entific research documents, whether they are pub-lished or not. The documents may come from teaching and research institutions in France or abroad, or from public or private research centers.
L’archive ouverte pluridisciplinaire HAL, est destinée au dépôt et à la diffusion de documents scientifiques de niveau recherche, publiés ou non, émanant des établissements d’enseignement et de recherche français ou étrangers, des laboratoires publics ou privés.
The surface properties of SOA generated from limonene
and toluene using specific molecular probes: exploration
of a new experimental technique
B. Demirdjian, M. J. Rossi
To cite this version:
B. Demirdjian, M. J. Rossi. The surface properties of SOA generated from limonene and toluene using specific molecular probes: exploration of a new experimental technique. Atmospheric Chemistry and Physics Discussions, European Geosciences Union, 2005, 5 (1), pp.607-654. �hal-00303832�
ACPD
5, 607–654, 2005
A new experimental technique for determining the SOA
surface properties B. Demirdjian and M. J. Rossi Title Page Abstract Introduction Conclusions References Tables Figures J I J I Back Close
Full Screen / Esc
Print Version Interactive Discussion
Atmos. Chem. Phys. Discuss., 5, 607–654, 2005 www.atmos-chem-phys.org/acpd/5/607/
SRef-ID: 1680-7375/acpd/2005-5-607 European Geosciences Union
Atmospheric Chemistry and Physics Discussions
The surface properties of SOA generated
from limonene and toluene using specific
molecular probes: exploration of a new
experimental technique
B. Demirdjian1*and M. J. Rossi1
1
EPFL (Ecole Polytechnique F ´ed ´erale de Lausanne), LPAS (Laboratoire de Pollution Atmosph ´erique et Sol), CH-1015 Lausanne, Switzerland
*
Present address: CRMC-N/CNRS, Campus de Luminy, Case 913, 13288 Marseille cedex 09, France
Received: 13 December 2004 – Accepted: 13 January 2005 – Published: 11 February 2005 Correspondence to: M. J. Rossi ([email protected])
ACPD
5, 607–654, 2005
A new experimental technique for determining the SOA
surface properties B. Demirdjian and M. J. Rossi Title Page Abstract Introduction Conclusions References Tables Figures J I J I Back Close
Full Screen / Esc
Print Version Interactive Discussion Abstract
A new experimental technique of characterizing the aerosol-atmosphere surface has been explored using three examples: the secondary organic aerosols (SOA) result-ing from the reaction of limonene with O3 and from the photooxidation of toluene in comparison with the combustion aerosol (soot) from a toluene diffusion flame. Rather
5
than investigating the bulk composition of the aerosol by complete chemical analysis and identification of the many dozens if not more of constituent compounds we have interrogated the type and number of functional groups located at the aerosol surface by interacting them with specific molecular probes such as O3, NO2, N(CH3)3, and NH2OH to probe for the presence of oxidizable sites, acidic sites and carbonyl functionalities,
10
respectively, that are present on the surface of the aerosol particle. In practice, typ-ical amounts of one to a few mg of laboratory-generated SOA of limonene, toluene and soot have been deposited on a PTFE membrane filter that subsequently has been transferred to a molecular flow reactor used for the titration reaction of the surface func-tional groups by the molecular probes. Absolute amounts Ni with i=O3, NO2, N(CH3)3,
15
NH2OH of probe molecules taken up by the filter sample measured using molecular beam sampling mass spectrometry have been converted into the number of surface group functionalities per unit surface area S using the aerosol particle distribution func-tion (PDF) of limonene and toluene SOA and the BET total surface area of toluene flame soot to result in Ni/S. Arguments are presented that support the transfer of the
20
PDF of the suspended to the aerosol collected on the Teflon filter.
1. Introduction
Atmospheric particles occur in all strata of the atmosphere from the planetary bound-ary layer to the middle stratosphere and affect the atmosphere in a variety of ways (Finlayson-Pitts and Pitts, 2000; Thomas et al., 1989). On a global scale they directly
25
ACPD
5, 607–654, 2005
A new experimental technique for determining the SOA
surface properties B. Demirdjian and M. J. Rossi Title Page Abstract Introduction Conclusions References Tables Figures J I J I Back Close
Full Screen / Esc
Print Version Interactive Discussion
primary role in air pollution and control of atmospheric composition, visibility and hu-man health on a regional and local scale (Haywood and Boucher, 2000; Ramaswamy et al., 2001; Ramanathan et al., 2001; K ¨unzli et al., 2000). For instance their role in cli-mate change has been brought to the fore because of the large persistent uncertainties concerning the impact of aerosols on the radiative forcing owing to the lack of
informa-5
tion (Ravishankara, 1997) on their chemical composition and critical gaps in scientific understanding of the gas-to-particle processes and chemical transformation mecha-nisms involved (Ramaswamy et al., 2001; Ravishankara, 1997). Atmospheric aerosols affect the radiation budget directly by scattering and absorbing solar and planetary ra-diation and indirectly by acting as cloud condensation nuclei that consist of particles
10
larger than 50 nm in radius (Novakov et al., 1997; Facchini et al., 1999b). The radiative forcing of aerosols not only depends on their spatial distribution, but also on the size, shape, and chemical composition that control their optical properties (Ramaswamy et al., 2001).
Far from the emission sources these atmospheric particles are for the most part not
15
homogeneous in nature and usually present complex structural and chemical features that are caused by their origin, history, lifetime, aging processes and their exposure to atmospheric trace gases. Widespread occurrence of organic and inorganic species which are often mutually and homogeneously mixed within the same particle and thus constitute internal rather than external mixtures (Middlebrook et al., 1998; Noble and
20
Prather, 2000; Allan et al., 2003) implies a general presence of an organic chemical fraction within individual atmospheric particles (Novakov and Corrigan, 1996; Jacobson et al., 2000; Charlson et al., 2001; Andreae, 2001; Rudich, 2003). For instance, organic coatings may form on inorganic particles such as sea salt and mineral dust (Cruz and Pandis, 1998; Posfai et al., 1998; Ellison et al., 1999). In some cases these organic
25
coatings profoundly affect particle hygroscopicity, heterogeneous chemical reactivity and transport properties of aerosols (Saxena et al., 1995; Decesari et al., 2003).
This work is focused on Secondary Organic Aerosol (SOA) because a considerable fraction of atmospheric aerosols (10–60%) contains organic compounds (Novakov and
ACPD
5, 607–654, 2005
A new experimental technique for determining the SOA
surface properties B. Demirdjian and M. J. Rossi Title Page Abstract Introduction Conclusions References Tables Figures J I J I Back Close
Full Screen / Esc
Print Version Interactive Discussion
Corrigan, 1996; Jacobson et al., 2000; Charlson et al., 2001; Andreae, 2001; Rudich, 2003; Seinfeld and Pandis, 1998). On a global scale the SOA burden from oxidation of biogenic hydrocarbons is comparable to the one predicted from black carbon, ni-trate and ammonium aerosols (Griffin et al., 1999). Moreover, the inorganic aerosol fraction is relatively well investigated, whereas the composition and processes of
for-5
mation of the organic fraction are not as well known. In fact, the analytical task of discovering the detailed chemical composition of the organic fraction of atmospheric aerosols remains a daunting and challenging task to this day (Middlebrook et al., 1998; Noble and Prather, 2000; Allan et al., 2003; Tobias and Ziemann, 2000) despite the re-cent advances in analytical techniques in regards to atmospheric particulate analysis
10
such as aerosol mass spectrometry (AMS) and thermal desorption chemical ioniza-tion mass spectrometry (TDCIMS) (Zhang et al., 2004; Smith et al., 2004). Prevailing scientific opinion has it that a detailed analytical investigation of the bulk composition of aerosol particles is a necessary prerequisite for the fundamental understanding of gas-to-particle conversion processes. This work intends to show an alternate path at
15
characterizing only a small albeit relevant part of the chemical composition of SOA, namely that fraction that is directly interacting with the atmosphere at the surface of the particle.
SOA precursors have primary sources such as hydrocarbon or wax emissions from vegetation, combustion, biomass burning or sea spray carrying organic material from
20
the ocean’s surface. Alternatively, SOA may form in situ by photochemical oxidation re-actions of gas phase organics involving OH, O3and NO3which will result in low-vapor pressure oxygen-containing compounds that either form new particles in gas-to-particle conversion processes (Tobias and Ziemann, 2000; Odum et al., 1997; Facchini et al., 1999a; Pankow, 1998) or condense on existing airborne or seed particles through
het-25
erogeneous nucleation (O’Dowd et al., 2002a, b). While it seems clear that biogenic VOC contribute to organic aerosol mass, their role in the process of new particle for-mation is still uncertain. There is evidence from field observations that monoterpene oxidation products are linked to growth rather than to formation of new particles during
ACPD
5, 607–654, 2005
A new experimental technique for determining the SOA
surface properties B. Demirdjian and M. J. Rossi Title Page Abstract Introduction Conclusions References Tables Figures J I J I Back Close
Full Screen / Esc
Print Version Interactive Discussion
gas-to-particle formation processes (Janson et al., 2001). The resulting aerosols may also provide reactive sites for heterogeneous reactions (Ravishanakra, 1997) that can modify the oxidative capacity of the troposphere. In order to understand the mecha-nisms involved in such reactions characterization of the organic content and the degree of partial oxidation of the constituent hydrocarbons owing to the oxidizing atmosphere
5
would be beneficial.
2. Scope of the present work
The present work intends to show a possible way to characterize the surface func-tional groups of aerosol particles generated under well-controlled laboratory conditions as these functional groups either interact with atmospheric gases or the condensed
10
phase such as solid mineral supports or biological membranes. In order to identify and quantify these functional groups we have chosen a titration technique using a gas-phase probe molecule undergoing a specific heterogeneous chemical reaction. For demonstration purposes we have chosen the following four specific probes: O3, NO2, N((CH)3)3, and NH2OH to probe for the presence of oxidizable sites, acidic sites and
15
carbonyl functionalities, respectively. This allows us to characterize with great speci-ficity the surface of laboratory generated organic aerosol surrogates using gas-phase probes rather than the examination of the particle composition. This approach is by no means a substitute for rigorous analytical work performed on SOA aimed at complete characterization of the particle composition which presents useful clues as to its origin
20
and atmospheric aging processes. However, it leaves open the question which part of the SOA particle interacts with the gas phase on a given time scale (Jacobson et al., 2000; Rogge et al., 1993).
Such rigorous analytical work is necessary and must continue in the framework of unraveling the precursors to and the mechanism of SOA formation. Our approach
25
attempts to answer the question regarding the molecular composition of the aerosol particle surface that is the gateway to the interaction between the aerosol particle and
ACPD
5, 607–654, 2005
A new experimental technique for determining the SOA
surface properties B. Demirdjian and M. J. Rossi Title Page Abstract Introduction Conclusions References Tables Figures J I J I Back Close
Full Screen / Esc
Print Version Interactive Discussion
atmospheric gases on the one hand, and on the other hand determines the bonding of the aerosol particles to mineral and biological supports such as bacterial membranes and biological tissue.
The main focus of the present work is the demonstration of the surface-specific prob-ing technique usprob-ing a stable and reproducible source of laboratory-generated aerosol
5
particles of some relevance to the atmosphere. The monoterpene limonene (C10H16) has been chosen as a SOA precursor for this study in view of its high yield for SOA formation (Griffin et al., 1999) as well as its known oxidation product spectrum, reac-tion kinetics and mechanism in both O3 and OH-induced oxidation reactions (Larsen et al., 2001; Rohr et al., 2003; Liu et al., 2004). We have chosen toluene (C7H8) as
10
an anthropogenic VOC since it is the most abundant aromatic compound in urban air whose source may be traced back to the evaporation of fuel additives and the use of aromatic solvents. Typically, it corresponds to approximately 6% of the concentration of the observed non-methane hydrocarbons (Jeffries, 1995). In addition, toluene is the aromatic hydrocarbon with the highest aerosol-forming potential of whole gasoline
15
vapors which was established in a study that suggested that the aromatic content was solely responsible for a fuel’s SOA forming potential (Odum et al., 1997). As a com-parison with toluene SOA from photooxidation we examine the interfacial properties of a combustion aerosol using toluene as a fuel in order to compare the interfacial properties of a photochemically produced SOA with a combustion aerosol.
20
3. Description of the experimental apparatus and procedures
3.1. Aerosol generation
The principal goal of this section is to describe the aerosol generation using a high-yield, reliable and stable aerosol source for the following surrogate aerosol parti-cle characterization experiments. SOA partiparti-cles are generated from the oxidation of
25
ACPD
5, 607–654, 2005
A new experimental technique for determining the SOA
surface properties B. Demirdjian and M. J. Rossi Title Page Abstract Introduction Conclusions References Tables Figures J I J I Back Close
Full Screen / Esc
Print Version Interactive Discussion
the photooxidation of toluene under similar conditions using a UV lamp (150W high-pressure Hg/Xe arc lamp in an AMKO type 1000 water cooled lamphousing equipped with a parabolic mirror). The IR radiation emitted by the Hg/Xe arc was filtered out by a 8 cm pathlength circulating water filter equipped with two 200diameter quartz win-dows such that the temperature in the aerosol reactor was measured as 296±2 K. The
5
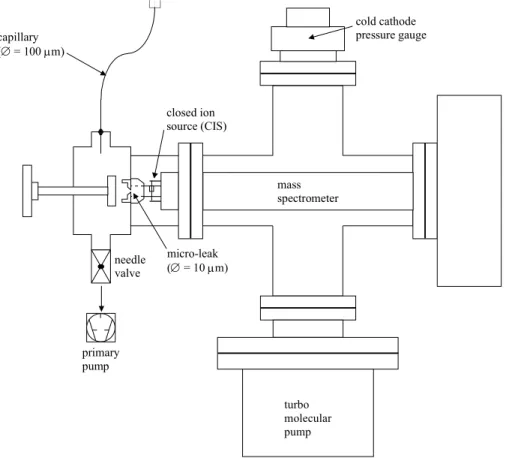
UV radiation was filtered using a 3 mm thick long-pass UV cut-off filter that presented a transmission of 50% at 280 nm (WG 280, Schott). The SOA production takes place in a cylindrical reaction cell (volume∼=480 cm3) equipped with a 300diameter quartz window at each end (Suprasil 2, HERAEUS) as displayed in Fig. 1. The typical concentra-tions of limonene (≥96%, FLUKA AG) and toluene (99%, ALDRICH) are approximately
10
1000 ppm. O3is generated in a flow discharge generator (ozone generator 502, FIS-CHER) and condensed at 198 K on silica-gel. The O3 concentration in the reaction cell, measured by UV absorption at 253 nm, is on the order of 100 ppm. In order to prevent excessive oxidation of the freshly prepared aerosols by excess O3 a denuder tube coated with KI was placed downstream of the flow reactor in order to disable
con-15
tinuous exposure of the SOA mass collected on the particle filter to ozone. Typical gas phase residence times within the flow reactor range from 0.5 to 2 min that were adjusted by changing the gas flow rate at an atmospheric pressure of air. The gas phase residence time downstream of the reactor within the tubing down to the filter and the particle sizing equipment was typically a few seconds at the prevailing gas
20
flow rates. Subsequently, the flow was passed across a PTFE membrane filter (MIL-LIPORE, 0.2 µm pore diameter, 47 mm diameter) during one to two hours at constant flow rate leading to typical collected sample masses in the range of 1 to 10 mg. This type of filter was chosen in view of its lack of uptake of the probe molecules as well as of the aerosol precursor hydrocarbons, namely limonene and toluene. Glass fiber
25
filters (Schleicher & Schuell, 47 mm diameter, type GF 6) had acidic sites that strongly interfered with the measurement of the number of acidic sites of the collected aerosol from limonene and toluene oxidation using N(CH3)3.
ACPD
5, 607–654, 2005
A new experimental technique for determining the SOA
surface properties B. Demirdjian and M. J. Rossi Title Page Abstract Introduction Conclusions References Tables Figures J I J I Back Close
Full Screen / Esc
Print Version Interactive Discussion
3.2. Measurement of the aerosol precursor hydrocarbon in the aerosol flow tube The gas phase within the atmospheric pressure flow tube is monitored on-line using a differentially pumped quadrupole mass spectrometer (BALZERS, Prisma QMS 200) equipped with an atmospheric sampling device. Figure 2 shows the details of the “on line” detection chamber (Stadler, 2000a). The connection between the aerosol reactor
5
and the mass spectrometer is enabled by a 25 cm long 100 µm ID diameter quartz capillary (Fused silica tubing, SUPELCO). This capillary ends in a differentially pumped inlet valve pumped by a roughing pump (BALZERS GEV 010). Only a small fraction of the gas flow effuses through a flow-controlling orifice of 10 µm diameter into the closed ion source of the QMS that is located in the detection chamber. A turbomolecular pump
10
maintains a low pressure in this chamber (P≤5×10⁻⁶mbar) in order to enable the use of the SEM detector of the mass spectrometer. Since we have noticed that during the aerosol formation the 10 µm orifice of the differentially pumped valve is rapidly clogged by particles we have put a glass fiber filter in front of the 100 µm inlet capillary at the atmospheric pressure sampling position inside the aerosol reactor. In this way, most
15
particles are retained by the filter and the gas phase monitoring may be performed unencumbered by the presence of semivolatile SOA particles.
During the aerosol generation the size distribution of SOA particles is monitored using a differential mobility analyzer (DMA, TSI Inc. Scanning Mobility Particle model 3071 A) coupled to a condensation nuclei counter (CNC, TSI Inc. model 3022 A). The
20
total count performed using an identical CNC resulted in a number larger by a factor of two compared to the integral of the particle distribution function (PDF) measured using the DMA/CNC combination. Finally, FTIR Photoacoustic Spectroscopy (PAS) (MTEC photoacoustic cell, model 300) was used to identify the nature of the surface functional groups of the aerosol particles deposited onto the filter used to support the
25
SOA samples. A clean Teflon membrane filter was used as a blank. The SOA mass was routinely determined gravimetrically using an analytical balance prior to the uptake experiments performed in a Knudsen flow reactor.
ACPD
5, 607–654, 2005
A new experimental technique for determining the SOA
surface properties B. Demirdjian and M. J. Rossi Title Page Abstract Introduction Conclusions References Tables Figures J I J I Back Close
Full Screen / Esc
Print Version Interactive Discussion
The soot samples are produced in a controlled and reproducible way from the com-bustion of liquid toluene in a diffusion flame using a co-flow air-fuel device that was operated on a fuel-rich flame leading to so-called “gray” soot. The device as well as the composition and properties of the “gray” soot are described in more detail in the work of Stadler and Rossi (2000).
5
3.3. Titration experiments
Once the membrane filter was loaded with a measured amount of SOA or soot par-ticles it was transferred immediately into the sample compartment of a Knudsen flow reactor (Stadler, 2000) and pumped using a roughing pump during approximately 90 s which directly pumps the sample chamber. Once the pressure was deemed to be low
10
enough, say in the fractional mb range, molecular beam sampling could be initiated. The used titration technique makes use of a heterogeneous chemical reaction between the aerosol condensed phase supported on the filter and a gas-phase probe molecule whose nature determines the surface functional groups of the aerosol. The probe molecules used are ozone (O3), nitrogen dioxide (NO2), trimethylamine (N(CH3)3), and
15
hydroxylamine (NH2OH). NO2(CARBAGAS) is diluted into oxygen (1:10) and stocked in darkness during approximately 14 h in order to convert traces of NO into NO2 that are always present as a contaminant. Subsequently, NO2 is frozen at approximately 193 K in a darkened vessel and O2pumped off. N(CH3)3was purchased from SIGMA-ALDRICH (purum≥99%). Finally NH2OH is prepared by thermal decomposition of
hy-20
droxylammonium phosphate according to the method of Schenk (1963). Small aliquots of the solid salt were decomposed in the vacuum inlet line prior to use owing to the re-activity of free NH2OH with air.
ACPD
5, 607–654, 2005
A new experimental technique for determining the SOA
surface properties B. Demirdjian and M. J. Rossi Title Page Abstract Introduction Conclusions References Tables Figures J I J I Back Close
Full Screen / Esc
Print Version Interactive Discussion 4. Results and discussion
4.1. SOA metrology
Once again we need to stress that the primary purpose of the present work is to ex-plore the capabilities of the aerosol surface characterization technique using a stable and reliable source of aerosols whose particle distribution function (PDF) is discussed
5
in Appendix A. In this work we have chosen three types of aerosols based on the pre-cursor hydrocarbons limonene and toluene, namely SOA of limonene and toluene as well as a combustion aerosol from a toluene diffusion flame.
4.2. SOA yields
The chemical mechanism of SOA formation under our experimental conditions is
un-10
doubtedly complex. No attempt was made to separate the effects of the individual ox-idants OH, O3and NO3on the precursor hydrocarbons as we are primarily interested in obtaining a SOA whose source was reliable and constant in order to explore the limits and scope of the proposed use of specific surface probes as a means of surface characterization. The yield of SOA was taken as a measure for the aerosol-forming
15
tendency of the hydrocarbon precursors under the chosen experimental conditions. The yield YSOA was determined using Eq. (1):
YSOA=MSOA/((Fi−Fo)MW
hc∆t), (1)
where MSOA is the gravimetrically-determined mass of SOA after the deposition time ∆t, MWhc is the molecular weight of the hydrocarbon precursor and F
i
, Fo are the
20
measured flow rates into and out of the aerosol flow reactor, respectively, in Mol per unit time.
During SOA formation we have simultaneously followed the gas phase concentra-tion of the hydrocarbon precursor using an on-line residual gas mass spectrometer (MS) in order to establish a mass balance between the disappearance of the gaseous
ACPD
5, 607–654, 2005
A new experimental technique for determining the SOA
surface properties B. Demirdjian and M. J. Rossi Title Page Abstract Introduction Conclusions References Tables Figures J I J I Back Close
Full Screen / Esc
Print Version Interactive Discussion
precursor and the collected mass of SOA. Figure 3a displays the limonene (C10H16) flow rate (Mol/h) passing through the aerosol reactor as monitored by the MS-signal at m/e 68 as a function of time. Mass 68 is the base peak of limonene whose molecular ion is at m/e 136 and corresponds to C5H+8, the mass of isoprene at half the mass of limonene. We have reasons to believe that m/e 68 is a unique marker for limonene
be-5
cause its decrease upon O3addition starting at t=500 s in Fig. 3a is larger (72%) than the one for m/e 136 which corresponds to 44% as displayed in Fig. 3a. In addition, no other isomer of limonene has a significant MS amplitude at m/e 68 which is unusual in that it represents an even mass fragment upon electron impact ionization of a hydro-carbon. Terpenes such as camphene, α- and β-pinene, ∆3-carene, β-myrcene and
10
α-phellandrene have been checked using information from the NIST Webbook (URL at
http://webbook.nist.gov/chemistry/).
We imply that a reaction product formed in the SOA generation process contributes to a fragment ion at m/e 136 that partially offsets the decrease owing to chemical reaction of limonene. This is also supported by the significant background MS signal at
15
m/e 136 once the limonene flow has been shut off after the SOA generation has been halted, as displayed in Fig. 3a at t=3300 s. However, we have no way to be sure at this time that there may also be a contribution of a fragment ion to the MS signal intensity at m/e 68 once SOA formation has started. Therefore, we regard YSOA as an upper limiting value. The addition of O3at t=500 s marks the onset of SOA formation and thus
20
of the decay of [limonene] as displayed by the decrease of the MS signal at m/e 68 to a steady-state level that is reached at t=1000 s at 72% of the original level of MS signal. Figure 3a pertains to experiment LIM3 displayed in Table 1 with a measured value of dMSOA/dt=3.43 mg/h which leads to YSOA=0.55. The decrease of m/e 68 leads to an expected loss of precursor of 6.29 mg/h. This loss is derived from the limonene partial
25
pressure of 2 Torr at 10 ml/min and the 72% disappearance of the limonene MS signal at m/e 68. This loss is overestimated by approximately 5% because the gradual decline of the MS signal at m/e 68 has been approximated by an instantaneous drop. This will lead to a slight underestimation of YSOA on a mass basis and is certainly comparable
ACPD
5, 607–654, 2005
A new experimental technique for determining the SOA
surface properties B. Demirdjian and M. J. Rossi Title Page Abstract Introduction Conclusions References Tables Figures J I J I Back Close
Full Screen / Esc
Print Version Interactive Discussion
to, albeit at the higher end of literature values (Griffin et al., 1999; Larsen et al., 2001). It is a rough guide to characterize the SOA formation process.
Figure 3b shows the decay of the toluene MS-signal by approximately 35% as soon as the UV lamp is switched on and corresponds to experiment TOL3 displayed in Ta-ble 1. The number of moles of toluene lost from the gas phase during
photooxida-5
tion corresponds to 4.5 10−6Mol/h corresponding to 0.41 mg/h based on 2 ml/min of toluene flow rate at a partial pressure of 2 Torr of toluene. Experimentally we obtain a yield 2.29 mg/h of SOA resulting in YSOA=5.59 according to Eq. (5). Since YSOA is unusually high corresponding to a 559% yield on a mass basis we assume that the additional mass collected on the filter stems from continuing reaction with both
unre-10
acted toluene and small concentrations of O3and perhaps other reactive intermediates once the SOA has been deposited on the filter. We would like to point out, however, that most of the ozone has been taken out of the reactive flow by using the KI denuder upstream of the filter as displayed in Fig. 1, whereas toluene and other reactive gases may still contribute to the observed mass increase. According to Fig. 3b there remains
15
at least 65% of unreacted toluene that may also contribute to MSOA. Molecular oxygen, O2and/or H2O may also add to trapped reactive intermediates thereby increasing their mass. As in the case of limonene the gradual decline of the MS signal at m/e 92 has been approximated by an instantaneous drop which will lead to an underestimation of YSOA by 5% or so. More importantly, the present value of YSOA for toluene may on the
20
other hand represent an upper limit value which may result from the effect of fragment contributions of the complex hydrocarbon mixture in the aerosol flow reactor to m/e 92. A lower limiting value of YSOAmay be obtained by assuming total disappearance of the toluene MS signal at m/e 92 resulting in YSOA=1.9 which is still high. High molecular weight compounds have been interpreted by Bowman and Karamalegos (2002) as an
25
indication that organic aerosol components are heavy and therefore of sufficiently low vapor pressure that they can partition out of the gas phase and condense under the chosen experimental conditions (Seinfeld et al., 2001).
ACPD
5, 607–654, 2005
A new experimental technique for determining the SOA
surface properties B. Demirdjian and M. J. Rossi Title Page Abstract Introduction Conclusions References Tables Figures J I J I Back Close
Full Screen / Esc
Print Version Interactive Discussion
4.3. Knudsen flow reactor experiments-general description of the technique
We have explored the capabilities and limitations of a chemical titration technique us-ing a gas-phase probe molecule undergous-ing a “heterogeneous chemical reaction” with surface functional groups located at the gas-condensed phase interface of the particle in question. For that purpose we have used a Knudsen flow reactor using a specific gas
5
phase probe molecule interacting with the aerosol particles that have been collected on a Teflon membrane filter. The property of the probe determines the surface functional groups of the aerosol surface that interact with the gas phase. The titration experiment is based on the measurement of the total number Ni of each type of probe molecule i that is lost from the gas phase until no more probes are taken up. At saturation of
10
the uptake the aerosol particle surface will be saturated with probe molecule I whose disappearance from the gas phase has been quantitatively measured. Ni will subse-quently be related to a geometric parameter such as the surface area given for example by the aerosol mobility diameter resulting from the measured aerosol size distribution function. This will enable the expression of the final result in terms of the surface
den-15
sity of different functional groups on the surface of the aerosol particle examined by the different probes of type i.
In order to detect the quantity of oxidizable sites we have used two oxidizing probe molecules such as O3or NO2in order to determine the number of oxidizable surface functionalities. Equation (2) schematically describes the reaction where -Cred and -Cox
20
correspond to an oxidizable and an oxidized surface site, respectively:
−Cred+ O3/NO2→ −Cox+ O2/N(II or III)(HONO or NO) (2) We have chosen the base N(CH3)3for the quantitation of acidic sites -COOH that are probed according to Eq. (3) and that result in the formation of a solid salt which is undetectable using MS. However, we cannot exclude small amounts of mineral acids
25
ACPD
5, 607–654, 2005
A new experimental technique for determining the SOA
surface properties B. Demirdjian and M. J. Rossi Title Page Abstract Introduction Conclusions References Tables Figures J I J I Back Close
Full Screen / Esc
Print Version Interactive Discussion
titration reaction:
−COOH+ N(CH3)3→ −COO−(CH3)3NH+ (3)
The free base hydroxylamine, NH2OH, has been chosen for the detection of the abun-dance of surface carbonyl groups. We expect that NH2OH is forming an oxime R1R2 -C=N-OH through a condensation reaction owing to a general acid-catalyzed reaction
5
with surface-bound carbonyl groups of the SOA sample of the type R1R2-C=O accord-ing to Reaction (4).
R1R2−C=O + NH2OH → R1R2−C(OH)(NHOH) → R1R2−C=N−OH + H
2O (4)
Most probably the general acid-catalyzed condensation Reaction (4) also acts on sur-face functionalities other than aldehydic and ketone carbonyl groups such as esters,
10
organic acids, amides, acid anhydrides and others. As such NH2OH is unable to dis-tinguish between these possibilities without additional differentiating tests.
In addition to the surface carbonyl groups that are to be determined the presence of an acid seems to be mandatory to enable Reaction (4). Control experiments with solid thin films of xanthone (C13H8O2), a solid aromatic ketone, that did not contain an
15
acid indeed did not undergo an uptake reaction with NH2OH. Reference experiments conducted on a thin deposited film of xanthone that previously had been exposed to gas phase HCl in situ did not take up NH2OH at all. Instead, when HCl reacted with NH2OH in the gas phase by letting in a separate flow of both HCl and NH2OH a rapid rate of disappearance of both NH2OH and HCl was observed, presumably forming the
20
solid salt NH3OH+Cl−that was not observed using MS. Unfortunately, the photoacous-tic FTIR absorption technique discussed in Appendix B in more detail is not sensitive enough for the identification of the reaction products of the titration reactions. For in-stance, oximes that specifically absorb between 1640 and 1690 cm−1(C=N stretching vibration) generally lack strong characteristic absorptions throughout the IR spectrum
25
(Williams and Fleming, 1971).
The use of the Knudsen flow reactor is an excellent method for establishing the total number of molecules lost from the gas phase because of adsorption and/or
re-ACPD
5, 607–654, 2005
A new experimental technique for determining the SOA
surface properties B. Demirdjian and M. J. Rossi Title Page Abstract Introduction Conclusions References Tables Figures J I J I Back Close
Full Screen / Esc
Print Version Interactive Discussion
action (Caloz et al., 1997). The absolute number of probe molecules taken up by the supported aerosol collected on the Teflon membrane filter is measured after suitable calibration of the MS. This number is subsequently put in relation to the structural pa-rameters given by the measured particle distribution function (PDF) of the collected aerosol. Below we will present experimental evidence that the PDF of the sampled
5
aerosol remains unchanged under certain experimental conditions after collection on the filter. Each titration consists of a pair of uptake experiments in which the number of molecules taken up by the loaded Teflon membrane filter is compared to the uptake of the probe gas on a blank filter, thereby assuming that the uptake of the probe gas does not change from one filter specimen to the next. This has been checked by
compar-10
ing a series of blank filter runs using a particular probe gas molecule. Therefore, the net number of molecules taken up by the collected aerosol has been obtained using Eq. (5) where Ni(aerosol+ filter) and Ni(filter) are the number of molecules of a par-ticular probe i taken up to saturation by the loaded and the blank filter, respectively. In view of the light mass loading of the filter Eq. (5) was shown to be appropriate as will
15
be discussed below.
Ni(aerosol)=Ni(aerosol+ filter)−Ni(filter) (5)
A typical titration experiment based on the uptake of a probe gas molecule is illustrated in Fig. 4. The time-dependent MS signal of O3 at m/e 48, FiO3, at 1.5 V corresponds to a flow rate of 2.0×10¹⁵molecule s−1 before the start of the uptake experiment, that
20
is in the absence of the aerosol sample, in which ozone probes for the oxidizable sites on toluene soot. The MS signal FO3(t) in the presence of the aerosol sample is pro-portional to the rate of effusion of surviving probe molecules whose flow decreases at approximately 100 s at the start of the uptake experiment owing to the interaction of O3with the deposited toluene soot aerosol during the gas phase residence time of
25
approximately 30 s in the flow reactor. During the reaction the integration of the di ffer-ence signal corresponding to the hatched area displayed in Fig. 4 directly obtains the number of probe molecules lost from the gas phase in the presence of the supported
ACPD
5, 607–654, 2005
A new experimental technique for determining the SOA
surface properties B. Demirdjian and M. J. Rossi Title Page Abstract Introduction Conclusions References Tables Figures J I J I Back Close
Full Screen / Esc
Print Version Interactive Discussion
aerosol after the flow has been calibrated in molecule s−1. The difference of O3flows with (lower MS signal, FO3(t)) and without (horizontal line at constant flow rate, FiO3) reactive substrate therefore corresponds to the quantity of molecules taken up owing to the probing reaction and equals the number of sites of the aerosol sample that inter-acts with a given probe. This difference corresponds to Ni(aerosol+ filter) and is given
5
by Eq. (6):
Ni(aerosol+ filter)= ∫(FiO3−FO3(t))dt (6)
A reference experiment that is identical to the one presented above but without aerosol on the Teflon filter yields a value for Ni(filter) that leads to Ni(aerosol) according to Eq. (5). This value essentially corresponds to a double difference and is the parameter
10
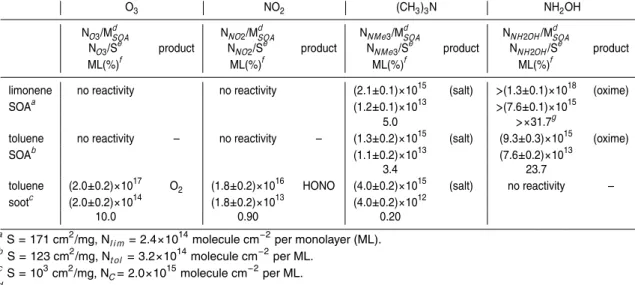
of interest that is related to the aerosol structural parameters obtained form the PDF presented above. We have used O3, NO2, N(CH3)3, and NH2OH as probe molecules and have performed titration experiments both on limonene and toluene SOA as well as toluene flame soot particles, all supported on Teflon filters. Typical results are displayed in Table 1.
15
4.3.1. Metrology of supported SOA of limonene and toluene collected on the Teflon membrane filter
The necessity for integration of the aerosol concentration in order to achieve a sufficient yield of the collected aerosol for interrogation by the molecular probes in the Knudsen flow reactor raises the question whether the PDF measured for suspended aerosols is
20
preserved or not once the aerosol has accumulated on the Teflon membrane filter. The measurement of the PDF is performed on suspended aerosol at 1 or 2 min residence time (age) whereas the collected aerosol is interrogated using the probes after accu-mulation over one to two hours which corresponds to a time scale longer by roughly two orders of magnitude. Experiments LIM4, 5 and 6 displayed in Table 1 have been
25
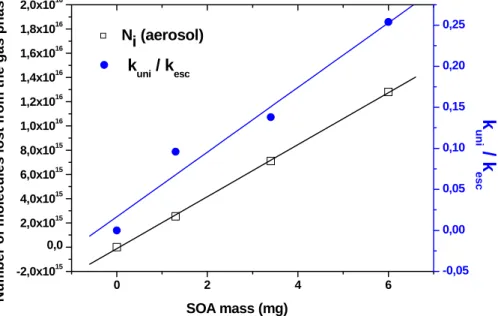
performed in order to investigate the dependence of Ni(aerosol) on MSOAof limonene for i=N(CH3)3. Figure 5 shows this dependence to be linear as is the dependence of
ACPD
5, 607–654, 2005
A new experimental technique for determining the SOA
surface properties B. Demirdjian and M. J. Rossi Title Page Abstract Introduction Conclusions References Tables Figures J I J I Back Close
Full Screen / Esc
Print Version Interactive Discussion
the uptake coefficient of N(CH3)3on the collected limonene SOA, expressed on a rela-tive scale as kuni/kesc, the values of which are displayed in the last column of Table 1. Equation (7) establishes that the relative rate constant kuni/kesc for the uptake of the probe with an uptake coefficient γ on a surface S of the aerosol in a Knudsen flow reactor whose area of the exit orifice is A is proportional to S:
5
kuni/kesc=γ(S/A) (7)
Figure 5 displays the linear relationship of S of the collected aerosol with SOA mass MSOA which leads to the important conclusion that the limonene SOA has a constant surface to mass or volume ratio under the chosen experimental conditions which is proportional to the slope of the straight line. The result that Ni(aerosol) corresponding
10
to the integral number of probe molecules that interact with the aerosol surface also scales with SOA mass MSOA as displayed in Fig. 5 means that Ni(aerosol) scales with the surface-to-mass or surface-to-volume ratio S/V of the aerosol, provided the aerosol density is constant with MSOA. The constant S/V ratio of the aerosol across the explored range of MSOA also means that the PDF of the collected SOA remains constant with
15
MSOA. Therefore, the collected aerosol particles do not undergo agglomeration and coalescence during deposition which would ordinarily lead to a change of the PDF. This result has been obtained by means of the surface sensitive uptake kinetics given in Eq. (7) and provides the justification to use the PDF of the suspended aerosol for the characterization of the collected aerosol, at least for filter loadings that are compatible
20
with constant surface to volume ratios.
Experiments LIM9 and 10 for i=NH2OH displayed in Table 1 is an additional example of this scaling behaviour that indicates the “freezing” of the PDF upon collection of the aerosol on a filter support as long as the aerosol mass loading of the filter is small. However, experiments TOL1 and 4 for i=N(CH3)3 shows scaling of Ni(aerosol) with
25
MSOA as the ratio Ni/MSOAdisplayed in column 8 of Table 1 is approximately constant over a 6.13-fold variation of MSOA, whereas kuni/kesc increases only by a factor of 1.68. We assume that at the lowest mass loading MSOA=0.8 mg (experiment TOL4 of Table 1) the surface to volume ratio S/V of the collected aerosol is given by the PDF
ACPD
5, 607–654, 2005
A new experimental technique for determining the SOA
surface properties B. Demirdjian and M. J. Rossi Title Page Abstract Introduction Conclusions References Tables Figures J I J I Back Close
Full Screen / Esc
Print Version Interactive Discussion
of the suspended aerosol measured at the exit of the aerosol reactor owing to the light mass loading of the toluene SOA. In contrast, the decrease of the S/V ratio by a factor of 3.6 at the highest mass loading of 4.9 mg (experiment TOL1 of Table 1) compared to the expected value for MSOA=0.8 mg may indicate some agglomeration of the aerosol upon collection. As discussed in Appendix A the PDF of the suspended SOA at the
5
exit of the aerosol flow tube was constant during aerosol collection to an accuracy of the order of 10% as may be seen in Figs. A2a or A2b. We conclude therefore that the decrease in S/V ratio must have occurred during aerosol collection. This goes to show that more work is needed in order to find experimental conditions that enable the collection of SOA all the while preserving the S/V ratio of the suspended aerosol.
10
We therefore use the PDF obtained from the suspended aerosol in order to put the Ni(aerosol) values into perspective by normalizing it to unit surface area. When we calculate the number of particles that form a toluene SOA particle layer across the 17.3 cm2geometrical surface area of the membrane filter using 488 nm as the effective diameter of one aerosol particle whose justification will be discussed in more detail
15
below we arrive at 17.3/(π(244×10−7)2)=9.2×109 particles trapped on the filter cor-responding to 0.6 mg. However, Fig. 5 clearly indicates that mass loadings of 6 mg of limonene SOA are still on the straight line with respect to both NN(CH3)3(aerosol) as well as kuni/kesc. This means that in this case no loss of surface of the deposited aerosol occurs even at the highest mass loading of 6 mg (experiment LIM6 displayed in Table 1)
20
under the assumption of a geometrically flat filter which obviously is too much of a sim-plification. The assumption of an effective filter area larger than the geometric one is consistent with the specification of the Teflon membrane filter given by the manufac-turer that claims a degree of 85% porosity consisting of 220 nm diameter pores. Table 2 summarizes the results of Table 1 into characteristic values of Ni(aerosol)/MSOA.
ACPD
5, 607–654, 2005
A new experimental technique for determining the SOA
surface properties B. Demirdjian and M. J. Rossi Title Page Abstract Introduction Conclusions References Tables Figures J I J I Back Close
Full Screen / Esc
Print Version Interactive Discussion
4.4. Evaluation of surface densities of functional groups Ni(aerosol)/S for toluene soot aerosol
According to experiment SOOT1 displayed in Table 1 and Fig. 4 an average of 2×10¹⁷molecules of O3 were taken up per mg of toluene soot that may be repre-sented by NO3(aerosol)/Maerosol. Although the total surface area for this type of soot
5
has not been measured, an upper limit of 100 m2/g for the BET surface may be as-sumed in analogy to hexane and decane soot because the used toluene soot was generated under very similar experimental, that is rich combustion conditions (Stadler, 2000; Stadler and Rossi, 2000). Using ρ=1.8 g/cm3 as the true density of soot the number of C atoms per cm2 forming a formal monolayer, NC, may be estimated as
10
NC=(((1.8/12)×6.023×1023)2)1/3=2.0×1015C atoms/cm2 for a monolayer. At an esti-mated BET surface area of 100 m2/g or 1000 cm2/mg the absolute number of sites NO3(aerosol)/Maerosol obtained from experiment SOOT1 of 2.0×10¹⁷ sites/mg leads to NO3(aerosol)/S=2×1014sites cm−2 of toluene soot that strongly interact with O3. Con-sidering the fact that the estimated BET surface most likely represents an upper limit,
15
NO3(aerosol)/S approximately corresponds to 10% or more of a molecular monolayer of carbon atoms on soot. This seems to be a surprisingly large number of reducing sites for a combustion aerosol. Experiment SOOT2 displayed in Table 1 also reveals that there are approximately NNO2(aerosol)/S=1% of all surface sites on toluene soot that are able to reduce NO2, a number ten times smaller than for O3which is a stronger
20
oxidizer than NO2. The observed reaction product of the NO2/soot aerosol interaction is HONO in agreement with results obtained on soot from a rich combustion mixture as reported by Stadler (2000) and Stadler and Rossi (2000). In anticipation of the results to be discussed below, we neither observed uptake of NO2nor formation of HONO by limonene and toluene SOA. We may therefore conclude that SOA particles are most
25
probably not responsible for the formation of HONO in the troposphere (Demirdjian and Rossi, 2002). These results are in agreement with those of Br ¨oske et al. (2003).
ACPD
5, 607–654, 2005
A new experimental technique for determining the SOA
surface properties B. Demirdjian and M. J. Rossi Title Page Abstract Introduction Conclusions References Tables Figures J I J I Back Close
Full Screen / Esc
Print Version Interactive Discussion
4.5. Evaluation of surface densities of functional groups Ni(aerosol)/S for limonene and toluene aerosols
Considering that SOA had been generated under oxidizing conditions in the presence of O3at residence times of 1 to 2 min (Figs. A1 and A2) it is not surprising that no net uptake of both O3and NO2could be observed on SOA generated both from limonene
5
and toluene in contrast to toluene soot aerosol. Before evaluating the numbers of basic and carbonyl-containing sites for limonene and toluene SOA per cm−2, Ni(aerosol)/S, we have to obtain an estimate of the total surface area per mass of SOA, S/MSOA, in order to be able to compare the results on SOA with toluene soot.
All titration experiments have been performed on SOA that was generated either
10
from the limonene/O3reaction or toluene/O3photooxidation at a gas phase residence time τ=2 min and rh=90% which was generally used as displayed in Figs. A1 and A2b and led to the aerosol parameters displayed in Tables A1 and A2. For limonene and toluene SOA Figs. A1 and A2b display the most probable mobility diameters of d=182 and 250 nm, respectively, at the peak of the PDF. For the sake of simplicity we
15
calculate an effective aerosol diameter def f for the PDF displayed in Figs. A1 and A2b that results in the measured cumulative particle number concentration of 4.5×10⁶and 1.1×10⁶particle cm−3 and the corresponding volume concentration of 1.1×10¹⁴ and 6.7×10¹³nm3/cm3 for limonene and toluene SOA, respectively, based on the mobility diameter (Tables A1 and A2). In this way we replace the PDF by one number, namely
20
the effective mobility diameter that defines a monodisperse aerosol with def f equal to 360 and 488 nm for limonene and toluene SOA, respectively. This will be used from now on in the discussion compared to the most probable aerosol diameter of 182 and 250 nm, respectively, taken from the peak of the PDF (Figs. A1 and A2b). This simplifying assumption avoids the integration procedure that takes into account the
25
detailed form of the PDF.
We are now evaluating the surface area of the SOA per unit mass, S/MSOA, in or-der to normalize the absolute number of surface sites Ni(aerosol) obtained by
titra-ACPD
5, 607–654, 2005
A new experimental technique for determining the SOA
surface properties B. Demirdjian and M. J. Rossi Title Page Abstract Introduction Conclusions References Tables Figures J I J I Back Close
Full Screen / Esc
Print Version Interactive Discussion
tion. Assuming a density of 1 g/cm3 as is customary for SOA generated from hy-drocarbon oxidation (Rohr et al., 2003; Edney et al., 2000; Br ¨oske et al., 2003) for limonene and toluene SOA the mass and external surface area of a single SOA particle is 2.4×10⁻¹⁴ and 6.1×10⁻¹⁴g/particle and 4.1×10⁻⁹ and 7.5×10⁻⁹cm2/particle using 360 and 488 nm as effective diameters for limonene and toluene SOA, respectively.
5
Therefore, there are 10−3/2.4×10−14=4.2×1010 limonene SOA particles in 1 mg which leads to a surface area S/MSOA of 171 cm2per mg of limonene SOA for def f=360 nm. The corresponding values for toluene SOA are 1.64×10¹⁰ particles per mg of SOA of unity density leading to S/MSOA=123 cm2per mg of toluene SOA for def f=488 nm. Ta-ble 2 displays numerical values of Ni(aerosol)/S for all three types of aerosols studied.
10
In order to facilitate the comparison between different values of Ni(aerosol) we are expressing it on a relative scale by choosing as a benchmark the number of molecules or atoms (in the case of soot as discussed above) making up a for-mal molecular monolayer. This was estimated by assuming that the limonene and toluene SOA consisted of a pure liquid droplet of density ρ=0.841 and 0.867 g/cm3
15
for limonene and toluene, respectively (Weast, 1989). Similar to the estimation of the number NCof C atoms on toluene soot presented above we obtain Nl i m=2.4×10¹⁴and NT ol=3.2×10¹⁴molecules cm−2for a formal monolayer of limonene and toluene on the pure liquid. Table 2 displays typical values of fractional monolayers of functional groups probed by the used gas phase molecules on the third line of each entry in per cent of
20
a formal monolayer of the SOA precursor.
The results displayed in Table 2 enable a quantitative comparison of the fractional coverage of a narrow selection of functional groups on different SOA’s as well as on toluene soot. Oxidation of the hydrocarbon SOA precursors limonene and toluene as well as combustion of toluene in a diffusion flame afford the generation of many
25
acidic compounds including mono- and dicarboxylic compounds (Larsen et al., 2001; Liu et al., 2004). Table 2 reveals that 5.0 and 3.4% of the surface of SOA based on a formal monolayer of its precursor hydrocarbon contain acidic functional groups when the surface is approximated by a pure liquid droplet of the hydrocarbon. The present
ACPD
5, 607–654, 2005
A new experimental technique for determining the SOA
surface properties B. Demirdjian and M. J. Rossi Title Page Abstract Introduction Conclusions References Tables Figures J I J I Back Close
Full Screen / Esc
Print Version Interactive Discussion
technique addresses the surface composition as “seen” from the gas phase and does not allow a conclusion as to the bulk volume concentration of the oxidation products. Trimethylamine is a strong base that should interact even with weakly acidic sites at the SOA interface. However, we can by no means be sure that this number corre-sponds to a limiting value of acidic sites on the surface of toluene SOA. Toluene soot
5
has a relative surface coverage of 0.2% regarding surface acidity which is significantly lower than for SOA. However, the normalizing factor NC (see footnote c in Table 2) is roughly a factor of ten higher than Nl i m or Ntol which will lead to lower relative sur-face coverages. Even so, if one would compare NNMe3(aerosol)/S for toluene soot with Ntol the resulting surface coverage of 1.25% would still be significantly smaller than for
10
limonene and toluene SOA. Although the absolute number of acidic surface sites per mass on soot is larger by a factor of three or so (Table 2) the surface density is smaller by a factor of three compared to SOA because of the large value of the BET surface of soot compared to SOA which does not have a fractal surface like soot.
Titration with NH2OH indicates that SOA particles contain carbonyl groups that may
15
interact with the gas phase. It is well known that SOA contains a plethora of par-tially oxygenated hydrocarbons, many of which contain carbonyl groups (Larsen et al., 2001). In agreement with this fact our results show a significantly larger surface cov-erage of carbonyl groups that interact with the gas phase probe NH2OH compared to acidic functional groups. Perhaps surprisingly, the value for limonene SOA is a factor of
20
32 larger than the number of molecules corresponding to a molecular monolayer. This means that some diffusional exchange between the bulk and the surface of a limonene SOA droplet must occur on the time scale of the titration experiment which is in the range of tens of minutes. Some exchange for toluene SOA cannot be excluded either, despite the fact that the surface coverage is less than 100%. Most importantly, the
25
initial rate constant kuni for uptake of NH2OH corresponds to a γ value far from unity which means that the exchange must occur on a time scale significantly longer than 30 s corresponding to kesc=0.031 s−1. What is important in the present context is that carbonyl groups are apparently available to a large extent for gas phase interaction,
ACPD
5, 607–654, 2005
A new experimental technique for determining the SOA
surface properties B. Demirdjian and M. J. Rossi Title Page Abstract Introduction Conclusions References Tables Figures J I J I Back Close
Full Screen / Esc
Print Version Interactive Discussion
the slow diffusional exchange between bulk and surface notwithstanding. However, the chosen probe NH2OH is most likely unable to differentiate between carbonyl groups originating from such disparate molecules as aldehydes, ketones, carbonic acids, es-ters, anhydrides, amides and others. In contrast, the uptake of NH2OH by soot parti-cles is negligible which is somewhat of a surprise. However, this result may perhaps
5
be an artifact in that the functional groups carrying the surface acidity of soot that is necessary for the oxime formation to occur through general acid catalysis may not be mobile on the soot surface and therefore unable to move, whereas in the presumably liquid limonene and toluene SOA the surface acidity may move to a reaction center where oxime formation with NH2OH occurs. As discussed above no oxime formation
10
occurs on a thin film of xanthone in the absence of an acid, in agreement with this pro-posal. The results for toluene soot with respect to the fractional coverage of reducing or oxidizable sites depends on the strength of the oxidizing power of the probe as has been pointed out above. It seems to be highly variable, at least within a factor of ten, and additional examples will enable the characterization of the soot surface in terms of
15
chemical reactivity in the future.
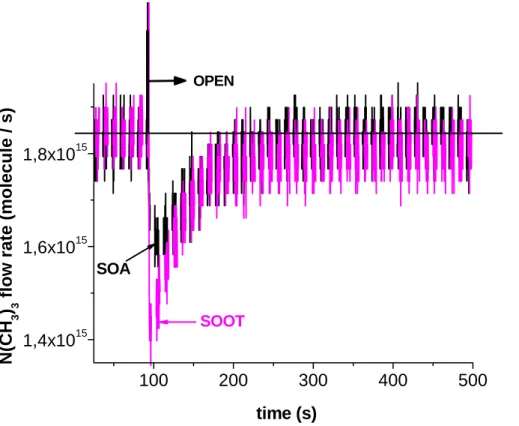
A close look at typical titration experiments for N(CH3)3in contrast to NH2OH probes displayed in Figs. 6 and 7, respectively, reveals that titration is complete for N(CH3)3on toluene SOA and soot aerosol (Fig. 6) as well as for NH2OH interacting with toluene SOA, in contrast to limonene SOA (Fig. 7). In the former case displayed in Fig. 7 the
20
NH2OH MS signal at m/e 33 returns to the original MS signal well before the end of the titration reaction at t=530 s (Fig. 7a), whereas it has not yet returned to the original level at t=1350 s for the interaction pair NH2OH/limonene SOA (Fig. 7b) when the plunger was lowered and exposure of the supported aerosol came to a halt. This may indicate continuing exchange between NH2OH and the target carbonyl groups that would take
25
place beyond the actual reaction period which is the reason that only a lower limit for NNH2OH(aerosol) may be given at this time (Table 2). In any case, continuing di ffu-sion of carbonyl groups from the bulk towards the aerosol particle surface or diffusion of NH2OH into the bulk of the aerosol volume may not be excluded for the case of
ACPD
5, 607–654, 2005
A new experimental technique for determining the SOA
surface properties B. Demirdjian and M. J. Rossi Title Page Abstract Introduction Conclusions References Tables Figures J I J I Back Close
Full Screen / Esc
Print Version Interactive Discussion
limonene SOA because of the persistence of the titration reaction and our inability to saturate the probe/aerosol reaction system beyond the scheduled end of reaction at t=1350 s (Fig. 7b). The small but measurable continuing reaction rate designates the rate-limiting step which very likely is linked to a diffusional process.
Volatile reaction products resulting from the interaction of surface probes have only
5
been detected for soot aerosol. The identity of the products listed in Table 4, HONO (m/e 47) and O2 (m/e 32) has been established using mass spectrometry and is in agreement with previous results (Stadler and Rossi, 2000; Br ¨oske et al., 2003). The salt and oxime reaction products, although not directly observable, are expected to be present at the SOA interface after reaction with (CH3)3N and NH2OH, respectively.
10
Water vapor as a product of reaction (4) was not observable either because the H2O content of SOA was high according to the MS signal at m/e 18 thus preventing the observation of small additional amounts of H2O. It is useful to remember that the for-mation of SOA examined in the present work generally occurred at elevated relative humidities of RH≥90% in all our experiments.
15
4.6. Uncertainties
In order to examine the overall uncertainty in the primary parameter of interest, namely Ni(aerosol)/S displayed in Table 2 we will first evaluate the limits of uncertainty in Ni(aerosol) whose absolute value is measured by titration using a specific probe molecule. Figure 6 shows that titration of the acidic surface functional groups using
20
N(CH3)3 goes to completion both for toluene soot and SOA in that the MS signal reaches the initial signal level after 150 s. This leads to approximately a 5% uncer-tainty in NN(CH3)3(aerosol). On the other extreme corresponding to the most unfa-vorable case, the titration experiments involving NH2OH probing the aerosol carbonyl groups of limonene SOA displayed in Fig. 7b show a continuing titration reaction even
25
beyond a duration of 1250 s, which is the time at which the aerosol sample had been isolated from NH2OH by lowering the plunger and thus sealing the sample compart-ment. Judging from the slope of the time-dependent MS signal at m/e 33 we believe
ACPD
5, 607–654, 2005
A new experimental technique for determining the SOA
surface properties B. Demirdjian and M. J. Rossi Title Page Abstract Introduction Conclusions References Tables Figures J I J I Back Close
Full Screen / Esc
Print Version Interactive Discussion
that we underestimate NNH2OH(aerosol) by 20%. The case of the O3-titration of oxidiz-able (reducing) surface functionalities of toluene soot displayed in Fig. 4 should lead to a similar uncertainty of NO3(aerosol) of 20%, quite like the case of the NH2OH probing the SOA of limonene. Figure 4 shows a significant continuing uptake of O3even after 1500 s of titration which indicates that complete saturation of soot by O3 has not yet
5
occurred. As a result Ni(aerosol) is probably underestimated up to 20% in this case as well.
The uncertainty in S is primarily given by the stability of the PDF of the suspended aerosol that is strongly affected by the duration of the limonene and toluene SOA col-lection on the Teflon filter. A typical uncertainty is estimated at 5 to 20% for a colcol-lection
10
time of 30 to 120 min, respectively. In conclusion, for both limonene and toluene SOA the combined uncertainty of Ni(aerosol)/S may reach values up to 40%. An exception seems to be toluene combustion aerosol where the upper limiting BET surface area has been estimated at 100 m2/g in this work. Stadler and Rossi have measured a BET surface area of 70 m2/g for decane soot generated under similar rich flame conditions
15
(2000b). If we assign an uncertainty of ±30% in the BET surface area of toluene soot we arrive at an overall uncertainty of up to 50% for Ni(soot)/S, a value slightly higher than that for the SOA samples. In conclusion, only additional future work may teach us about realistic uncertainty limits for these experiments because the present levels have been obtained on the basis of a limited number of titration experiments.
20
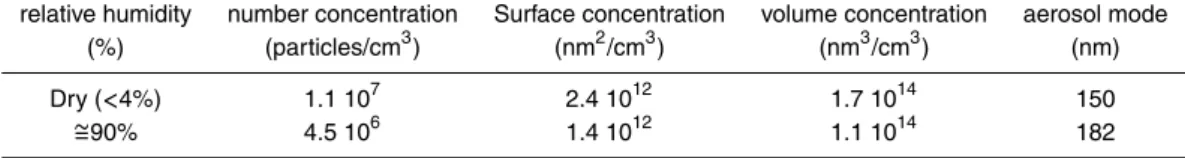
Appendix A: Particle Distribution Function (PDF) of limonene, toluene SOA and toluene soot
Particle size spectra of the aerosol generated from the reaction of 1000 ppm of limonene in the presence of 100 ppm of O3 at 90% rh at 1 atmosphere of air are dis-played in Fig. A1 at 10 min and 1 h after aerosol particle formation at a gas phase
res-25
idence time of τ=2 min. The mode at 182 nm is essentially invariant with time despite some minor changes in the particle size distribution in the nucleation mode at aerosol
ACPD
5, 607–654, 2005
A new experimental technique for determining the SOA
surface properties B. Demirdjian and M. J. Rossi Title Page Abstract Introduction Conclusions References Tables Figures J I J I Back Close
Full Screen / Esc
Print Version Interactive Discussion
mobility diameters smaller than 40 nm. Table A1 displays the characteristic number, surface and volume concentrations at the two extreme values of rh used, namely dry (<4% rh) vs. humid (90% rh). It may be concluded that the number, surface and vol-ume concentration of limonene aerosol decreases by a factor of roughly 2.5, 1.7 and 1.6, respectively, with increasing rh in contrast to the situation for toluene as discussed
5
below.
Figure A2 displays aerosol particle size distributions of the photochemical produc-tion of SOA from toluene using a Hg/Xe arc lamp that indicate a dependence on the molecular gas residence time τ in the aerosol flow reactor. At τ=1 min (Fig. A2a) the size distribution exhibits two modes, located at 60 and 180 nm, whereas it consists of a
10
single peak centered at 230±20 nm for τ=2 min (Fig. A2b). Obviously, the SOA concen-tration in the photochemical reactor is sufficiently large to support particle coagulation processes towards larger mean aerosol particle mobility diameters on an increasing time scale from 1 to 2 min all the while new gas-to-particle formation processes are taking place simultaneously. In addition, our results also point towards satisfactory
15
stability of the particle size distribution over a typical duration of particle collection on the Teflon membrane filter on the order of an hour or so. These constant experimen-tal conditions throughout the aerosol collection time are necessary in order to enable straightforward interpretation of the properties of a collected macroscopic aerosol filter sample of limonene and toluene SOA.
20
The particle number concentration for toluene SOA is smaller by roughly a factor of six in going from τ=1 to 2 min as shown in Table A2. The surface concentration (nm2/cm3) is reduced by approximately a factor of two, whereas the volume concentra-tion (nm3/cm3) is smaller by 30%. The temporal evolution of the metrology of limonene and toluene SOA as displayed in Tables A1 and A2 results in an increase of the mobility
25
diameter accompanied by a decrease of the cumulative number, surface and volume concentrations. This is consistent with continuing oxidation or aging processes during the formation of SOA in the presence of oxidants such as OH, O3 and NO3 together with on-going adsorptive growth as well as gas-to-particle conversion processes all
ACPD
5, 607–654, 2005
A new experimental technique for determining the SOA
surface properties B. Demirdjian and M. J. Rossi Title Page Abstract Introduction Conclusions References Tables Figures J I J I Back Close
Full Screen / Esc
Print Version Interactive Discussion
occurring at the same time.
Experiments on toluene/O3photooxidation performed under dry conditions, typically at a relative humidity rh of <4%, showed that the number concentration of particles is reduced by more than a factor of ten (11.3 in Fig. A2c) in contrast to limonene/O3 SOA that showed a modest increase with increasing rh as discussed above. The
5
result for toluene qualitatively confirms that H2O vapor plays an important role in SOA formation from toluene/O3 owing to photooxidation processes supported by OH free radical. Some of the important reactions are the following:
O3+ hν → O2+ O(1D) (A1)
O(1D)+ H2O → 2OH (A2)
10
OH+ toluene → H2O+ C7H7(benzyl radical• from H abstraction) (A3)
OH+ toluene → C7H8OH(OH addition product•) (A4)
Subsequently, the benzyl radicals and/or the OH-addition product to toluene are ox-idized further (Atkinson and Arey, 2003). Equations (A1) to (A4) just represent the initiation reactions of toluene photooxidation that are thought to be rate limiting at the
15
very beginning of the SOA formation process.
The role of H2O vapor in SOA formation has been investigated thoroughly in recent years using chamber as well as flowing gas experiments (Seinfeld et al., 2001; Edney et al., 2000). The difficulty with these experiments is the fact that one is unable to sep-arate the effect of H2O vapor on the SOA formation, that is gas-to-particle conversion
20
processes, from the following adsorptive growth of aerosol particles by adsorption of both organic and H2O vapor, notwithstanding the effect of inorganic aerosol compo-nents that are not considered here. Despite the complexity of the systems at hand Seinfeld reached the conclusion (Seinfeld et al., 2001) that increasing rh caused mod-est, albeit monotonic, increases of both the amount of condensed organic mass as well
25


![Figure 7 Absolute uptake rates of NH 2 OH monitored at m/e 33 on SOA generated from limonene (lower trace, blue) and toluene (upper trace, black)at τ = 2 min, [hydrocarbon] ≅ 1000](https://thumb-eu.123doks.com/thumbv2/123doknet/14799799.605635/46.918.147.565.43.523/figure-absolute-uptake-monitored-generated-limonene-toluene-hydrocarbon.webp)