HAL Id: hal-00299490
https://hal.archives-ouvertes.fr/hal-00299490
Submitted on 21 Feb 2008
HAL is a multi-disciplinary open access
archive for the deposit and dissemination of
sci-entific research documents, whether they are
pub-lished or not. The documents may come from
teaching and research institutions in France or
abroad, or from public or private research centers.
L’archive ouverte pluridisciplinaire HAL, est
destinée au dépôt et à la diffusion de documents
scientifiques de niveau recherche, publiés ou non,
émanant des établissements d’enseignement et de
recherche français ou étrangers, des laboratoires
publics ou privés.
around Turkey based on instrumental data: Gumbel
first asymptotic distribution and Gutenberg-Richter
cumulative frequency law
Y. Bayrak, S. Öztürk, G. Ch. Koravos, G. A. Leventakis, T. M. Tsapanos
To cite this version:
Y. Bayrak, S. Öztürk, G. Ch. Koravos, G. A. Leventakis, T. M. Tsapanos. Seismicity assessment
for the different regions in and around Turkey based on instrumental data: Gumbel first asymptotic
distribution and Gutenberg-Richter cumulative frequency law. Natural Hazards and Earth System
Science, Copernicus Publications on behalf of the European Geosciences Union, 2008, 8 (1),
pp.109-122. �hal-00299490�
www.nat-hazards-earth-syst-sci.net/8/109/2008/ © Author(s) 2008. This work is distributed under the Creative Commons Attribution 3.0 License.
and Earth
System Sciences
Seismicity assessment for the different regions in and around Turkey
based on instrumental data: Gumbel first asymptotic distribution
and Gutenberg-Richter cumulative frequency law
Y. Bayrak1, S. ¨Ozt ¨urk1, G. Ch. Koravos2, G. A. Leventakis2, and T. M. Tsapanos2
1Karadeniz Technical University, Department of Geophysics, 61080 Trabzon, Turkey
2Aristotle University of Thessaloniki, School of Geology, Geophysical Laboratory, 54124, Thessaloniki, Greece
Received: 20 September 2007 – Revised: 20 December 2007 – Accepted: 18 January 2008 – Published: 21 February 2008
Abstract. The evaluation of the seismicity in 24 seismic re-gions, in which Turkey and adjacent areas divided, is car-ried out. For this purpose two methods are adopted. The first is the “whole process” which follows the Gutenberg and Richter distribution frequency-magnitude law, while the sec-ond one is the “part process” which is well known as the the-ory of extreme values. This thethe-ory was developed by Gum-bel in order to solve many geophysical problems. The first asymptotic distribution of extremes was used in the present study. The advantage of the method is that it does not re-quired analysis of the whole data set. It uses, instead, the sequence of earthquakes with the largest magnitudes in a set of predetermined equal-time intervals. The parameters a and b were estimated from both methods. For the goodness of fit, to the Gutenberg-Richter frequency-magnitude law, the max-imum likelihood approach is applied. The b-values calcu-lated from Gutenberg and Richter frequency-magnitude law, reveal a better fit to the tectonic environment of the 24 seis-mic regions of Turkey and its surroundings examining in this study. On the other hand b-values evaluated from Gumbel’s first distribution, do not adjust to the particular tectonics of
the 24 seismic regions. The modal value a1/b adopted from
Gutenberg-Richter for the 24 seismic regions were calcu-lated, as well.
An effort made to correlate the tectonics of the area with the spatial distribution of the various computed seismic pa-rameter, while maps were produced for this purpose. These maps provide a detail image of seismicity and local tecton-ics for the whole investigated area. The results showed that the Aegean arc and the North Anatolian fault zone ranked among to the first positions between the 24 seismic regions researched.
Correspondence to: Y. Bayrak
1 Introduction
Many quantitative methods have been applied over the years to estimate seismicity in various regions of the world. The most popular methods used are the Gutenberg-Richter law and the Gumbel’s asymptotic distributions. The latter has
many advantages. One of them is that it takes into
ac-count only the largest magnitude from a predetermined set of equal-time. These arbitrary time intervals are usually de-termined by the rate of seismicity in the area under inves-tigation. The time interval is some times selected to auto-matically exclude foreshocks and aftershocks (Yegulalp and Kuo, 1974). There were different opinions on the use of Gumbel’s method for the seismicity evaluation. Kaila and Narain (1971) suggested that because the Gumbel’s process used great earthquakes during pre-determined periods it is therefore not an ideal criterion for seismicity of seismic haz-ard assessment. On the other hand, Bath (1973, 1975, 1983) declared that the dependency of the process (Gumbel) on the occurrence of great earthquakes is the principal advan-tage of the method, since the magnitude of the great shocks are more accurately determined historically than those of the small ones.
Turkey is a country of high seismicity with a complicated tectonic regime. Tsapanos and Burton (1991) ranked Turkey in the tenth position between 50 seismically active countries of the world, in respect of its seismicity using for this pur-pose the Gumbel’s extreme theory. The parameter used is the magnitude of the earthquake which is most likely to be largest during 85 years. For Turkey, this magnitude is 7.7 and is in the same position with Colombia, Honduras, Panama and Iran.
A large number of studies on a and b parameters have been presented since Gutenberg and Richter introduced their law about the earthquake magnitudes distribution. The ac-curate estimation of these parameters is of primary impor-tance because the evaluations of the seismicity depend on
Fig. 1. Tectonic map of Turkey. The major tectonic structures are modified from Şaroğlu et al. (1992)
Fig. 1. Tectonic map of Turkey. The major tectonic structures are modified from S¸aroˇgu et al. (1992).
them. The parameter b is one of the most known and used for various purposes or comparison reasons. The literature has a lot of such publications. The b parameter is consid-ered to be closely related to tectonic characteristics of a re-gion (Hatzidimitriou et al., 1985; Wang, 1988; Tsapanos, 1990). It seems to be in close connection with the geolog-ical age of an area (Allen et al., 1965). Tsapanos (1990) found significantly different b-values in east and west Pacific and suggested that this is related to the difference in the me-chanical structure of the material in each area, as well as to their tectonic evolution. Manakou and Tsapanos (2000) sug-gested that low b-values are related to low degree of hetero-geneity, large strain rate, large velocity of deformation and therefore large fault. On the other hand there are evidences (Yılmazt¨urk et al., 1999; Bayrak et al., 2002) that a and b-values do not always supply much information about the
tec-tonics of an area. They suggested that the ratio am/b (modal
value) is much better for understanding the seismicity and the tectonic regime of a region.
The paper confines itself to the estimation of seismicity
parameters a, b, as well as the modal values a1/b values in 24
seismic regions in Turkey and the adjacent areas and to find out which of them has better correlation with the complicated tectonics of the examined area.
2 Tectonic settings and data
Turkey is one of the most seismically active regions in the world and lies within the Mediterranean part of Alpine-Himalayan orogenic system. This system runs through a mean west-east direction from the Mediterranean to Asia. The compressional motion between Europe and Africa
pro-duced the Alpine orogeny, whereas the Himalayan orogeny has resulted from the India-Asia collision. African, Eurasian, and Arabian plates are three major plates surround Turkey, and two generally acknowledged minor plates are Aegean and Anatolian, as shown in the neo-tectonic models of McKenzie (1972) and Dewey et al. (1973).
The most important tectonic environments in Turkey are the Aegean Arc, the West Anatolian Graben Complexes (WAGC), the North Anatolian Fault Zone (NAFZ), the East Anatolian Fault Zone (EAFZ), the North East Anatolian Fault Zone (NEAFZ) the Bitlis Thrust Zone (BTZ) and the Caucasus. The motion between Africa and Eurasia is not taken up one plate boundary, but is carried by the motion of the Aegean and Turkish plates. The Aegean arc system plays an important role in the geodynamical evolution of the Aegean region. Convergence between the African and Ana-tolian plates in the Eastern Mediterranean takes place by sub-duction along the Aegean and Cyprus arcs (e.g. McKenzie, 1978; Papazachos and Comninakis, 1971). The African Plate is descending beneath the Anatolian Plate in the N-NE di-rection. NAFZ is one of the best known strike-slip faults in the world because of its remarkable seismic activity, ex-tremely well developed surface expression and importance for the tectonics of eastern Mediterranean region (S¸eng¨or et al., 1985). EAFZ was first described by Allen (1969) and this fault zone is a transform fault forming parts of boundaries between the Anatolian and the Eurasian plates, as well as be-tween the Arabian and African plates. It is considered as a conjugate structure to the NAFZ. The Bitlis Thrust Zone is a complex continent-continent and continent-ocean collisional boundary that lies north of fold-and-thrust belt of the Arabian platform and extends from southeastern Turkey to the Za-gros Mountains in Iran (e.g. S¸eng¨or, 1979; Hempton, 1985).
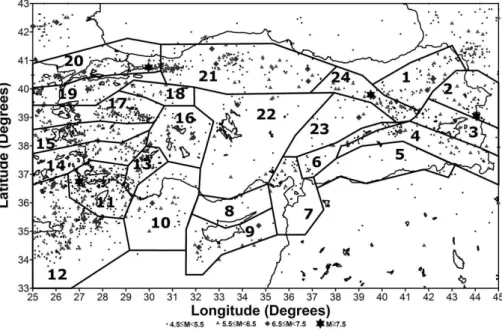
Fig. 2. Different seismic source zones (Bayrak et al., 2007) and epicenter locations of earthquakes in Turkey from 1900 to 2005 with major tectonic features. Magnitude size
of earthquakes are shown by different symbol
Fig. 2. Different seismic source zones (Bayrak et al., 20081) and epicenter locations of earthquakes in Turkey from 1900 to 2005 with major tectonic features. Magnitude size of earthquakes are shown by different symbol.
At the eastern end of the Turkish plate, the motion is taken up by thrust faults associated with the Caucasus. The result of this geometry is a thickening of the continent throughout the active region, which continues to elevate the Caucasus. Thrusting in eastern Turkey and the Caucasus transforms to strike-slip motion between the Turkish and Eurasian plates at the eastern outset of the NAF (Erdik et al., 1999). Figure 1 shows the major tectonic structures of Turkey modified from S¸aroˇgu et al. (1992).
It is necessary a complete comprehension of the historical and instrumental seismicity, tectonics, geology, paleoseis-mology, and other neotectonic properties of the considering region for an ideal delineation of seismic source zones. But, it is not always possible to compile detailed information in all these fields for the majority of the world. Thus, frequently, seismic source zones are determined with two fundamental tools; a seismicity profile and the tectonic structure of the re-gion under consideration (Erdik et al., 1999). It is suggested by several authors that seismic source zonation is a widely used methodology to determine the earthquake hazard and numerous studies performed. The seismic source zones used
in this study are defined according as Bayrak et al. (2008)1as
shown in Fig. 2. Also, epicentral distributions of the earth-quakes in and around Turkey are shown in the same figure (Fig. 2). The seismic source regions numbered from 1 to 24 and some other parameters that concern these regions for the seismicity analysis are given in Table 1.
1Bayrak, Y., ¨Ozt¨urk, S., Tsapanos, T. M., Koravos, G. Ch.,
Lev-entakis, G.-A., and Kalafat, D.: Estimation of the earthquake hazard parameters from instrumental data for the different regions in and around Turkey, J. Geophys. Res., submitted, 2008.
The database we analyzed in this work is compiled from different sources and the seismicity data from different cata-logues such as TURKNET, International Seismological Cen-tre (ISC), Incorporated Research Institutions for Seismol-ogy (IRIS) and The Scientific and Technological Research Council of Turkey (TUBITAK) were provided in different magnitude scales. The catalogues contain the origin time,
different magnitudes scales (mb-body wave magnitude, MS
-surface wave magnitude, ML-local magnitude, MD-duration
magnitude, and MW -moment magnitude), epicenters and
depths information of earthquakes. Turkey earthquake cat-alogue, taken from the Boˇgazic¸i University, Kandilli Obser-vatory and Earthquake Research Institute (KOERI), starting from 1974 until 2005, contains 68 478 events. The earth-quakes from 1900 to 1974, which come from the Inter-national Seismological Centre (ISC) and instrumental cata-logue of KOERI, consist of 2398 events. The catacata-logue was finally checked for duplicate events. The final data catalogue consists of 70 876 earthquakes with magnitude 1.0 or greater. We carried out our analysis in a rectangular area limited by
the co-ordinates 25◦E and 45◦E in longitude and by the
co-ordinates 33◦N and 43◦N in latitude. In order to produce a
homogeneous catalogue, relations derived between different
types of magnitudes (Bayrak et al., 20081). The magnitudes
in the final catalogue are MS-surface wave magnitude. The
time interval considered for the present work ranged between 1900 and 2005. The study is restricted only in shallow earth-quakes (depth<60 km) and is consisted of 69 339 events.
Instrumental period in which earthquakes were being recorded with a few seismic stations has started at the begin-ning of 1900 in Turkey. In other words this period constitutes
Table 1. Different 24 seismic regions in and around Turkey, the time period, duration, extreme years (k) and % missing years, observed
maximum earthquake size and cut off magnitudes for each region.
Region Period Cut Off Extreme % Missing Cut Off Mmaxobs Tectonics Magnitude Years Years Magnitude (Observed Maximum
for Gumbel (k) for G-R Magnitude)
1 1903–2005 4.4 3 17.14 3.6 6.8 North East Anatolian Fault Zone (NEAFZ)
2 1910–2005 3.8 2 25.00 4.0 7.5 Kaˇgızman, Iˇgdır, Tutak and C¸ aldıran faults (KITC¸ F) 3 1903–2004 4.4 8 0.00 3.6 6.3 Malazgirt, Erc¸is¸ and
S¨uphan faults and Mus¸ Thrust Zone (MESF) 4 1903–2005 4.4 3 20.00 1.1 6.6 Bitlis Thrust Zone (BTZ) 5 1915–2002 4.3 10 11.11 4.1 5.4 Karadaˇg Extension Zone
(KEZ)
6 1908–2005 4.7 7 21.43 1.2 5.9 East Anatolian Fault Zone (EAFZ)
7 1906–2005 4.6 11 0.00 2.0 6.0 A part of Dead Sea Fault 8 1924–1995 3.4 10 0.00 3.3 5.2 North part of Cyprus 9 1918–2005 4.9 7 0.00 3.1 6.7 South part of Cyprus,
in-cluding east part of Cyprus Arc
10 1903–2005 4.4 8 15.4 2.6 6.8 Western part of Cyprus Arc 11 1917–2005 4.1 1 20.22 3.5 7.7 Muˇgla and Rhodes 12 1910–2005 4.6 1 9.38 4.0 7.4 Aegean Arc
13 1925–2005 4.2 6 21.43 2.3 6.4 Burdur Fault Zone (BFZ) 14 1900–2005 4.2 2 11.32 3.0 6.8 B¨uy¨uk and K¨uc¸¨uk
Menderes Grabens 15 1904–2005 4.6 5 0.00 3.0 6.6 Gediz Graben
16 1914–2005 4.7 7 7.14 2.1 7.0 Sultandaˇgı, Beys¸ehir and Tatar faults (SBTF) 17 1903–2005 4.4 2 21.15 2.1 7.2 K¨utahya, Simav and
Zeytindaˇg-Bergama faults (KSZBF)
18 1901–1995 4.3 8 25.00 3.8 6.4 Eskisehir, In¨on¨u-Dodurga and Kaymaz faults (EI-DKF)
19 1905–2005 4.1 2 21.57 2.0 7.2 Yenice-G¨onen, Manyas, Ulubat and Etili faults (YGMUEF)
20 1907–2005 4.1 3 12.12 2.2 7.8 Marmara part of North Anatolian Fault Zone (MNAFZ)
21 1905–2005 5.0 10 0.00 2.2 7.4 Anatolian part of North Anatolian Fault Zone (ANAFZ)
22 1903–2005 4.1 2 25.00 3.6 6.6 Mid Anatolian Fault Sys-tem (MAFS)
23 1905–2005 4.2 6 17.65 3.6 6.8 Ovacık fault and Malatya fault (OMF)
24 1904–2005 4.7 2 25.00 2.2 7.9 Eastern part of North Ana-tolian Fault Zone (ENAFZ)
the first half of the instrumental period. Seismological Ob-servatory of KOERI provides and the real time data with the
modern on-line and dial-up seismic stations in Turkey. The seismological division of the KOERI determines, as rapidly
and accurately as possible, the location and magnitude of all earthquakes. Each station of KOERI is equipped with a high-gain seismometer. Averaged uncertainties in the hypocenter locations of the earthquakes are about 2–3 km. In this study, we did not relocate the hypocenters of events and we used the hypocenter locations of earthquakes provided by KOERI.
There are four earthquakes with magnitude MS≥7.5 as
shown in epicentral distribution of the earthquakes in Fig. 2.
Rhodes earthquake, 1926 with MS=7.7; Erzincan
earth-quake, 1939 with MS=7.9; C¸ aldıran-Muradiye (Van)
earth-quake, 1976 with MS=7.5 and ˙Yzmit earthquake, 1999 with
MS=7.8 are the largest earthquakes in the catalogue.
Erzin-can and ˙Yzmit earthquakes are related to NAFZ but Rhodes
and Van earthquakes are related to Aegean arc and MESF, respectively. Also the other larger earthquakes between 7.0 and 7.5 are observed in the Aegean region and NAFZ. On the other hand, large earthquakes are not observed in BTZ and EAFZ. The smallest earthquakes in the catalogue are
the 1995 Cyprus Region earthquake, MS=5.2 and the 1915
S¸anlıurfa earthquake, MS=5.4 and the number of earthquakes
in these regions is also quite little, smaller than 20 events.
3 Brief descriptions of the methods applied
The distribution of earthquake magnitudes in time and in size is generally processed by two methods: a) using the whole available data and b) using the extreme value magnitude. The latter based on the Theory of Extreme value statistics as de-veloped by Gumbel (1935, 1966) and used in many appli-cation in order to solve scientific, as well as practical prob-lems (e.g. floods). Generally the theory of extremes is formu-lated under the assumptions that: a) the prevailing conditions must be almost the same in future and b) observed largest values are independent of each other. Irrespective of the par-ent distribution, the extreme value distribution must take one of three forms. In the present study we applied the first type asymptotic distribution of extreme values. This type is un-limited in both sides.
According to the theory we can consider the magnitude x of an earthquake as a random variable with CDF (cumulative distribution function) of the form:
F (x) = 1 − e−x x ≥ 0 (1) From the theory of probabilities and according to Gumbel
(1966), it is resulting that the CDF of G(Mj) of the
maxi-mum annual magnitude is of the following form:
G(Mj) = exp(−eMj) Mj ≥ 0 (2) Epstein and Lomnitz (1966) added to the first assumption of Gumbel, a second one which refers that the number of magnitudes in a year is a variable of Poisson distribution with a mean α, and then Eq. (1) becomes:
F (x) = 1 − e−βx x ≥ 0 (3)
where β is a parameter. In this way the CDF of G(Mj) of
the maximum annual magnitude takes of the following form:
G(Mj) = exp(−αe−βMj) Mj ≥ 0 (4)
where G(Mj) is the probability that an earthquake
magni-tude within a year to have a value Mjor lesser than it.
Equa-tion (4) can transform in:
ln[− ln G(Mj)] = ln α − βM (5)
which is of the same form with the equation of Gutenber-Richter (G-R), concerns the distribution of magnitudes. The parameters a and b of G-R related with α and β by:
a = ln α
ln 10and b =
β
ln 10 (6)
If we substitute the products of Eq. (6) in Eq. (5) we have:
log{− ln G(Mj)} = a − bMj (7)
which is the mathematical expression of first type of Gumbel distribution. It is difficult to have 1-year extremes especially in the catalogs of past (e.g. beginning of 20th century). For this reason our data set is divided into a number of k-years
extremes (k=2, 3, 4,. . . years) and this is represented by ak
in Eq. (8). In this case the 1-year extreme, a1(Eq. 8) is
cal-culated from the known relationship:
a1= ak− log k (8) where k≥2.
Let assume that Mj are simply the extreme magnitudes
during n successive years and ranked in order of increasing size. The plotting point probability value of the j-th observa-tion is evaluated through Gringorten’s (1963) equaobserva-tion:
G(Mj) = j − 0.44
n + 0.12 (9)
where j is the rank and n is the number of observations. Equation (9) is the most proper one for the 1-type and 3-type asymptotic distribution of extremes (Burton, 1979).
The commonest description of earthquake occurrence is provided by the Gutenberg-Richter law. The parameters cur-rently used for quantitative evaluation of seismicity are the
well-known ones, amand b, of the magnitude frequency
re-lationship introduced by Gutenberg and Richter (1944):
LogNm= am− bM (10)
where N is the expected number of earthquakes which occur in a region during a given time period in relation to their mag-nitudes, M, where m, is the number of years covered by the data sample The parameter b depends on factors like the me-chanical heterogeneity and the density cracks in the medium and on the state of stress in a region (Mogi, 1967; Scholz,
1968). The parameter amdepends on the seismicity of the
area, on the time interval for which we have reported events and also on the surface area S outlined by the epicenters. For
seismicity study purposes usually amis expressed in 1 year by the equation:
a1= am− Logt (11) where m is the whole time period covered by the data set. Because of Eq. (11), relationship (10) transforms to:
LogN = a1− bM (12)
where M is the magnitude of earthquakes and N is the ex-pected number of earthquakes per year greater than or equal to M.
The most probable maximum magnitude Mt, which occurs
in an area during a time period t, is given by the relation:
Mt =
a b +
log t
b (13)
and for t =1 years this becomes M1=a/b, which is the modal
magnitude, and represents the most probable maximum mag-nitude for 1 year (Curtis, 1973).
4 Results
In order to evaluate the seismicity parameters through Gum-bel’s I-type we have firstly to estimate the time period of available data (earthquakes) in each one of the 24 seismic re-gions. This time period is listed in Table 1. Annual extremes are seen only in few occasions, and generally we have ex-treme intervals of duration of N -years (Burton, 1977) and these intervals referred as “extreme years”. On the other hand (Burton, 1979) suggested that in the case of N -year extremes if the missing entries (years) must be less than or equal to 25% the parameters of Gumbel I or III distribution may be estimated without noticeable loss of accuracy. Then we estimated the extreme years and the percentage (%) of the missing years (≤25%) in order to obtained reliable results, as we aforementioned. The cut-off magnitudes derived from the completeness analysis of the earthquake records of each seismic region is of importance. This was assessed by divid-ing the whole time period of a seismic region into subperiods and observing the rate of change of the cumulative number or reported earthquakes, above a threshold magnitude with time. For some regions, we can see very small magnitudes (e.g. region 4, cut-off 1.2). This of course does not mean that we have data with cut-off ≥1.1 since 1900 when our cata-logue starts. Considering as an example region 4, the com-pleteness is: for time period t≥1908 the cut-off magnitude is
m≥5.5, for t≥1965 m≥5.0, for t≥1975 m≥4.0, for t≥1995 m≥3.0 and for t≥2003 m≥1.1. The cut-off magnitudes are
obtained for both methods. We observed that the cut-offs obtained through each method are different and of course this is due to the difference of the theoretical sense of the two methods (Gumbel and Gutenberg-Richter). The magni-tude threshold in the 24 seismic regions ranged between 3.4 and 5.0 for Gumbel’s distribution, while the minimum cut-off
magnitudes obtained from G-R method ranged between 1.1 and 4.1 (details in Table 1). The time period examined cov-ers all the earthquakes occurred after 1900. Maybe this time
is not adequate to capture Mmax(which might occur during
historical era), but Turkey and adjacent area is an active seis-mically territory and large earthquake occurred form time to
time even in modern times (e.g. 1999, Izmit, MS=7.8). In
Ta-ble 1 we also listed the maximum observed earthquake Mmaxobs
during the covered time period.
Then using the above referred methods, Gumbel I and G-R, the seismicity parameters a and b-values were calculated. Two methods are the commonest: a) the least squares and b) the maximum likelihood. The latter used for the purpose of this study.
The method of maximum likelihood estimates the param-eter b and its 95% confidence limits (Page, 1968). The con-dition that b-value estimates are reliable when the difference between the maximum and the minimum magnitude in the data set is greater than or equal to 1.4 (Papazachos, 1974), was adopted. The b-value from a sample of n earthquakes
with magnitude m ranging from mmaxto mminis given by:
b = log10e " m −mmin− mmaxe −b(mmax−mmin) 1 − e−b(mmax−mmin) #−1 (14) where m is the average magnitude of the sample and
b′=b/log10e. Equation (14) is used when mmaxis finite and
independent of the length of magnitude interval mmax−mmin.
It is also valid for small magnitude intervals and rather small number of events.
Under the assumption of no uncertainty in m, the 95% confidence limits for b-value are computed from the relation (Page, 1968): √ n " 1 b′2 + (mmax− mmin)2
2 − eb′(mmax−mmin)− eb′(mmax−mmin)
#−1/2
"
1
b′+
mmax−mmine−b(mmax−mmin)
1 − e−b′(mmax−mmin) −m
#
=±1.96 (15)
where b′=bln10.
The results of the values a and b (with their standard deviation), estimated through the maximum likelihood ap-proach, are listed in Table 2. The b parameter is considered to be closely related to tectonic characteristics of a region (Hatzidimitriou et al., 1985; Wang, 1988). The b-values ob-tained by G-R application vary between 0.58–1.00. On the other hand b-values calculated through Gumbel distribution ranged between 0.51 and 1.18. There is no a clear correlation between the values evaluated through both methods (Fig. 3). The relation existed is:
bGUMBEL= 0.75bG−R+ 0.14 (16)
In order to clarify that the two groups of b-value (from G-R and Gumbel I) belong to different population the F-test is
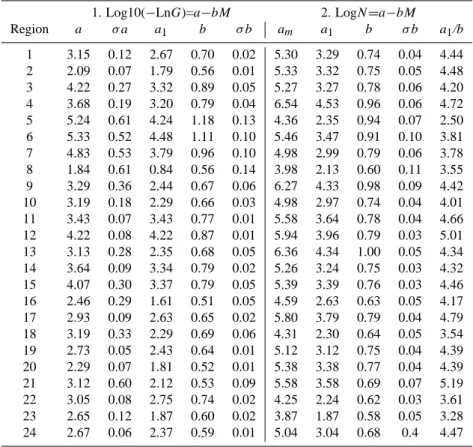
Table 2. The values of seismicity parameters for 24 regions according to Gumbel I (1) and Gutenberg-Richter (2) methods.
1. Log10(−LnG)=a−bM 2. LogN =a−bM Region a σ a a1 b σ b am a1 b σ b a1/b 1 3.15 0.12 2.67 0.70 0.02 5.30 3.29 0.74 0.04 4.44 2 2.09 0.07 1.79 0.56 0.01 5.33 3.32 0.75 0.05 4.48 3 4.22 0.27 3.32 0.89 0.05 5.27 3.27 0.78 0.06 4.20 4 3.68 0.19 3.20 0.79 0.04 6.54 4.53 0.96 0.06 4.72 5 5.24 0.61 4.24 1.18 0.13 4.36 2.35 0.94 0.07 2.50 6 5.33 0.52 4.48 1.11 0.10 5.46 3.47 0.91 0.10 3.81 7 4.83 0.53 3.79 0.96 0.10 4.98 2.99 0.79 0.06 3.78 8 1.84 0.61 0.84 0.56 0.14 3.98 2.13 0.60 0.11 3.55 9 3.29 0.36 2.44 0.67 0.06 6.27 4.33 0.98 0.09 4.42 10 3.19 0.18 2.29 0.66 0.03 4.98 2.97 0.74 0.04 4.01 11 3.43 0.07 3.43 0.77 0.01 5.58 3.64 0.78 0.04 4.66 12 4.22 0.08 4.22 0.87 0.01 5.94 3.96 0.79 0.03 5.01 13 3.13 0.28 2.35 0.68 0.05 6.36 4.34 1.00 0.05 4.34 14 3.64 0.09 3.34 0.79 0.02 5.26 3.24 0.75 0.03 4.32 15 4.07 0.30 3.37 0.79 0.05 5.39 3.39 0.76 0.03 4.46 16 2.46 0.29 1.61 0.51 0.05 4.59 2.63 0.63 0.05 4.17 17 2.93 0.09 2.63 0.65 0.02 5.80 3.79 0.79 0.04 4.79 18 3.19 0.33 2.29 0.69 0.06 4.31 2.30 0.64 0.05 3.54 19 2.73 0.05 2.43 0.64 0.01 5.12 3.12 0.75 0.04 4.39 20 2.29 0.07 1.81 0.52 0.01 5.38 3.38 0.77 0.04 4.39 21 3.12 0.60 2.12 0.53 0.09 5.58 3.58 0.69 0.07 5.19 22 3.05 0.08 2.75 0.74 0.02 4.25 2.24 0.62 0.03 3.61 23 2.65 0.12 1.87 0.60 0.02 3.87 1.87 0.58 0.05 3.28 24 2.67 0.06 2.37 0.59 0.01 5.04 3.04 0.68 0.4 4.47
applied. The average of G-R is AVE1=0.76792, while the average of Gumbel I is AVE2=0.72333. The corresponding variation for the sample comes from G-R is var1=0.01409 and for sample comes from Gumbel I is var2=0.03190. The probability of the two samples to come from the same popu-lation is PROB=0.0000896. This means that the two samples are absolutely different.
We also calculate the quantity a1/b (modal value). It is
well-known that this represents the most probable maximum magnitude to be observed in time interval of m-years. Be-cause the time duration of each seismic zone is different, we
estimated a1/b which is the most probable magnitude in a
time interval of 1 year. The modal values used as a statisti-cally measure of seismicity (Papazachos, 1990; Papadopou-los and Voidomatis, 1987). In our study, this varies between 2.50 and 5.19 (G-R) and between 1.5 and 4.27 (Gumbel I). We observed that the values obtained through G-R technique are greater than the corresponding values of Gumbel I. This can be easily proved considering that the most of them
con-centrated, for Gumbel I, between the values a1/b=3.00–4.00
(13 observations), while we have 15 observations between
values a1/b=4.00–5.00, in the G-R process.
parison of b-values obtained through Gutenberg-Richter frequency-magnitudeFig. 3. The comparison of b-values obtained through
Gutenberg-Richter frequency-magnitude law and Gumbel I asymptotic distri-bution.
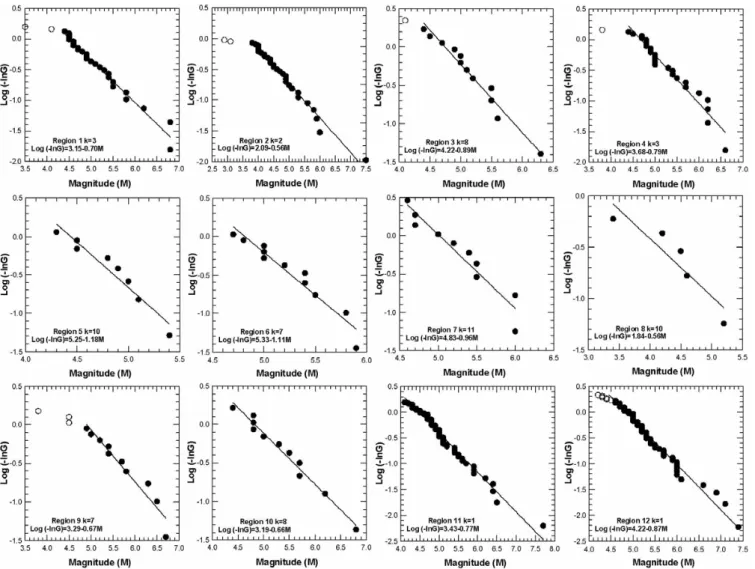
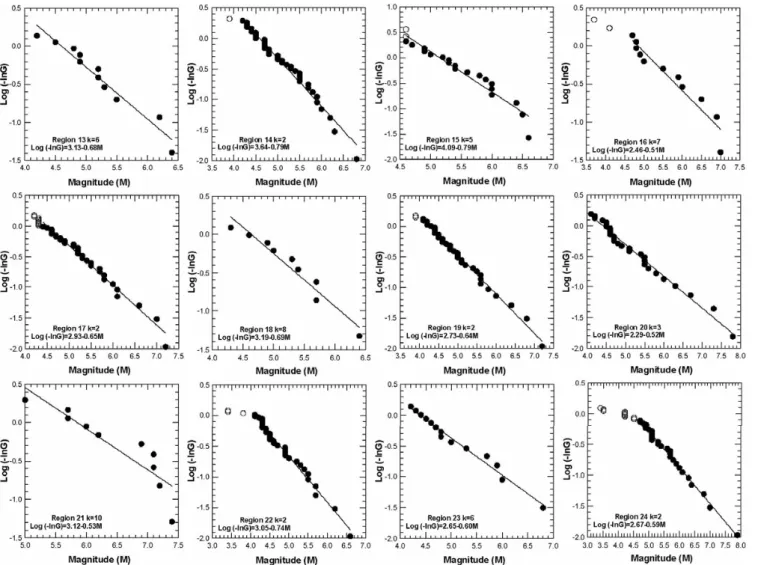
Fig. 4a. The distribution of the magnitude–frequency relationship obtained through Gumbel 1 method for 24 regions in and around Turkey.
5 Discussion and conclusions
The b-value for a region not only reflects the relative pro-portion of the number of large and small earthquakes in the region, but is also related to the stress condition over the region. Many factors can cause perturbation of the normal
b-value. On average, b-value is near unity for most
seismi-cally active regions on Earth (e.g. Frohlich and Davis, 1993). However, a detailed mapping of b-value often reveals signif-icant deviations. The spatial variation of b-values is related to the distribution of stress and strain (Mogi, 1967; Scholz, 1968). On the other hand, high b-values are reported from ar-eas of incrar-eased geological complexity (Lopez Casado et al., 1995) indicating the importance of multifracture area. Thus, the low b-value is related with low degree of heterogeneity, large stress and strain, large velocity of deformation and large faults (Manakou and Tsapanos, 2000).
In this study we made an effort in order to evaluate of seis-micity parameters of Turkey. For this purpose, Turkey was
divided into 24 seismic regions shown in Fig. 2 and the data including in the instrumental period between 1900 and 2005 were used. The seismicity parameters of a and b are esti-mated from Gutenberg-Richter law and Gumbel first asymp-totic distribution for whole areas referred above.
The tectonic environments, the time period and observed
maximum earthquake size (Mmaxobs) for each region are given
in Table 1. The extreme years (k) and percentage (%) of missing years are listed in Table 1 for each region. The maximum likelihood approach have been used in order to estimate a and b-values for the G-R method. Generally, the magnitude-frequency relationships are expressed by a straight line. Because of incompleteness in the record of small earthquakes, the data deviate from a straight line in some regions. Therefore, relationships have been calculated for earthquakes larger than cut-off magnitudes, while their cut-offs are given in Table 1 for each region. As mentioned in method chapter the optimum data processing is to involve with annual extremes. This is not so easy given that time
Fig. 4 (continued) Fig. 4b. Continued.
“gaps” existing in earthquake catalogs for various reasons (e.g. world-war). That time “gaps” are called (Makropou-los, 1978) “missing years” and defined the number of years without reported earthquakes. For this reason we accept k-years extremes instead of annual ones. In order to go for fur-ther processing we put 3 criteria: a) the results are significant when “missing years” are less than or equal to 25% (Bur-ton, 1979) the obtained b-values must be between 0.5–1.5. The least square fitting process is checked by the application
of the x2-test. We adopted the b-values where those x2-test
is minimized, and c) the pairs of the plot [Log(−lnG(Mj))–
Mj] must be greater than or equal to 5 (Hatzidimitriou et al.,
1994; Tsapanos and Papazachos, 1998). The calculated pa-rameters of the magnitude-frequency relationship from Gum-bel I method are shown in Fig. 4 and computed parameters and their standard deviations are given in Table 2.
The b-values estimated through the maximum likelihood approach for the G-R method seem to have better relation to the tectonics. In other words approximate b-values are
dominated in regions having almost the same tectonics. In details, regions 1, 2 and 3 have similar values (0.74, 0.76 and 0.78), respectively. This can related to the position of these regions which are neighbors with the easternmost part of the north Anatolian fault. The conjugate strike-slip fault system dominates the active tectonics of eastern Anatolia re-lated to these regions (Bozkurt, 2001). This system is an approximately 350 km long fault zone and consists of sev-eral segments which are seismically active and generates
ma-jor earthquakes such as 1924 Pasinler (MS=6.8), 1983
Ho-rasan (MS=6.8), 1976, C¸ aldıran (MS=7.5) and 1903 Patnos
1924 (MS=6.3). The GPS (Global Positioning System) data
gives 10±2 mm/yr for total shortening between the strike-slip faults in eastern Turkey and thrusting along the Cauca-sus (McClusky et al., 2000). The small b-values in these regions are related with low degree of heterogeneity and large faults resulting large earthquakes. These regions are clearly separated from regions 4, 5 and 6 with values 0.96, 0.94 and 0.91, respectively. From Fig. 1, we can observed
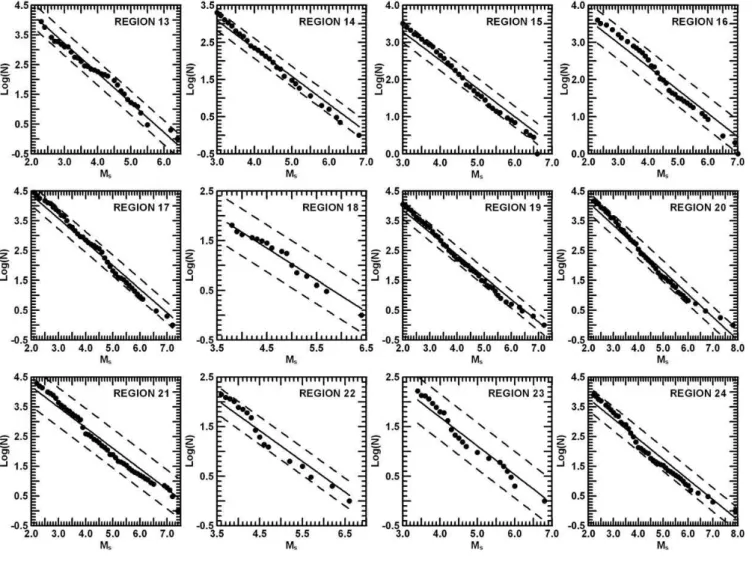
. Magnitude-frequency relations obtained through Gutenberg-Richter method by the application of maximum likelihood method. Solid line represents the fitn
Fig. 5a. Magnitude-frequency relations obtained through Gutenberg-Richter method by the application of maximum likelihood method.
Solid line represents the fitness, while broken lines are the 95% confidence limits.
that these regions are connected with the east Anatolian fault zone (EAFZ), which is not as seismically active as it is the NAFZ. Unlike NAFZ, EAFZ covered by region 6 has been relatively quiescent in the instrumental period when com-pared to historical epoch (Nalbant et al., 2002). The data used in this study includes only instrumental period quakes occurred from 1900 to 2005. Since the large
earth-quakes such as 1893 Malatya earthquake (MS=7.1) did not
occurred in the instrumental period. Also, sinistral motion in the EAFZ is 9±1 mm/yr (McClusky et al., 2000). Ac-cording to the fault slip rate and observed seismicity in the twentieth century, it is observed larger b-values in these re-gions than those of rere-gions 1, 2, and 3. The rere-gions 7, 8 and 9 are not related with the tectonics of their neighbor regions and we conclude that they are independent regions from each other, having their “own” tectonics as we can read from their b-values which are 0.79 (region 7), 0.60 (region 8) and 0.98 (region 9). Although the seismic activity of region 8 is very low, we observed low b-value due to small number of
earthquakes in this region (Figs. 4 and 5). It is interesting that regions 10, 11 and 12 have similar values, 0.74, 0.78 and 0.79, respectively. All of them belong to arcs (Cyprus and Aegean), as well as to subduction zones. It is also very thought-provoking that region 13 which has no relation with subductions has a b-value of 1.00; nevertheless it is very near to such tectonics. Another fascinate group of similar b-values exist for regions 14 (b=0.75), region 15 (b=0.76), re-gion 17 (b=0.79) and rere-gion 19 (b=0.75). These rere-gions par-tially belong to the east Aegean Sea and their continuations are on minor Asia shores. These regions are very seismi-cally active and earthquakes with magnitudes around 6.0 of-ten occurred there. These b-values of-tend to be associated with regions of predominantly seismic deformation (Koravos, et al., 2003). We can therefore conclude that these values are closely associated with the high deformation existing in the eastern part of Aegean. It is impressed that regions 16 and 18 which are parts of the inner Turkey territory have differ-ent b-values, 0.63 and 0.64, respectively. The major faults in
Fig. 5 (continued)
Fig. 5b. Continued.
these regions are Sultandaˇgı fault and In¨on¨u-Dodurga fault of which lengths are 146 km and 77 km, respectively (Ulusay et al., 2004). These faults are very seismically active and
pro-duced large earthquakes such as 1931 Aks¸ehir (MS=7.0) and
1956 Eskis¸ehir (MS=6.4). Region 20 is the westernmost part
of NAFZ. The influence of the North Aegean seismicity and the tectonics of the area (transform faulting) are obvious to the b-value (0.77) of this region. Large faults are dominated in this area which is the continuation of NAFZ in the north Aegean area (north branch). This value seems to be closer to the b-values of the regions of eastern Aegean and minor Asia shores, instead of the values evaluated for the rest parts of NAFZ which are regions 21 and 24 with corresponding
b-values 0.69 and 0.68. We analyzed region 20 in two
subre-gions in order to see why the b-value in this region is greater than those of the other parts of NAFZ (region 21 and 24). One part is up to the Calipole peninsula and the second part is the rest of it which mainly is to the north Aegean. We found through maximum likelihood that b-values for the first part is 0.65, very close to the values belonged to regions 21
and 24, and for the second part is 0.71 which is close to the values of regions 14, 15, 17 and 19. The b-values obtained for the regions 22 and 23, are 0.62 and 0.58, respectively, lead us to the conclusion that these are not multifractal areas or in other words they show a high degree of homogeneity. These values and the values of the regions 16 and 18 chased us to conclude that the central part of Turkey show the same tectonic behavior.
The picture of the spatial distribution of the parameter b is different when we involve with b-values calculated through Gumbel’s I asymptotic distribution. Characteristic example depicted in the regions which belong to the east Aegean and minor Asia area. Only two of them (regions 14 and 15) seems to have same b-values and consequently similar tec-tonics. On the other hand regions 17, 18 and 19 have al-most same values. But this is not true because the tectonics of the region 18 has no any connection with the two others because it is in the inner part of Turkey and not closer the east Aegean anyway. Unusual low b-values revealed for the three regions 20 (0.52), 21 (0.53) and 24 (0.59) from which
Fig. 6a. b-values computed from Gutenberg-Richter method for different 24 seismic source regions in and around Turkey
Fig. 6a. b-values computed from Gutenberg-Richter method for
different 24 seismic source regions in and around Turkey.
Fig. 6b. b-values computed from Gumbel 1 method for different 24 seismic source regions in and around Turkey
Fig. 6b. b-values computed from Gumbel 1 method for different 24
seismic source regions in and around Turkey.
NAFZ comprised. According to Scholz (1968), low values indicate that the state of stress is high. But in 1999, dur-ing August and November, two large earthquakes occurred in the region 20 and of course the level of stresses in the re-gion should be not so high now. It is depicted from Fig. 2 that region 20 is dominated by the western continuation of the north Anatolian fault into the north Aegean sea where the seismicity is very high. Koravos et al. (2003) determined a maximum magnitude of this region of 7.4±0.4 by the seismic moment release rates. Their estimate was constrained by tec-tonic moment release based on geodesy. Generally speaking the NAFZ is a very active structure and according to geodesy accommodates 24–30 mm/yr of dextral motion (Reilinger et al., 1997). This observation interprets our results, obtained by both methods (low b-values), and lead us to the conclu-sion that even after the occurrence of the two recent large earthquake, the NAFZ remains a tectonic structure of high risk.
Fig. 7. a /b values computed from Gutenberg-Richter method for different 24 seismic source regions in and around Turkey
Fig. 7. a1/b values computed from Gutenberg-Richter method for
different 24 seismic source regions in and around Turkey.
The calculated magnitude-frequency relationships from G-R method with 95% confidence limits obtained through maximum likelihood technique are shown in Fig. 5. A map produced (Fig. 6) in order to show the spatial distribution of the b-values is obtained through a) G-R method and b) Gum-bel I distribution.
Recently, Yılmazt¨urk et al. (1999), Bayrak et al. (2002) and Bayrak et al. (2005) showed that distribution of modal values (a/b) computed G-R law provide detailed images of the local areas demonstrated by high and low seismic zones in Turkey and the world. They stated that a/b values repre-sent the tectonic and seismicity of Turkey and world better than b-values.
In order to establish if modal values a1/b have better
fit-ting to the tectonics, instead of b-values, the modal values for 24 seismic regions were evaluated. These modal values are listed in Table 3. As it was observed there is not any obvious correlation between modal values and the tectonics. Almost the same values occupied the seismic regions exam-ined. There is no any clear grouping of these values as it was found for the b-values. For example region 5 which belongs to the same group with regions 4 and 6, according to the
b-values, has the lowest value, a1/b=2.50, while regions 4 and
6 have totally different modal values, 4.72 and 3.81, respec-tively. However, some characteristic values were observed for some particular regions. Region 21 which occupies the most part of NAFZ shows the largest value which is 5.19 and this is the most probable annual maximum magnitude for the region. It is also important that the modal value of region 12 (Aegean arc-subduction) has the second largest size which is 5.01. Both of them considered as the most seismically ac-tive zones among the studied seismic regions. All of the rest regions show rather lower than 5.00 modal values, and the nearest values observed in region 17 (4.79). Another useful observation, for the groups extracting from b-values, is that regions 22 and 23 have values of the same order 3.68 and
Table 3. Ranking the 24 seismic regions of Turkey and its
surround-ings according to their seismicity.
No. Region a1/b Place
1 21 5.19 ANAFZ 2 12 5.01 Aegean Arc 3 17 4.79 KSZBF 4 4 4.72 BTZ
5 11 4.66 Muˇgla and Rhodes 6 2 4.48 KITC¸ F
7 24 4.47 ENAFZ 8 15 4.46 Gediz Graben 9 1 4.44 NEAFZ
10 9 4.42 Eastern part of Cyprus Arc 11 20 4.39 MNAFZ
12 19 4.39 YGMUEF 13 13 4.34 BFZ
14 14 4.32 B¨uy¨uk and K¨uc¸¨uk Menderes Grabens 15 3 4.20 MESF
16 16 4.17 SBTF
17 10 4.01 Western part of Cyprus Arc 18 6 3.81 EAFZ
19 7 3.78 A part of Dead Sea Fault 20 22 3.61 MAFS
21 8 3.55 North part of Cyprus 22 18 3.54 E˙IDKF
23 23 3.28 OMF 24 5 2.50 KEZ
3.28. Other values of a1/b between 3.00 and 3.99 observed
for regions 6, 7, 8 and 18. The modal values obtained for the 24 seismic regions are listed in Table 3.
The general conclusion we can make is that b-values, ob-tained through the maximum likelihood approach, express better the tectonics of the examined area. They are form groups of closely b-values, which seem to be correlated in a high degree with the prevailed tectonics of the seismic re-gions under investigation. Modal values express the seismic-ity of the area but they are not connected directly to the tec-tonics.
Acknowledgements. The authors would like to express their sincere
thanks to D. Slejkothe and unknown reviewer for their constructive criticisms. Also G. Koravos wants to thank GSRT (Greece) for supported this work by the project EPAN-M.4.3.6.1B.
Edited by: M. Contadakis
Reviewed by: D. Slejko and another anonymous referee
References
Allen, C. R., Amand, P. S., Richter, C. F., and Nordquist, J. M.: Relation between seismicity and Geological structure in southern California region, B. Seismol. Soc. Am., 55, 752–797, 1965.
Allen, C. R.: Active faulting in northern Turkey. Division of geo-logical Science, California Institute of Technology Contribution, No. 1577, 1969.
Bayrak, Y., Yılmazt¨urk, A., and ¨Ozt¨urk, S.: Lateral variations of the modal (a/b) values for the different regions of the world, J. Geodynamics, 34, 653–666, 2002.
Bayrak, Y., Yılmazt¨urk, A., and ¨Ozt¨urk, S.: Relationships between fundamental seismic hazard parameters for the different source regions in Turkey, Natural Hazards, 36, 445–462, 2005. Bath, M.: Introduction to Seismology, Birkhauser Vertlag, Basel,
395 pp, 2007, 1973.
Bath, M.: Seismicity of Tanzania region, Tectonophysics, 27, 353– 379, 1975.
Bath, M.: Earthquake frequency and energy in Greece, Tectono-physics, 95, 233–252, 1983.
Bozkurt, E.: Neotectonics of Turkey – a synthesis, Geodinamica Acta, 14, 3–30, 2001.
Burton, P. W.: The application of extreme value statistics to seis-mic hazard assessment in the European area, Proc. Symp. Anal-ysis of Seismicity and on Seismic Risk, Liblice, 17–22 October, Academia, Prague, 323–334, 1977.
Burton, P. W.: Seismic risk in southern Europe through to India examined using Gumbel’s third distribution of extreme values, Geophys. J. R. Astron. Soc., 59, 249–280, 1979.
Curtis, J. W.: A magnitude domain study of the seismicity of Papua, New Guinea and the Solomon islands, B. Seismol. Soc. Am., 63, 787–806, 1973.
Dewey, J. F., Pitman, W. C., Ryan, W. B. F., and Bonnin, J.: Plate tectonics and the evolution of the Alpine system, Geol. Soc. Am. B., 84, 3137–3180, 1973.
Epstein, B. and Lomnitz, C.: A model for the occurrence of large earthquakes, Nature, 211, 954–956, 1966.
Erdik, M., Alpay, B. Y., Onur, T., Sesetyan, K., and Birgoren, G.: Assessment of earthquake hazard in Turkey and neighboring re-gions, Annali di Geofisica, 42, 1125–1138, 1999.
Frohlich, C. and Davis, S.: Teleseimic b-values: or, much ado about 1.0, J. Geophys. Res., 98, 631–644, 1993.
Gringorten, I. I.: A plotting rule for extreme probabilistic paper, J. Geophys. Res., 68, 813–814, 1963.
Gumbel, L. J.: Les valeurs extr`emes des distribution statistiques, Ann. Inst. Henri Poincar`e, 5, 815–826, 1935.
Gumbel, L. J.: Statistics of Extemes, Columbia University Press, New York, N.Y., 375 pp., 1966.
Gutenberg, R. and Richter, C. F.: Frequency of earthquakes in Cal-ifornia, B. Seismol. Soc. Am., 34, 185–188, 1944.
Hempton, M. R.: Structure and deformation history of Bitlis suture near lake Hazar, southeastern Turkey, B. Geol. Soc. Am., 96, 233–243, 1985.
Hatzidimitriou, P. M., Papadimitriou, E. E., Mountrakis, D. M., and Papazachos, B. C.: The seismic parameter b of the frequency-magnitude relation and its association with geological zones in the area of Greece, Tectonophysics, 120, 141–151, 1985. Hatzidimitriou, P. M., Papazachos, B. C., and Karakaisis, G. F.:
Quantitative seismicity of the Aegean and the surrounding area, in: Proc. of the XXIV Gen. Assembly of E.S.C., Athens, 19–24 September 1994, pp. 155–164, 1994.
Kaila, K. L. and Narain, H.: A new approach for preparation of quantitative seismic maps, as applied to Alpide belt-Sunda arc and adjoining areas, B. Seismol. Soc. Am., 61, 1275–1291, 1971.
Koravos, G. Ch., Main, I. G., Tsapanos, T. M., and Musson, R. M.: Maximum earthquake magnitudes in the Aegean are constrained by tectonic moment release rates, Geophys. J. Int., 152, 94–112, 2003.
Lopez Casado, C., Sanz de Galdeano, C., Delgado, J., and Pienado, M. A.: The b parameter in the Betic Cordillera, Rif and nearby sectors. Relations with the tectonics of the region, Tectono-physics, 248, 277–292, 1995.
Makropoulos, K. C.: The statistics of large earthquake magnitude and an evaluation of Greek seismicity, PhD. Thesis, Univ. of Ed-inburgh, EdEd-inburgh, 193 pp, 1978.
Manakou, M. V. and Tsapanos, T. M.: Seismicity and seismic haz-ard parameters evaluation in the island of Crete and surrounding area inferred from mixed files, Tectonophysics, 321, 157–178, 2000.
McClusky, S., Balassanian, S., Barka, A., Demir, C., Ergintav, S., Georgiev, I., G¨urkan, O., Hamburger, M., Hurst, K., Kahle, H., Kastens, K., Kekelidze, G., King, R., Kotzev, V., Lenk, O., Mah-moud, S., Mishin, A., Nadariya, M., Ouzounis, A., Paradissis, D., Peter, Y., Prilepin, M., Reilinger, R., S¸anlı, I., Seeger, H., Tealeb, A., Toks¨oz, M. N., and Veis, G.: Global positioning sys-tem constraints on plate kinematics and dynamics in the eastern Mediterranean and Caucasus, J. Geophys. Res., 105(B3), 5695– 5719, 2000.
McKenzie, D. P.: Active tectonics of the Mediterranean region, Geophys. J. R. Astron. Soc., 30, 109–185, 1972.
McKenzie, D. P.: Active tectonics of the Alpine-Himalayan belt: the Aegean Sea and surrounding regions, Geophys. J. Royal As-tron. Soc., 55, 217–254, 1978.
Mogi, K.: Regional variation of aftershock activity, B. Earthquake Res. Inst. Univ. Tokyo, 46, 175–203, 1967.
Nalbant, S., McClusky, J., Steacy, S., and Barka, A.: Stress accumu-lation and increased seismic risk in eastern Turkey, Earth Planet. Sci. Lett., 195, 291–298, 2002.
Page, K.: Aftershocks and microaftershocks of the great Alaska earthquake of 1964, B. Seism. Soc. Am., 58, 1131–1168, 1968. Papadopoulos, G. A. and Voidomatis, Ph.: Evidence for periodic
seismicity in the inner Aegean seismic zone, Pageoph, 125, 613– 628, 1987.
Papazachos, B. C. and Comninakis, P. E.: Geophysical and tectonic features of the Aegean arc, J. Geophys. Res., 76, 8517–8533, 1971.
Papazachos, B. C.: Dependence of the seismic parameter b on the magnitude range, Pure Appl. Geophys., 112, 1059–1065, 1974. Papazachos, B. C.: Seismicity of the Aegean and surrounding area,
Tectonophysics, 178, 287–308, 1990.
Reilinger, R. E., McClusky, S., Oral, M. B., King, R. W., Toksoz, N., Barka, A. A., Kinik, I., Lenk, O., and Sanli, I.: Global Posi-tioning System measurements of present-day crustal movements in the Arabia-Africa-Eurasia plate collision zone, J. Geophys. Res., 102, 9983–9999, 1997.
Scholz, C. H.: The frequency-magnitude relation of microfracturing in rock and its relation to earthquakes, B. Seism. Soc. Am., 58, 399–415, 1968.
S¸aroˇgu, F., Emre, O., and Kus¸cu, I.: Active fault map of Turkey, General Directorate of Mineral Research and Explo-ration, Ankara, Turkey, 1992.
S¸eng¨or, A. M. C.: The North Anatolian Transform Fault: its age, offset and tectonic significance, J. Geol. Soc., London, 136, 269– 282, 1979.
S¸eng¨or, A. M. C., G¨or¨ur, N., and S¸aroˇgu, F.: Strike-slip faulting and related basin formation in zones of tectonic escape: Turkey as a case study, in: Strike-slip Faulting and Basin Formation, edited by: Biddle K. T., Christie-Blick, N., Soc. Econ. Paleontol. Mineral. Sp. Pub., 37, 227–264, 1985.
Tsapanos, T. M.: b-values of two tectonic parts in the circum-pacific belt, Pageoph, 134, 229–242, 1990.
Tsapanos, T. M. and Burton, P. W.: Seismic hazard evaluation for specific seismic regions of the world, Tectonophysics, 194, 153– 169, 1991.
Tsapanos, T. M. and Papazachos, B. C.: Geographical and vertical variation of the earth’s seismicity, J. Seismol., 2, 183–198, 1998. Ulusay, R., Tuncay, E., Sonmez, H., and Gokceoglu, C.: An atten-uation relationship based on Turkish strong motion data and iso-acceleration map of Turkey, Engng. Geol., 74, 265–291, 2004. Wang, J. H.: b-values of shallow earthquakes in Taiwan, B. Seismol.
Soc. Am., 78, 1243–1254, 1988.
Yegulalp, T. M. and Kuo, J. T.: Statistical prediction of occurrence of maximum magnitude earthquakes, B. Seismol. Soc. Am., 64, 393–414, 1974.
Yılmazt¨urk, A., Bayrak, Y., and C¸ akır, ¨O.: Crustal seismicity in and around Turkey, Natural Hazards, 18, 253–267, 1999.