HAL Id: hal-00303209
https://hal.archives-ouvertes.fr/hal-00303209
Submitted on 13 Dec 2007HAL is a multi-disciplinary open access
archive for the deposit and dissemination of sci-entific research documents, whether they are pub-lished or not. The documents may come from teaching and research institutions in France or abroad, or from public or private research centers.
L’archive ouverte pluridisciplinaire HAL, est destinée au dépôt et à la diffusion de documents scientifiques de niveau recherche, publiés ou non, émanant des établissements d’enseignement et de recherche français ou étrangers, des laboratoires publics ou privés.
Total Observed Organic Carbon (TOOC): A synthesis of
North American observations
C. L. Heald, A. H. Goldstein, J. D. Allan, A. C. Aiken, E. Apel, E. L. Atlas,
A. K. Baker, T. S. Bates, A. J. Beyersdorf, D. R. Blake, et al.
To cite this version:
C. L. Heald, A. H. Goldstein, J. D. Allan, A. C. Aiken, E. Apel, et al.. Total Observed Organic Carbon (TOOC): A synthesis of North American observations. Atmospheric Chemistry and Physics Discussions, European Geosciences Union, 2007, 7 (6), pp.17825-17871. �hal-00303209�
ACPD
7, 17825–17871, 2007 Total Observed Organic Carbon (TOOC) C. L. Heald et al. Title Page Abstract Introduction Conclusions References Tables Figures ◭ ◮ ◭ ◮ Back CloseFull Screen / Esc
Printer-friendly Version Interactive Discussion Atmos. Chem. Phys. Discuss., 7, 17825–17871, 2007
www.atmos-chem-phys-discuss.net/7/17825/2007/ © Author(s) 2007. This work is licensed
under a Creative Commons License.
Atmospheric Chemistry and Physics Discussions
Total Observed Organic Carbon (TOOC):
A synthesis of North American
observations
C. L. Heald1, A. H. Goldstein1, J. D. Allan2, A. C. Aiken3,9, E. Apel4, E. L. Atlas5, A. K. Baker6, T. S. Bates7, A. J. Beyersdorf6, D. R. Blake6, T. Campos4, H. Coe2, J. D. Crounse8, P. F. DeCarlo3,9, J. A. de Gouw10, E. J. Dunlea9, F. M. Flocke4, A. Fried4, P. Goldan10, R. J. Griffin11, S. C. Herndon12, J. S. Holloway10,
R. Holzinger13, J. L. Jimenez3,9, W. Junkermann14, W. C. Kuster10, A. C. Lewis15, S. Meinardi6, D. B. Millet16, T. Onasch12, A. Polidori17, P. K. Quinn7,
D. D. Riemer5, J. M. Roberts10, D. Salcedo18, B. Sive11, A. L. Swanson19, R. Talbot11, C. Warneke9,10, R. J. Weber20, P. Weibring4, P. O. Wennberg8, A. E. Wittig21, R. Zhang22, J. Zheng22, and W. Zheng4
1
Department of Environmental Science and Policy Management, University of California, Berkeley, CA, USA
2
School of Earth, Atmospheric and Environmental Sciences, University of Manchester, Manchester, UK
3
Department of Atmospheric and Oceanic Science, University of Colorado, Boulder, CO, USA
4
Atmospheric Chemistry Division, National Center for Atmospheric Research, Boulder, CO, USA
5
ACPD
7, 17825–17871, 2007 Total Observed Organic Carbon (TOOC) C. L. Heald et al. Title Page Abstract Introduction Conclusions References Tables Figures ◭ ◮ ◭ ◮ Back CloseFull Screen / Esc
Printer-friendly Version Interactive Discussion
EGU
6
Department of Chemistry, University of California, Irvine, CA, USA
7
NOAA/PMEL, Seattle, WA, USA
8
California Institute of Technology, Pasadena, CA, USA
9
Cooperative Institute for Research in Environmental Sciences (CIRES), University of Colorado at Boulder, Boulder, CO, USA
10
Chemical Sciences Division, NOAA Earth System Research Laboratory, Boulder CO, USA
11
Institute for the Study of Earth, Oceans, and Space, University of New Hampshire, Durham, NH12Aerodyne Research, Inc., Billerica, MA, USA
13
Institute for Marine and Atmospheric Research (IMAU), Utrecht University, Utrecht, The Netherlands
14
Forschungszentrum Karlsruhe, IMK-IFU, Garmisch-Partenkirchen, Germany
15
Department of Chemistry, University of York, Heslington, York, UK
16
Department of Soil, Water and Climate, University of Minnesota, St. Paul, MN, USA
17
Department of Civil and Environmental Engineering, University of Southern California, Los Angeles, CA, USA
18
Centro de Investigaciones Qu´ımicas, Universidad Aut ´onoma del Estado de Morelos, Av. Cuernavaca, Mexico
19
Northrop Grumman Space Technology, Chemistry Technology Department, Redondo Beach, CA, USA
20
School of Earth and Atmospheric Sciences , Georgia Institute of Technology, Atlanta, GA, USA
21
Department of Civil Engineering, City College of New York, New York, NY, USA
22
Department of Atmospheric Sciences, Texas A and M University, College Station, TX, USA Received: 26 October 2007 – Accepted: 16 November 2007 – Published: 13 December 2007 Correspondence to C. L. Heald (heald@atmos.berkeley.edu)
ACPD
7, 17825–17871, 2007 Total Observed Organic Carbon (TOOC) C. L. Heald et al. Title Page Abstract Introduction Conclusions References Tables Figures ◭ ◮ ◭ ◮ Back CloseFull Screen / Esc
Printer-friendly Version Interactive Discussion
Abstract
Measurements of organic carbon compounds in both the gas and particle phases mea-sured upwind, over and downwind of North America are synthesized to examine the total observed organic carbon (TOOC) over this region. These include measurements made aboard the NOAA WP-3 and BAe-146 aircraft, the NOAA research vessel Ronald 5
H. Brown, and at the Thompson Farm and Chebogue Point surface sites during the summer 2004 ICARTT campaign. Both winter and summer 2002 measurements dur-ing the Pittsburgh Air Quality Study are also included. Lastly, the sprdur-ing 2002 obser-vations at Trinidad Head, CA, surface measurements made in March 2006 in Mex-ico City and coincidentally aboard the C-130 aircraft during the MILAGRO campaign 10
and later during the IMPEX campaign off the northwestern United States are incorpo-rated. Concentrations of TOOC in these datasets span more than two orders of magni-tude. The daytime mean TOOC ranges from 4.0 to 456 µgC m−3from the cleanest site (Trinidad Head) to the most polluted (Mexico City). Organic aerosol makes up 3–17% of this mean TOOC, with highest fractions reported over the northeastern United States, 15
where organic aerosol can comprise up to 50% of TOOC. Carbon monoxide concen-trations explain 46 to 86% of the variability in TOOC, with highest TOOC/CO slopes in regions with fresh anthropogenic influence, where we also expect the highest degree of mass closure for TOOC. Correlation with isoprene, formaldehyde, methyl vinyl ketene and methacrolein also indicates that biogenic activity contributes substantially to the 20
variability of TOOC, yet these tracers of biogenic oxidation sources do not explain the variability in organic aerosol observed over North America. We highlight the critical need to develop measurement techniques to routinely detect total gas phase VOCs, and to deploy comprehensive suites of TOOC instruments in diverse environments to quantify the ambient evolution of organic carbon from source to sink.
ACPD
7, 17825–17871, 2007 Total Observed Organic Carbon (TOOC) C. L. Heald et al. Title Page Abstract Introduction Conclusions References Tables Figures ◭ ◮ ◭ ◮ Back CloseFull Screen / Esc
Printer-friendly Version Interactive Discussion
EGU
1 Introduction
We introduce here a new paradigm for holistic consideration of the total organic carbon (TOC) budget. Similar budget approaches are routinely used for nitrogen oxides and sulfur in the atmosphere, and rapidly improving measurement techniques are begin-ning to make this possible for organic carbon. Despite these advances, complete TOC 5
closure in the atmosphere is not yet possible. We therefore focus here on the total ob-served organic carbon (TOOC) budget (excluding methane), which reflects the subset of compounds currently measured in the ambient atmosphere.
Carbon in the atmosphere is dominated by its inorganic forms, particularly, carbon dioxide (CO2), the global annual average concentrations of which reached 385 ppm 10
in 2006 (equivalent to a global burden of 820 PgC)(IPCC, 2007). The most abundant organic gas in the troposphere is methane, with a current global annual mean con-centrations of ∼1751 ppb (equivalent to ∼4 PgC) (Dlugokencky et al., 2003). While methane is an important greenhouse gas, it is long lived (lifetime ∼10 years) and has a comparatively well understood life cycle in the troposphere. Therefore, it will be 15
excluded from the organic carbon budget discussed here. Organic carbon in the at-mosphere, excluding methane, is a much smaller carbon reservoir (estimates range in the ∼10 s TgC) (IPCC, 2007). However, these compounds play an important role in the chemistry of the troposphere, and in aerosol form, as a climate forcing agent. The organic carbon budget includes a large suite of compounds, with many that are 20
likely to contribute (based on laboratory studies or theory) not having been observed under ambient conditions (Goldstein and Galbally, 2007), with varying sources, life-times and properties in the atmosphere. Measurements of TOC are difficult, thus the organic carbon budget in the atmosphere remains poorly quantified. Organic carbon is lost from the atmosphere via multiple gas-phase oxidation steps to CO and CO2 or 25
wet and dry deposition to the surface. Recent studies suggest that organic carbon may undergo chemically mediated phase changes under ambient conditions (Kwan et al., 2006; Molina et al., 2004; George et al., 2007), suggesting a “fluid” organic carbon pool
ACPD
7, 17825–17871, 2007 Total Observed Organic Carbon (TOOC) C. L. Heald et al. Title Page Abstract Introduction Conclusions References Tables Figures ◭ ◮ ◭ ◮ Back CloseFull Screen / Esc
Printer-friendly Version Interactive Discussion in the atmosphere (Fig. 1).
Organic carbon in the atmosphere includes hydrocarbons, oxygenated or halo-genated compounds and multifunctional compounds, as well as particulate matter. Dominant and well-studied organic constituents of the atmosphere include alkanes and alkenes (Harley et al., 1993; Goldstein et al., 1996), formaldehyde (Singh et al., 5
1995;Chance et al., 2000), acetone (Jacob et al., 2002), methanol (Jacob et al., 2005; Galbally and Kirstine, 2002), and isoprene Guenther et al., 1995), which originate from a range of anthropogenic and natural sources, and both primary and secondary pro-cesses. An additional source of TOOC, as defined here, is the oxidation of methane to formaldehyde. Aerosol organic carbon can be directly emitted from combustion and 10
other sources or formed in the atmosphere from oxidation of both biogenic and anthro-pogenic volatile organic compounds (VOCs). These aerosol classes are referred to as primary organic aerosol (POA) and secondary organic aerosol (SOA) respectively (Seinfeld and Pankow, 2003).
The number of organic compounds in the atmosphere far exceeds the number of 15
measured species. In 1986, Graedel et al. (1986) identified 2857 organic compounds in the atmosphere and current estimates of identified compounds exceed 104(Goldstein and Galbally, 2007). A suite of hydrocarbons and VOCs are routinely detected using Gas Chromatography (GC) (Blake et al., 1992; Lamanna and Goldstein, 1999) and Proton Transfer Reaction Mass Spectrometry (PTR-MS) techniques (Lindinger et al., 20
1998; de Gouw et al., 2003). The number of reported compounds for a typical field campaign ranges from 30 to 100. Instruments designed to measure “total VOCs” in the gas-phase suggest that the VOC mass reported by these speciated techniques account for 55–85% of the total VOC mass, with a growing unidentified fraction as air masses age (Chung et al., 2003). However, Roberts et al. (1998) achieved closure (to 25
measurement precision) between total non-methane organic carbon and the sum of C2–C7hydrocarbons and carbonyls measured in Chebogue Point, Nova Scotia.
Addi-tional total VOC measurements are needed to clarify the conditions necessary for gas phase organic carbon mass closure.
ACPD
7, 17825–17871, 2007 Total Observed Organic Carbon (TOOC) C. L. Heald et al. Title Page Abstract Introduction Conclusions References Tables Figures ◭ ◮ ◭ ◮ Back CloseFull Screen / Esc
Printer-friendly Version Interactive Discussion
EGU Limitations of current measurement techniques dictate that semi-volatile compounds
and particularly those with multiple functional groups typically are not measured. Indi-vidually these compounds are expected to be present at low concentrations, but the cumulative contribution of all of these compounds and their isomers may be large (Goldstein and Galbally, 2007). Box models of oxidation predict that even after sev-5
eral days, the bulk of oxidized mass exists as highly functionalized organics in the atmosphere (Aumont et al., 2005). In particular, large semi-volatile compounds may contribute disproportionately to SOA formation (Robinson et al., 2007).
Organic aerosol traditionally has been sampled on filters and thermally separated and detected off-line after collection (Watson and Chow, 2002). Recent on-line instru-10
ments, such as the Aerosol Mass Spectrometer (AMS) (Canagaratna et al., 2007), the Sunset Labs OC/EC (elemental carbon) analyzer (Lim et al., 2003) and water-soluble organic carbon (WSOC) particle-into-liquid sampler (PILS) instrument (Sullivan et al., 2004), provide higher time-resolution measurements of organic matter in particles. The organic aerosol concentrations reported by these techniques may differ due to opera-15
tional definitions and collection efficiencies. Some chemical information on the types of species present can be extracted from the AMS spectra (Zhang et al., 2005). FTIR and NMR spectroscopies have been used to identify and quantify the relative contributions of organic functional groups within aerosol samples (Gilardoni et al., 2007; Decesari et al., 2007). Highly speciated organic aerosol measurements can be made using multi-20
dimensional chromatography (GCxGC) which differentiates compounds based on both volatility and polarity (Lewis, 2000). Using this technique a single organic aerosol filter sample from London, England was found to contain over 10 000 individual compounds (Hamilton et al., 2004). Analysis of GCxGC measurements is onerous; therefore, the record of ambient speciated organic aerosol composition measured by this technique 25
is sparse. In addition, some compounds can decompose upon heating in the GC in-jector and column (Tobias et al., 2000), and traditional GC analyses using non-polar columns discriminate against compounds that comprise oxygenated organic aerosols
ACPD
7, 17825–17871, 2007 Total Observed Organic Carbon (TOOC) C. L. Heald et al. Title Page Abstract Introduction Conclusions References Tables Figures ◭ ◮ ◭ ◮ Back CloseFull Screen / Esc
Printer-friendly Version Interactive Discussion Huffmann et al. (20071) which represents the largest fraction of organic aerosol mass
in the atmosphere (Zhang et al., 2007a). Alternative techniques of organic specia-tion that do not require chromatographic separaspecia-tion are under development. However, species identification remains difficult, and few ambient results have been reported to date (Hearn and Smith, 2006; Oktem et al., 2004).
5
De Gouw et al. (2005) first used ambient measurements to examine how the rela-tionship between gas and aerosol organic carbon evolves in anthropogenic plumes. We present here a synthesis of organic carbon compound data in both the gas and particle phases measured over and downwind of North America and the first attempt to assess the mean TOOC budget over this region. Variability of TOOC on this scale 10
as well as future directions are also discussed.
2 Mean TOOC over North America
Coincident observations of both aerosol and speciated gas-phase organics are rare. Therefore, we focus here on North America (and upwind/downwind), a region with comprehensive measurements from numerous measurement campaigns.
15
Both gas and particle phase organic carbon were measured during the International Consortium for Atmospheric Research on Transport and Transformation (ICARTT) campaign of the summer 2004 on multiple platforms (Fehsenfeld et al., 2006). These include the NOAA WP-3 aircraft which surveyed northeastern North America focusing on urban plumes, the FAAM BAe-146 aircraft based in the Azores in the mid-Atlantic 20
(Lewis et al., 2007), the NOAA Research Vessel Ronald H. Brown (RHB) in the Gulf of Maine, the University of New Hampshire Observing Station at Thompson Farm (TF,
1
Huffman, J. A., Aiken, A. C., Docherty K. S., et al.: Volatility of primary and secondary organic aerosol in the field contradicts current model representations, Geophys. Res. Lett., submitted, 2007.
ACPD
7, 17825–17871, 2007 Total Observed Organic Carbon (TOOC) C. L. Heald et al. Title Page Abstract Introduction Conclusions References Tables Figures ◭ ◮ ◭ ◮ Back CloseFull Screen / Esc
Printer-friendly Version Interactive Discussion
EGU 43.11◦N, 70.95◦W, elevation 24 m) located in the southeastern, rural area of Durham,
NH, and the NOAA Chebogue Point (CHB, 43.75◦N, 66.12◦W, elevation 15 m) field site in Nova Scotia, Canada (Millet et al., 2006). In the spring of 2006 the NSF/NCAR C-130 aircraft sampled over the Mexico City region during the March MIRAGE cam-paign (MEX) DeCarlo et al. (20072), where continuous measurements were also made 5
at the T0 surface site (Instituto Mexicano del Petroleo) within the Metropolitan Area of Mexico City (19.49◦N, 99.15◦W, elevation 2240 m). In the spring of 2006 this aircraft also sampled over the western United States and eastern Pacific during the April–May INTEX-B/IMPEX campaign (IPX) Dunlea et al. (20073). We add to these observations the urban sampling from the 2001–2002 Pittsburgh Air Quality Study (PAQS) (Wittig 10
et al., 2004), from the winter and summer only when extensive VOC measurements were made as well as the ground site at Trinidad Head, CA (THD, 41.05◦N, 124.15◦W, 107 m elevation) in spring 2002 during the ITCT-2K2 campaign (Goldstein et al., 2004). Sampling locations for all these sites and platforms are shown in Fig. 2. Note that each mobile platform pursued different air masses and plumes depending on the scientific 15
objectives of the campaigns and also sampled different amounts of clear air depend-ing on the distance between bases of operation and locations of interest for sampldepend-ing. The comparisons between campaigns and platforms shown here provide a large-scale overview of organic carbon in the atmosphere, but as the data for each campaign have not been broken up by air mass type, the quantitative concentration comparisons 20
should not be over interpreted.
2
DeCarlo, P. F., Dunlea, E. J., Kimmel, J. R., et al.: Fast Airborne Aerosol Size and Chemistry Measurements with the High Resolution Aerosol Mass Spectrometer during the MILAGRO Campaign, Atmos. Chem. Phys. Discuss., submitted, 2007.
3
Dunlea, E. J., DeCarlo, P. F., Aiken, A. C., et al.: Observations of Processed Asian Pollution with a High-Resolution Time-of-Flight Aerosol Mass Spectrometer (HR-ToF-AMS) from the C-130 Aircraft During the INTEX B Field Campaign, in preparation, 2007.
ACPD
7, 17825–17871, 2007 Total Observed Organic Carbon (TOOC) C. L. Heald et al. Title Page Abstract Introduction Conclusions References Tables Figures ◭ ◮ ◭ ◮ Back CloseFull Screen / Esc
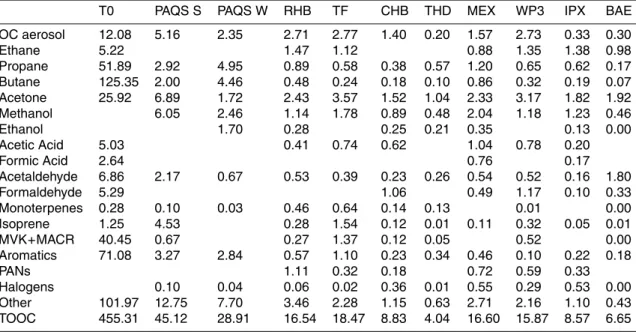
Printer-friendly Version Interactive Discussion Organic carbon species measured with less than 30% uncertainty are listed in
Ta-ble 1 for each platform along with the corresponding measurement technique (a total of 138 compounds). Concentrations of each compound are converted to units of car-bon mass concentration (µg C m−3) at standard temperature and pressure conditions (STP, 273 K, 1013.25 hPa) to compile the TOOC budget (excluding methane, by def-5
inition). Organic aerosol concentrations are measured by AMS instruments for eight of the eleven datasets examined here. The organic aerosol observations included are accumulation mode measurements, all reporting sub-micron aerosol mass (PM1), with
the exception of the PAQS filter observations which represent PM2.5. With the
excep-tion of large primary biological particles, the sub-micron size range comprises the bulk 10
of organic particulate mass (Kanakidou et al., 2005). A factor of 1.81 is applied to the measurements of water soluble organic carbon made aboard the WP-3 aircraft to account for non-soluble carbon de Gouw et al., 2007. The average ratio of particulate organic matter to organic carbon aerosol aboard the Ron Brown was determined to be 1.9 (Quinn et al., 2006). Organic elemental analysis using high-resolution AMS data 15
analysis (Aiken et al., 2007) suggests that a similar factor is appropriate for Mexico City and IMPEX. We therefore use a factor of 0.5 to convert particulate organic mat-ter to organic carbon aerosol for all platforms, with the exception of Pittsburgh, where a mean factor of 0.56 is appropriate for less aged aerosol (Zhang et al., 2005) Poli-dori et al. (20074). Turpin and Lim (2001) suggest that the carbon weight per organic 20
molecular weight can vary from 0.48 to 0.63; our use of a single conversion factor may therefore imply up to 25% error in individual observations of organic carbon in particle phase.
Mean daytime concentrations of TOOC and the contributions of several dominant species/classes (highlighted in yellow in Table 1) are shown in Fig. 3 (with values listed 25
4
Polidori, A., Turpin, B. J., Davidson, C., Rodenburg, L. A., and Maimone, F.: Organic PM2.5: Fractionation by Polarity, FTIR Spectroscopy, and OM/OC for the Pittsburgh aerosol, Aerosol Sci. Tech., submitted, 2007.
ACPD
7, 17825–17871, 2007 Total Observed Organic Carbon (TOOC) C. L. Heald et al. Title Page Abstract Introduction Conclusions References Tables Figures ◭ ◮ ◭ ◮ Back CloseFull Screen / Esc
Printer-friendly Version Interactive Discussion
EGU in Table 2). The local 06:00 a.m.–06:00 p.m. average for each location synthesizes
only measurement times where all the dominant species are reported. These “domi-nant” species account for 73–96% of TOOC. Compounds highlighted in grey in Table 1 contribute less than 1% of mean TOOC across all platforms. The details of these measurements and the concentrations of individual species can be found in the appro-5
priate mission references cited in Table 1. The bars in Fig. 3 denote the interval of ± one standard deviation on the mean TOOC. We aim here to characterize the typical TOOC budget and therefore exclude biomass burning plumes from the Alaskan fires of 2004 based on acetonitrile concentrations (Heald et al., 2006) and in the Mexico City region based on HCN concentrations throughout this analysis. We show for compari-10
son in Fig. 3 the TOOC budget in the fire plumes measured aboard the WP-3 aircraft northeastern North America. These plumes represent atypical air masses and will be discussed separately at the end of this section. The North American TOOC concen-trations shown in Fig. 3 are separated into surface and aircraft measurements and then ordered generally by distance from anthropogenic sources. Comparing between 15
datasets there is a clear decline of TOOC with “age” from sources, as expected from removal of organic carbon via deposition, oxidation to CO and CO2and dilution. How-ever, we also expect that multiple generations of oxidation produces a suite of highly functionalized gas phase compounds which are not detected in the gas phase, and thus that some proportion of this decline may be attributed to deteriorating total mass 20
closure. When interpreting this figure it is essential to acknowledge that the number of compounds measured is not consistent across all platforms, however the trend in decreasing TOOC cannot be attributed to these sampling differences. The trend in aerosol mass with distance from anthropogenic source regions is less distinct (Fig. 4), indicative of the more complex balance between aerosol formation and loss.
25
The mean TOOC ranges from 4.0 µgC m−3 measured at the coastal surface site at Trinidad Head to 455.3 µgC m−3 measured at the most polluted site (Mexico City, note concentrations in Fig. 3 are scaled down by a factor of 8 for this site). Trinidad Head was subjected to consistent daytime flow from the northwest, and thus represents
ACPD
7, 17825–17871, 2007 Total Observed Organic Carbon (TOOC) C. L. Heald et al. Title Page Abstract Introduction Conclusions References Tables Figures ◭ ◮ ◭ ◮ Back CloseFull Screen / Esc
Printer-friendly Version Interactive Discussion clean marine boundary layer concentrations, with rare Asian influence (Goldstein et al.,
2004); for those compounds measured, concentrations are consistently lower than at the other sites, with the exception of propane and aromatics, which we attribute to local emissions. TOOC aboard the BAe-146 aircraft over the Azores was also low relative to the other platforms (mean of 6.6 µgC m−3) as air masses were depleted of a number 5
of key species (monoterpenes, ethanol, methacrolein, methyl vinyl ketone), concentra-tions of which never exceeded detection limits (see Table 1). A notable exception to this are the elevated levels of acetaldehyde reported, but those may be produced during canister storage (Lewis et al., 2007). Air masses sampled in the Azores region are far from continental sources and are therefore deficient in organic compounds which are 10
removed (by precipitation and oxidation) during transport (Lewis et al., 2007). In addi-tion, many oxidized VOCs are multi-functional and may not be detected (Goldstein and Galbally, 2007). Concentrations of TOOC reported for the IMPEX campaign over the western U.S. and eastern Pacific are similarly low (mean of 8.6 µgC m−3). However, both Central Valley pollution and Asian plumes were mixed with the pristine Pacific 15
air sampled during this mission, raising hydrocarbon concentrations, particularly when compared to measurements taken near the Azores. These three datasets are signif-icantly influenced by clean marine conditions and are denoted with shades of blue in Fig. 2 as well as in Figs. 5–7 that will be discussed subsequently.
TOOC concentrations in Mexico City, North America’s most populous (over 20 million 20
inhabitants), and most polluted city Molina et al., 2007), represent a stark contrast to remote sampling and also to a U.S. urban area (Pittsburgh). Mean TOOC concen-trations are at least 10 times greater than at any other site. The proximity to large emission sources and particularly fresh hydrocarbon emissions results in high daytime mean TOOC concentrations. Over half of the TOOC consists of hydrocarbons (alkanes 25
and alkenes make up the majority of the large “other” contribution to TOOC at this site), which can be attributed to large vehicular and liquefied petroleum gas (LPG) emissions (Velasco et al., 2007). Concentrations of primary biogenic species are similar to con-centrations reported at other sites in North America. The TOOC at this site is likely
ACPD
7, 17825–17871, 2007 Total Observed Organic Carbon (TOOC) C. L. Heald et al. Title Page Abstract Introduction Conclusions References Tables Figures ◭ ◮ ◭ ◮ Back CloseFull Screen / Esc
Printer-friendly Version Interactive Discussion
EGU to be the most comprehensive in terms of carbon closure, due to the short interval
between emission and sampling, leading to a relatively smaller fraction of gas phase secondary compounds.
Typical urban conditions in North America are represented by the Pittsburgh site. Mean TOOC concentrations here in summer (45.1 µgC m−3) are greater than twice the 5
concentrations reported at other North American sites, with the exception of Mexico City. As seen in Mexico City, alkanes and alkenes are elevated at this site and con-tribute approximately half of total TOOC. Elevated propane and butane concentrations are attributed to nearby fuel and natural gas sources (Millet et al., 2005).
Mean TOOC concentrations reported by aircraft sampling outflow from the northeast-10
ern US (WP-3) and Mexico (C-130) are similar (means of 15.9 µgC m−3and 16.6 µgC m−3). During MIRAGE (Mexico City), mean concentrations of isoprene and oxidation products (including formaldehyde) are less than half of those measured over the north-eastern U.S. However the MIRAGE observations during early spring do not represent the same peak in biogenic activity as the summertime sampling of the WP-3. Over 15
Mexico City, anthropogenic compounds such as aromatics and halogens are present at over twice the mean concentration observed over the northeastern US (WP-3), and both particulate OC and methanol concentrations are also elevated.
The largest contributors to gas-phase OC across platforms are acetone (1.0– 25.9 µgC m−3), methanol (0.5–6.0 µgC m−3) and ethane (0.5–5.2 µgC m−3). The rel-20
atively long lifetimes of acetone and methanol (7–14 days) explain the prevalence of these compounds throughout the troposphere. Jacob et al. (2002, 2005) suggest a similar global atmospheric burden of 4 Tg for these two compounds; in terms of carbon this is equivalent to a factor of two more acetone than methanol, generally consis-tent with mean concentrations observed here. Ethane is relatively well-mixed in each 25
hemisphere with a lifetime of months (Rudolph, 1995; Goldstein et al., 1995).
Formaldehyde concentrations reported here make up a significant fraction of the gas-phase TOOC, with the exception of the measurements over the northeastern Pa-cific. Formaldehyde is produced in the atmosphere by the oxidation of VOCs. The
ACPD
7, 17825–17871, 2007 Total Observed Organic Carbon (TOOC) C. L. Heald et al. Title Page Abstract Introduction Conclusions References Tables Figures ◭ ◮ ◭ ◮ Back CloseFull Screen / Esc
Printer-friendly Version Interactive Discussion oxidation of methane provides a large global background of formaldehyde with major
local enhancements resulting from rapid oxidation of biogenic and anthropogenic VOC sources. Measurements of formaldehyde mixing ratios were not available at Thompson Farm, which is located in a mixed hardwood forest in New Hampshire and generally receives unpolluted airflow from the west (Talbot et al., 2005). In situ measurements 5
of formaldehyde over North America, primarily in forested regions, in the summer-fall range from 0.5–7.5 µgC m−3 (Palmer et al., 2003). Biogenic VOCs (monoterpenes, isoprene and its oxidation products methacrolein and methyl vinyl ketone) at Thomp-son Farm make up the largest fraction of the TOOC budget among all the datasets reported here White et al. (20075). Formaldehyde concentrations of 1.1–4.3 ppb (0.5– 10
2.1 µgC m−3) were observed over the region in low-altitude flights of the DC-8 in sum-mer 2004 Fried et al. (20076.) This suggests that formaldehyde from biogenic oxidation could be an important additional component to the organic carbon budget at this loca-tion.
Organic carbon in the particle phase makes up 3–17% of the TOOC budget shown 15
in Fig. 3. The highest mean concentration (12.1 µgC m−3) is reported in Mexico City, but makes up the smallest fractional contribution to TOOC at this site. The largest proportion of TOOC in aerosol (15–17%) is found over northeastern North America (WP3, RHB, TF and CHB). These sites and platforms are downwind of the Boston-New York corridor and the Ohio River Valley, but are also influenced by airflow from 20
rural northeastern U.S. and Canada (Millet et al., 2006; Quinn et al., 2006; Sullivan
5
White, M. L., Russo, R. S., Zhou, Y., Mao, H., Varner, R. K., Ambrose, J., Veres, P., Wingen-ter, O. W., Haase, K., Talbot, R., and Sive, B. C.: Volatile Organic Compounds in Northern New England Marine and Continental Environments during the ICARTT 2004 Campaign, J. Geo-phys. Res., submitted, 2007.
6
Fried, A., Walega, J. C., Olsen, J. R., et al.: Formaldehyde over North America and the North Atlantic during the Summer 2004 INTEX Campaign: Methods, Observed Distributions, and Measurement Box Model Comparisons, J. Geophys. Res., submitted, 2007.
ACPD
7, 17825–17871, 2007 Total Observed Organic Carbon (TOOC) C. L. Heald et al. Title Page Abstract Introduction Conclusions References Tables Figures ◭ ◮ ◭ ◮ Back CloseFull Screen / Esc
Printer-friendly Version Interactive Discussion
EGU et al., 2006). The observed aerosol OC includes POA from urban emissions but is
dominated by SOA from both anthropogenic and biogenic oxidation (de Gouw et al., 2005; Williams et al., 2007; Zhang et al., 2007; Zhang et al., 2007a). In general, the OC aerosol measured aboard the Ron Brown and at Chebogue Point is more oxidized than at other continental sites (Zhang et al., 2007a; Williams et al., 2007). Approximately 5
90% of the TOOC in Pittsburgh is in the gas-phase throughout the year, although the absolute concentrations of aerosol OC doubles in the summertime due to secondary production (Millet et al., 2005; Zhang et al., 2005). Air masses sampled at Trinidad Head in coastal California, by the BAe-146 near the Azores, and by the C-130 over the northeastern Pacific include non-negligible amounts of organic carbon in aerosol 10
form (mean 0.2–0.4 µgC m−3, equivalent to ∼5% of TOOC) despite the distance from continental emissions.
Particulate organic matter makes up 25–54% of the total mean aerosol mass ob-served in the studies summarized here, often in excess of sulfate (Fig. 4), a pattern that extends to most of the polluted regions of the Northern Hemisphere (Zhang et al., 15
2007a). Vertical profiles of aerosol concentrations off of eastern North America show an increase in the mean particulate organic matter to sulfate mass ratio with altitude, from 0.5 in the boundary layer up to factors of 3–4 in the mid-upper troposphere (Peltier et al., 2007a), similar to observations off of Asia (Heald et al., 2005) and the southern United States and Costa Rica (Murphy et al., 2006). However, aerosol profiles over 20
Mexico City and off of the western U.S. show greater sulfate aloft and do not exhibit this same shift in composition with altitude Peltier et al. (20077). Higher OC aerosol concentrations aloft in continental outflow regions may be the result of lofting of insol-uble SOA precursors and continuous aerosol production with aging.
The surface TOOC observations within the Metropolitan Area of Mexico City (T0) 25
are substantially elevated (by over a factor of 25 in the mean) compared to the regional
7
Peltier, R. E., Hecobian, A. H., Weber, R. J., et al.: Water-Soluble Organic and Inorganic PM1.0 Bulk Composition from Asia: Results from IMPEX-B Field Campaign, in preparation, 2007.
ACPD
7, 17825–17871, 2007 Total Observed Organic Carbon (TOOC) C. L. Heald et al. Title Page Abstract Introduction Conclusions References Tables Figures ◭ ◮ ◭ ◮ Back CloseFull Screen / Esc
Printer-friendly Version Interactive Discussion aircraft sampling of the C-130 aircraft during the MILAGRO campaign (MEX). These
differences are dominated by the high concentrations of short-lived hydrocarbon and aromatics measured within the source region. Mean daytime OC aerosol concentra-tions are eight times higher at the T0 surface site than aboard the aircraft. However, when coincident sampling periods are selected this difference is reduced to less than 5
a factor of two. Stone et al. (2007) also report a factor of two decrease in OC aerosol concentrations when moving from the urban T0 site to the peripheral T1 site in Mexico City. We attribute the reduced mean TOOC reported aboard the aircraft to both the dilution of the Mexico City outflow and the mixed regional sampling (including clean air masses) compared to the concentrated source signature reported at the surface. 10
Figure 3 compares the mean TOOC budget within air influenced by the 2004 Alaskan fires measured aboard the WP-3 aircraft, to non-fire influenced conditions. Concentra-tions of the dominant gas-phase species are elevated by 30–110% in the fire plumes, accompanied by an increase of over a factor of four in OC aerosol concentrations. Particulate organic matter contributes over 70% of the aerosol mass observed in these 15
biomass burning events (Fig. 4). Biomass burning represents the bulk of global primary emissions of organic carbon aerosol (IPCC, 2007), and this highly variable source can produce large increases in TOOC, both locally and down-wind (Lewis et al., 2007; Heald et al., 2006).
In addition to those compounds reported here, a number of lower molecular weight 20
organic carbon compounds have been detected in the ambient atmosphere. These include glyoxal, methylglyoxal, and carboxylic acids. Typical glyoxal concentrations of 0.02–0.1 ppb (Liggio et al., 2005) are a minor contributor to the organic carbon budget, although may be more important in urban regions with photochemical smog (Volkamer et al., 2006) and may be responsible for a significant fraction of urban SOA formation 25
Methylglyoxal has similarly been detected at low atmospheric concentrations (Munger et al., 1995; Spaulding et al., 2003). For most of the datasets here, acetic acid (ranging from 0.2–1.0 µgC m−3) is the only carboxylic acid measured. The C-130 observations alone include a suite of carboxylic acid measurements (C1-C3), with mean total
con-ACPD
7, 17825–17871, 2007 Total Observed Organic Carbon (TOOC) C. L. Heald et al. Title Page Abstract Introduction Conclusions References Tables Figures ◭ ◮ ◭ ◮ Back CloseFull Screen / Esc
Printer-friendly Version Interactive Discussion
EGU centrations of over 2 µgC m−3 during MIRAGE and 0.4 µgC m−3 during IMPEX.
Tan-ner and Law (2003) summarize the range of ambient formic acid (0.04–7.2 µgC m−3) observations for remote to urban conditions. The additional mass inferred for these unmeasured compounds is in line with the 55–85% VOC mass closure estimates of Chung et al. (2003).
5
3 Variability of TOOC over North America
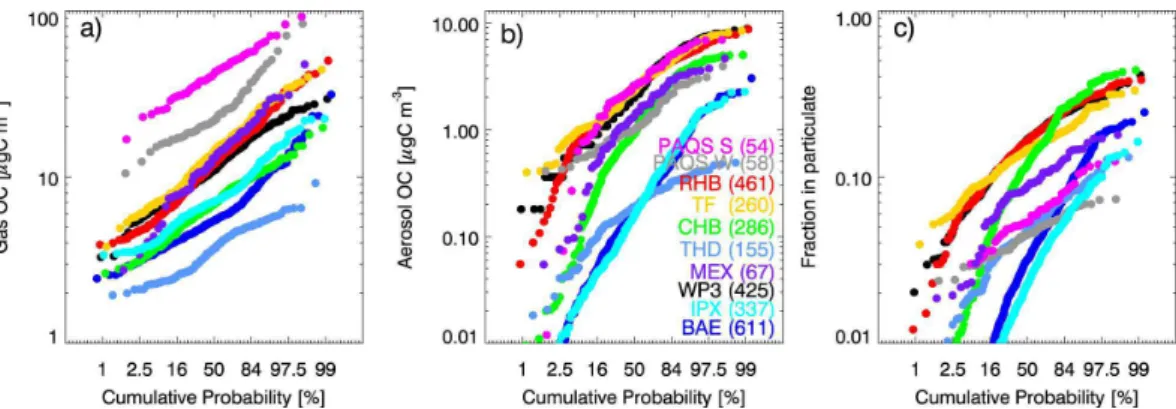
Figure 5 shows that there is large variability in the concentration and phase of TOOC. The cumulative probability distribution is shown to emphasize the “tails” of the fre-quency distribution, with the median observations shown at 50%. We note here that not all datasets include the same compounds (see Table 1). We do not include sur-10
face observations at Mexico City (T0) in the analysis of this section due to the limited number of whole air sample measurements at this site. Both gas-phase and particle-phase organic carbon observations in Fig. 5 span two orders of magnitude. Total gas-phase organic carbon is never observed below concentrations of 2 µgC m−3 at any location, and at Pittsburgh minimum concentrations are five times as high. Aerosol 15
concentrations range from detection limits up to 10 µgC m−3. The maximum observed fraction of TOOC in the particle phase for an individual observation is 50%. Previ-ous reported measurements of total non-methane organic carbon in the gas phase at Chebogue Point in Fall 1993 ranged from detection limits to 87 µgC m−3, with a mean of ∼7 µgC m−3(Roberts et al., 1998). While the mean agrees well with TOOC concen-20
trations reported here, the range of concentrations measured in 2005 appears smaller. The larger values in 1993 were attributed to plumes and our longer measurement aver-aging times (1 h) mute this effect here. The range of organic carbon concentrations, as well as the mean phase distribution (Fig. 3) is similar at Thompson Farm and aboard the Ron Brown. These two sites also have the highest proportion of organic carbon in 25
the particle phase (Fig. 5c). Together, they suggest a rather homogeneous character to surface organic carbon over New England (outside of urban areas). The aircraft
obser-ACPD
7, 17825–17871, 2007 Total Observed Organic Carbon (TOOC) C. L. Heald et al. Title Page Abstract Introduction Conclusions References Tables Figures ◭ ◮ ◭ ◮ Back CloseFull Screen / Esc
Printer-friendly Version Interactive Discussion vations provide a clear contrast between outflow conditions (WP-3 over the
northeast-ern U.S.) and remote sampling (BAe-146 over the Azores), with smaller concentrations overall measured at the Azores. The TOOC observations from the IMPEX campaign over the eastern Pacific are very similar to those in the “clean” conditions sampled over the Atlantic by the BAe-146, but with a smaller maximum fraction in aerosol form. 5
TOOC concentrations at the similarly remote Trinidad Head site in coastal California are both smaller and less variable, and thus appear to be less influenced by anthro-pogenic plumes. TOOC variability is also small at the Pittsburgh site due to the lack of very clean periods because of the consistent influence of primary gases and aerosols in urban areas.
10
Previous studies have used photochemical “clocks”, defined by contrasting rates of hydrocarbon oxidation, to characterize the evolution of air masses in the atmosphere (Roberts et al., 1984). De Gouw et al. (2005) successfully used these clocks on ob-servations of anthropogenic plumes from coastal New England in 2002 to demonstrate the increase of organic aerosol concentrations over time. We find here that a photo-15
chemical clock defined by the toluene:benzene ratio predicts a general decrease of TOOC with age for each dataset but this relationship is tenuous with low correlation coefficients (not shown). Part of the reason is the inclusion of biogenic VOCs in TOOC, the emissions of which are not co-located with those of anthropogenic VOCs. The de-gree of processing of biogenic VOCs cannot be described by a photochemical clock 20
based on anthropogenic VOCs, and this leads to a reduced degree of correlation in the plots of TOOC versus age. The mass loading of organic carbon over the Gulf of Maine is robustly predicted by the photochemical clock (R=0.77), as shown by de Gouw et al. (2005), but this does not appear to be a widespread trend across the measurement platforms examined here. For measurements at large distances from the emission 25
sources (Trinidad Head, BAE aircraft in the Azores, IMPEX) this is not surprising given that the enhancements of hydrocarbons are only small compared to a (variable) back-ground. In addition, cloud processing and precipitation scavenging can decouple the gas and aerosol phases. The measurements of organic carbon reported here
repre-ACPD
7, 17825–17871, 2007 Total Observed Organic Carbon (TOOC) C. L. Heald et al. Title Page Abstract Introduction Conclusions References Tables Figures ◭ ◮ ◭ ◮ Back CloseFull Screen / Esc
Printer-friendly Version Interactive Discussion
EGU sent a wide range of sampling conditions, including observations from mixed sources
and aged air masses which may limit the robustness of the photochemical clock cal-culation (McKeen et al., 1996; Parrish et al., 2007). Consequently, the photochemical clock cannot be used to robustly characterize the evolution of the organic aerosol or the TOOC budget over North America.
5
Figure 6 illustrates some robust relationships seen across all platforms. Concen-trations of gas-phase and particle-phase organic carbon are correlated (Fig. 6a). Air masses are rarely dominated by one phase, and comparison with the 1-to-1 line shows that there are no sites or platforms where the majority of TOOC is in particle phase. The slopes here confirm that the observations in the northeastern United States have 10
the highest proportion of TOOC in the particle phase. The lowest fraction of particulate OC is seen at Pittsburgh and the remote sites; the former is likely a result of proxim-ity to sources and insufficient time for secondary production and the later results from preferential wet removal during transport.
Figure 6b shows that carbon monoxide (CO), traditionally viewed as a tracer of 15
combustion sources, is a good predictor for TOOC concentrations, explaining 46– 86% of the variability. This indicates that the factors which control CO concentra-tions, either sources or plume dilution/mixing, strongly influence TOOC. Recent evi-dence has shown that biogenic sources of secondary CO may be larger than anthro-pogenic sources in the United States during the summer, therefore this relationship 20
does not provide unambiguous evidence of source type for TOOC away from large anthropogenic plumes. The lack of correlation (not shown) between TOOC and sulfur dioxide (SO2) concentrations (with the exception of Asian plumes observed during IM-PEX) does suggest that variability in this source is unlikely to be dominated by power generation. The six datasets which include measurements of acetylene, an unambigu-25
ous tracer of pollution and fire influence (Xiao et al., 2007), show strong correlations between this tracer and TOOC (not shown). Sites and platforms with anthropogenic influence exhibit the largest TOOC/CO slopes (highest values reported near Mexico City); however the routine VOC measurements included in these datasets are also
ACPD
7, 17825–17871, 2007 Total Observed Organic Carbon (TOOC) C. L. Heald et al. Title Page Abstract Introduction Conclusions References Tables Figures ◭ ◮ ◭ ◮ Back CloseFull Screen / Esc
Printer-friendly Version Interactive Discussion most likely to approach total mass closure in fresh air masses. The variability of TOOC
at remote sites is not as well predicted by CO and the TOOC/CO slope is systematically lower. CO is well correlated with both the gas-phase and particle-phase OC across all platforms, but correlation coefficients are highest when the total observed OC budget (TOOC) is considered. This result suggests that the TOOC “family” may be a useful 5
concept for understanding large scale variability in the organic carbon budget.
Organic carbon aerosol concentrations are also correlated with sulfate but to a lesser degree (Fig. 6c). Several factors may contribute to this: common anthropogenic sources or source regions, similar formation mechanisms, shared removal processes and synoptic changes in meteorology. At both Thompson Farm and in Pittsburgh, 10
sulfate is better correlated (R>0.8) with the oxygenated component of organic aerosol than with total organic aerosol concentrations, suggesting that the relationship between sulfate and organic aerosol is not solely driven by primary anthropogenic emissions (Zhang et al., 2005). Sullivan et al. (2006) suggest that the organic carbon aerosol observed in the boundary layer aboard the WP-3 is of secondary anthropogenic origin. 15
Recent laboratory studies (Ng et al., 2007) have demonstrated high SOA yields (30– 37%) from anthropogenic aromatic precursors under low NOxconditions, which could contribute to concentrations downwind of urban regions. Alternatively, the correlation may be driven by similar formation mechanisms for SOA and sulfate, such as aqueous-phase chemistry. (Carlton et al., 2006), shared oxidants, or the co-condensation of 20
secondary inorganic and organic aerosols. Acid catalysed formation is unlikely to ex-plain these correlations (Zhang et al., 2007b; Peltier et al., 2007b). Finally, both or-ganic carbon aerosol and sulfate are subject to wet removal from the atmosphere. The OC/sulfate slopes here are again highest at anthropogenically influenced locations, with the notable exception of summertime sampling during the Pittsburgh Air Quality 25
Study. This is likely due to the generally segregated influences of primary emission and secondary formation at this site, resulting in the least coherent relationship be-tween OC and sulfate across all platforms. The correlation bebe-tween the aerosol organic and sulfur compounds does not extend to the total gas+aerosol concentrations (TOOC
ACPD
7, 17825–17871, 2007 Total Observed Organic Carbon (TOOC) C. L. Heald et al. Title Page Abstract Introduction Conclusions References Tables Figures ◭ ◮ ◭ ◮ Back CloseFull Screen / Esc
Printer-friendly Version Interactive Discussion
EGU vs. SOx≡SO2+sulfate). This suggests that the relationship between sulfate and OC
aerosol is not controlled by common emission sources.
Figure 7 shows a series of biogenic tracers as predictors for TOOC concentra-tions. Methanol as well as isoprene and its oxidation products, formaldehyde (HCHO), methyl vinyl ketone (MVK) and methacrolein (MACR) are important components of 5
the TOOC budget. Therefore to ensure that these relationships are not dominated by self-correlation, we remove the concentration of each compound from TOOC in Fig. 7. These species are not measured at all sites (we do not show isoprene for the remote/marine sites where concentrations never exceed 40 ppt and are therefore close to detection limits), and correlations are weaker than the relationships of Fig. 6; 10
nevertheless, these measurements do support a biogenic variability to TOOC and can explain up to 67% of the observed variance. Correlations are highest with the longest-lived tracer, methanol, whose estimated tropospheric lifetime (∼7 days) is comparable to the lifetime of organic aerosol (Jacob et al., 2005). Despite low overall concentra-tions of methacrolein and MVK at Pittsburgh in summertime, the strong relaconcentra-tionship 15
with TOOC indicates the importance of secondary biogenic oxidation at this location (Fig. 7c), where isoprene is also elevated (Fig. 3).
The anthropogenic sources of methanol (biomass burning, vehicles, solvents and manufacturing) and formaldehyde (anthropogenic VOC oxidation, small primary emis-sions) complicate their interpretation as indicators of biogenic origin. TOOC is best 20
correlated with methanol for several of the more urban environments, and datasets which may include background fire influence, despite the filtering of strong fire plumes (Fig. 7d). In particular, we do not expect biogenic activity to be a significant contributor to TOOC in Mexico City, and especially not so in springtime. Accordingly, TOOC is anti-correlated with isoprene at this location, where isoprene is elevated in remote regions 25
away from urban influence and oxidized in polluted plumes. We attribute the high cor-relation seen between TOOC and HCHO near Mexico City to secondary anthropogenic oxidation, and mobile source emissions (Garcia et al., 2006).
(character-ACPD
7, 17825–17871, 2007 Total Observed Organic Carbon (TOOC) C. L. Heald et al. Title Page Abstract Introduction Conclusions References Tables Figures ◭ ◮ ◭ ◮ Back CloseFull Screen / Esc
Printer-friendly Version Interactive Discussion ized by secondary biogenic oxidation products) were associated with coastal aerosol
growth at Chebogue Point. While such select conditions are characterized by a strong relationship between organic aerosol and biogenic oxidation tracers, the short-lived biogenic oxidation products in this dataset can explain at most 30% (and generally less than 10%) of the variability of organic aerosol over the range of conditions observed. 5
Organic aerosol is well-correlated (not shown) with methanol for the suite of datasets with consistent urban influence (MEX, PAQS, WP3), but explains only 2–32% of the variability of organic aerosol in the more rural environments (CHB, TF, THD, BAE). These datasets therefore suggest that while biogenic activity contributes to the vari-ability of TOOC, there is no evidence that the dominant varivari-ability in organic aerosol 10
observed over North America can be explained by biogenic oxidation sources. This may be due to the relatively short lifetimes of the biogenic tracers measured in these datasets, or it may indicate that the variability of observed organic aerosol is dominated by the loss processes and not the source. We cannot preclude a biogenic source for these aerosols; indeed 14C observations suggest that modern carbon makes up the 15
majority of organic carbon aerosol throughout the rural US (Bench et al., 2007). Weber et al. 2007 have also noted this apparent inconsistency between the high modern frac-tion and correlafrac-tion with anthropogenic tracers of OC aerosol. It may be, however, that anthropogenic pollution in the form of elevated NOx or enhanced oxidation chemistry,
may be a pre-requisite for secondary aerosol formation. 20
4 Future directions
The integration of this set of measurements represents the first attempt to broadly and observationally quantify the organic carbon budget of the troposphere. The prevalence of TOOC across these environments and throughout the depth of the troposphere, as shown here, highlights the need to understand the climate impact of these compounds 25
in particle form (i.e., composition, cloud nucleating, and optical properties) and the relative importance of natural versus anthropogenic sources.
ACPD
7, 17825–17871, 2007 Total Observed Organic Carbon (TOOC) C. L. Heald et al. Title Page Abstract Introduction Conclusions References Tables Figures ◭ ◮ ◭ ◮ Back CloseFull Screen / Esc
Printer-friendly Version Interactive Discussion
EGU Two key questions arise from this analysis. First, how much of the TOC is accounted
for in the TOOC? Secondly, how representative are these observations of the global composition of the atmosphere? A complete description of the ambient evolution of organic carbon from source to sink (and between phases) requires carbon mass clo-sure in the gas and particle phases. There is a critical and urgent need to develop 5
measurement techniques to routinely detect total gas phase VOCs (or total gas plus particle phase OC), the dominant constituents of oxidized gas-phase organic carbon, and semi-volatile species that partition between both phases.
Organic carbon variability in the atmosphere is driven largely by local sources and the photochemical age and deposition lifetime of air masses, the combination of which 10
characterizes diverse observational environments. The observations selected here represent a wide range of sampling conditions. However, the geographical domain of these observations is limited, and additional sampling in the Southern Hemisphere and over significantly different continental environments (for example: Asia, the tropics, the polar regions) is required to present a truly global picture of organic carbon in the 15
atmosphere. Further assessment of the TOOC budget requires a broad and compre-hensive suite of measurements from large-scale field campaigns. It is essential that the main fixed sites or mobile platforms of future field campaigns include as comprehen-sive as possible suite of organic measurements in order to minimize the gap between total observed organic carbon (TOOC) and total organic carbon (TOC), and to further 20
characterize the role of various species in the TOOC budget.
Acknowledgements. This work was supported by the NOAA Postdoctoral Program in
Climate and Global Change, administered by the University Corporation for Atmospheric Research. Field measurements were supported by NOAA (under grants RA133R05SE4459, RA133R04SE0368, NA17RP2632, NA03OAR4600122, NA04OAR4600154 and
25
NA05OAR4600189) NSF (under grants ATM-0449815 and ATM-0513116) and NASA (under grant NNG06GB03G). We thank B. Lerner for providing the CO observations aboard the R/V R. Brown, M. Evans for providing the BAe-146 merged data, R. Cohen and J. Fry for useful discussions and gratefully acknowledge core data from the BAe 146 aircraft provided by the UK Facility for Airborne Atmospheric Measurements.
ACPD
7, 17825–17871, 2007 Total Observed Organic Carbon (TOOC) C. L. Heald et al. Title Page Abstract Introduction Conclusions References Tables Figures ◭ ◮ ◭ ◮ Back CloseFull Screen / Esc
Printer-friendly Version Interactive Discussion
References
Aiken, A. C., DeCarlo, P. F., and Jimenez, J. L.: Elemental analysis of organic species with electron ionization high-resolution mass spectrometry, Anal. Chem., 2007.
Aiken, A. C., Salcedo, D., Ulbrich, I., DeCarlo, P. F., Huffman, J. A., Cubison, M., Docherty, K., Sueper, D., Worsnop, D. R., Trimborn, A. M., Northway, M. J., Wiedinmyer, C., Prevot,
5
A. S. H., Szidat, S., Wehrli, M. N., Wang, J., Zheng, J., Fortner, E., Zhang, R., Molina, L. T., Gaffney, J., Marley, N., Sosa, G., and Jimenez, J. L.: Organic aerosol analysis with the high resolution time-of-flight aerosol mass spectrometer (hr-tof-ams) at t0 in mexico city during milagro/mcma-2006, American Association for Aerosol Research (AAAR) 26th Annual Conference, Reno, NV, 2007.
10
Allan, J. D., Bower, K. N., Coe, H., Boudries, H., Jayne, J. T., Canagaratna, M. R., Millet, D. B., Goldstein, A. H., Quinn, P. K., Weber, R. J., and Worsnop, D. R.: Submicron aerosol compo-sition at Trinidad Head, California, during ITCT 2K2: Its relationship with gas phase volatile organic carbon and assessment of instrument performance, J. Geophys. Res.-Atmos., 109, doi:10.1029/2003JD004208, 2004.
15
Aumont, B., Szopa, S., and Madronich, S.: Modelling the evolution of organic carbon during its gas-phase tropospheric oxidation: Development of an explicit model based on a self generating approach, Atmos. Chem. Phys., 5, 2497–2517, 2005,
http://www.atmos-chem-phys.net/5/2497/2005/.
Bench, G., Fallon, S., Schichtel, B., Malm, W., and McDade, C.: Relative contributions of
20
fossil and contemporary carbon sources to PM2.5 aerosols at nine interagency monitoring for protection of visual environments (improve) network sites, J. Geophys. Res.-Atmos., 112, doi:10.1029/2006JD007708, 2007.
Blake, D. R., Hurst, D. F., Smith, T. W., Whipple, W. J., Chen, T. Y., Blake, N. J., and Rowland, F. S.: Summertime measurements of selected nonmethane hydrocarbons in the arctic and
sub-25
arctic during the 1988 arctic boundary layer expedition (able-3a), J. Geophys. Res.-Atmos., 97, 16 559–16 588, 1992.
Canagaratna, M. R., Jayne, J. T., Jimenez, J. L., Allan, J. D., Alfarra, M. R., Zhang, Q., Onasch, T. B., Drewnick, F., Coe, H., Middlebrook, A., Delia, A., Williams, L. R., Trimborn, A. M., Northway, M. J., DeCarlo, P. F., Kolb, C. E., Davidovits, P., and Worsnop, D. R.:
Chemi-30
cal and microphysical characterization of ambient aerosols with the aerodyne aerosol mass spectrometer, Mass Spectrom. Rev., 26, 185–222, 2007.
ACPD
7, 17825–17871, 2007 Total Observed Organic Carbon (TOOC) C. L. Heald et al. Title Page Abstract Introduction Conclusions References Tables Figures ◭ ◮ ◭ ◮ Back CloseFull Screen / Esc
Printer-friendly Version Interactive Discussion
EGU
Carlton, A. G., Turpin, B. J., Lim, H. J., Altieri, K. E., and Seitzinger, S.: Link between isoprene and secondary organic aerosol (soa): Pyruvic acid oxidation yields low volatility organic acids in clouds, Geophys. Res. Lett., 33, doi:10.1029/2005GL025374, 2006.
Chance, K., Palmer, P. I., Spurr, R. J. D., Martin, R. V., Kurosu, T. P., and Jacob, D. J.: Satellite observations of formaldehyde over north america from gome, Geophys. Res. Lett., 27, 3461–
5
3464, 2000.
Chung, M. Y., Maris, C., Krischke, U., Meller, R., and Paulson, S. E.: An investigation of the relationship between total non-methane organic carbon and the sum of speciated hydrocar-bons and carbonyls measured by standard gc/fid: Measurements in the Los Angeles Air Basin, Atmos. Environ., 37, S159–S170, 2003.
10
Cottrell, L. D., Griffin, R. J., Jimenez, J. L., et al.: Submicron particles at Thompson Farm dur-ing ICARTT measured usdur-ing aerosol mass spectrometry, J. Geophys. Research, accepted, 2007.
de Gouw, J., Warneke, C., Karl, T., Eerdekens, G., van der Veen, C., and Fall, R.: Sensitivity and specificity of atmospheric trace gas detection by proton-transfer-reaction mass spectrometry,
15
Int. J. Mass Spectrom., 223, 365–382, 2003.
de Gouw, J. A., Middlebrook, A. M., Warneke, C., Goldan, P. D., Kuster, W. C., Roberts, J. M., Fehsenfeld, F. C., Worsnop, D. R., Canagaratna, M. R., Pszenny, A. A. P., Keene, W. C., Marchewka, M., Bertman, S. B., and Bates, T. S.: Budget of organic carbon in a polluted atmosphere: Results from the New England Air Quality Study in 2002, J. Geophys.
Res.-20
Atmos., 110, doi:10.1029/2004JD005623, 2005.
de Gouw, J. A., Warneke, C., Stohl, A., Wollny, A. G., Brock, C. A., Cooper, O. R., Holloway, J. S., Trainer, M., Fehsenfeld, F. C., Atlas, E. L., Donnelly, S. G., Stroud, V., and Lueb, A.: Volatile organic compounds composition of merged and aged forest fire plumes from Alaska and western Canada, J. Geophys. Res.-Atmos., 111, doi:10.1029/2005JD006175, 2006.
25
de Gouw, J.A., Brock, C. A., Atlas, E. L., et al.: Sources of Particulate Matter in the Northeastern United States: 1. Direct Emissions and Secondary Formation of Organic Matter in Urban Plumes, J. Geophys. Res., accepted, 2007.
Decesari, S., Mircea, M., Cavalli, F., Fuzzi, S., Moretti, F., Tagliavini, E., and Facchini, M. C.: Source attribution of water-soluble organic aerosol by nuclear magnetic resonance
spec-30
troscopy, Environ. Sci. Technol., 41, 2479–2484, 2007.
Dlugokencky, E. J., Houweling, S., Bruhwiler, L., Masarie, K. A., Lang, P. M., Miller, J. B., and Tans, P. P.: Atmospheric methane levels off: Temporary pause or a new steady-state?,
ACPD
7, 17825–17871, 2007 Total Observed Organic Carbon (TOOC) C. L. Heald et al. Title Page Abstract Introduction Conclusions References Tables Figures ◭ ◮ ◭ ◮ Back CloseFull Screen / Esc
Printer-friendly Version Interactive Discussion
Geophys. Res. Lett., 30, doi:10.1029/2003GL018126, 2003.
Fehsenfeld, F. C., Ancellet, G., Bates, T. S., Goldstein, A. H., Hardesty, R. M., Honrath, R., Law, K. S., Lewis, A. C., Leaitch, R., McKeen, S., Meagher, J., Parrish, D. D., Pszenny, A. A. P., Russell, P. B., Schlager, H., Seinfeld, J., Talbot, R., and Zbinden, R.: International consortium for atmospheric research on transport and transformation (icartt): North
amer-5
ica to europe - overview of the 2004 summer field study, J. Geophys. Res.-Atmos., 111, doi:10.1029/2006JD007829, 2006.
Flocke, F. M., Weinheimer, A. J., Swanson, A. L., Roberts, J. M., Schmitt, R., and Shertz, S.: On the measurement of pans by gas chromatography and electron capture detection, J. Atmos. Chem., 52, 19–43, 2005.
10
Galbally, I. E. and Kirstine, W.: The production of methanol by flowering plants and the global cycle of methanol, J. Atmos. Chem., 43, 195–229, 2002.
Garcia, A. R., Volkamer, R., Molina, L. T., Molina, M. J., Samuelson, J., Mellqvist, J., Galle, B., Herndon, S. C., and Kolb, C. E.: Separation of emitted and photochemical formaldehyde in mexico city using a statistical analysis and a new pair of gas-phase tracers, Atmos. Chem.
15
Phys., 6, 4545–4557, 2006,http://www.atmos-chem-phys.net/6/4545/2006/.
George, I. J., Vlasenko, A., Slowik, J. G., Broekhuizen, K., and Abbatt, J. P. D.: Heterogeneous oxidation of saturated organic aerosols by hydroxyl radicals: Uptake kinetics, condensed-phase products, and particle size change, Atmos. Chem. Phys., 7, 4187–4201, 2007,
http://www.atmos-chem-phys.net/7/4187/2007/.
20
Gilardoni, S., Russell, L. M., Sorooshian, A., Flagan, R. C., Seinfeld, J. H., Bates, T. S., Quinn, P. K., Allan, J. D., Williams, B., Goldstein, A. H., Onasch, T. B., and Worsnop, D. R.: Regional variation of organic functional groups in aerosol particles on four us east coast platforms during the international consortium for atmospheric research on transport and transformation 2004 campaign, J. Geophys. Res.-Atmos., 112, 2007.
25
Goldan, P. D., Kuster, W. C., Williams, E., Murphy, P. C., Fehsenfeld, F. C., and Meagher, J.: Nonmethane hydrocarbon and oxy hydrocarbon measurements during the 2002 new england air quality study, J. Geophys. Res.-Atmos., 109, doi:10.1029/2003JD004455, 2004. Goldstein, A. H., Wofsy, S. C., and Spivakovsky, C. M.: Seasonal variations of nonmethane
hy-drocarbons in rural new england: Constraints on OH concentrations in northern midlatitudes,
30
J. Geophys. Res.-Atmos., 100, 21 023–21 033, 1995.
Goldstein, A. H., Fan, S. M., Goulden, M. L., Munger, J. W., and Wofsy, S. C.: Emissions of ethene, propene, and 1-butene by a midlatitude forest, J. Geophys. Res.-Atmos., 101,
ACPD
7, 17825–17871, 2007 Total Observed Organic Carbon (TOOC) C. L. Heald et al. Title Page Abstract Introduction Conclusions References Tables Figures ◭ ◮ ◭ ◮ Back CloseFull Screen / Esc
Printer-friendly Version Interactive Discussion
EGU
9149–9157, 1996.
Goldstein, A. H., Millet, D. B., McKay, M., Jaegle, L., Horowitz, L., Cooper, O., Hudman, R., Jacob, D. J., Oltmans, S., and Clarke, A.: Impact of asian emissions on obser-vations at Trinidad Head, California, during ITCT 2K2, J. Geophys. Res.-Atmos., 109, doi:10.1029/2003JD004406, 2004.
5
Goldstein, A. H. and Galbally, I. E.: Known and unexplored organic constituents in the earth’s atmosphere, Environ. Sci. Technol., 41, 1514–1521, 2007.
Graedel, T. E., Hawkins, D. T., and Claxton, L. D.: Atmospheric chemical compounds, Academic Press, Orlando, FL, 1986.
Guenther, A., Hewitt, C. N., Erickson, D., Fall, R., Geron, C., Graedel, T., Harley, P., Klinger, L.,
10
Lerdau, M., McKay, W. A., Pierce, T., Scholes, B., Steinbrecher, R., Tallamraju, R., Taylor, J., and Zimmerman, P.: A global model of natural volatile organic compound emissions, J. Geophys. Res.-Atmos., 100, 8873–8892, 1995.
Hamilton, J. F., Webb, P. J., Lewis, A. C., Hopkins, J. R., Smith, S., and Davy, P.: Partially oxidised organic components in urban aerosol using gcxgc-tof/ms, Atmos. Chem. Phys., 4,
15
1279–1290, 2004,http://www.atmos-chem-phys.net/4/1279/2004/.
Harley, R. A., Russell, A. G., McRae, G. J., Cass, G. R., and Seinfeld, J. H.: Photochemical modeling of the southern california air quality study, Environ. Sci. Technol., 27, 378–388, 1993.
Heald, C. L., Jacob, D. J., Park, R. J., Russell, L. M., Huebert, B. J., Seinfeld, J. H., Liao, H., and
20
Weber, R. J.: A large organic aerosol source in the free troposphere missing from current models, Geophys. Res. Lett., 32, doi:10.1029/2005GL023831, 2005.
Heald, C. L., Jacob, D. J., Turquety, S., Hudman, R. C., Weber, R. J., Sullivan, A. P., Peltier, R. E., Atlas, E. L., de Gouw, J. A., Warneke, C., Holloway, J. S., Neuman, J. A., Flocke, F. M., and Seinfeld, J. H.: Concentrations and sources of organic carbon aerosols in the free
25
troposphere over north america, J. Geophys. Res.-Atmos., 111, doi:10.1029/2006JD007705, 2006.
Hearn, J. D. and Smith, G. D.: Reactions and mass spectra of complex particles using aerosol cims, Int. J. Mass Spectrom., 258, 95–103, 2006.
Hirsch, R. M. and Gilroy, E. J.: Methods of fitting a straight line to data: Examples in water
30
resources, Water Resources Bulleton, 20, 705–711, 1984.
Holzinger, R., Millet, D. B., Williams, B., Lee, A., Kreisberg, N., Hering, S. V., Jimenez, J., Allan, J. D., Worsnop, D. R., and Goldstein, A. H.: Emission, oxidation, and secondary organic
ACPD
7, 17825–17871, 2007 Total Observed Organic Carbon (TOOC) C. L. Heald et al. Title Page Abstract Introduction Conclusions References Tables Figures ◭ ◮ ◭ ◮ Back CloseFull Screen / Esc
Printer-friendly Version Interactive Discussion
aerosol formation of volatile organic compounds as observed at chebogue point, nova scotia, J. Geophys. Res.-Atmos., 112, doi:10.1029/2006JD007599, 2007.
Hopkins, J. R., Lewis, A. C., and Read, K. A.: A two-column method for long-term monitoring of non-methane hydrocarbons (nmhcs) and oxygenated volatile organic compounds (o-vocs), J. Environ. Monitor., 5, 8–13, 2003.
5
Hudman, R. C., Murray, L. T., Jacob, D. J., et al.: Anthropogenic and biogenic CO sources over the United States: implication for CO as a tracer of pollution, accepted, 2007.
IPCC: Climate change 2007: The physical science basis, edited by: Solomon, S. e. a., Cam-bridge University Press, CamCam-bridge, UK, 996 pp., 2007.
Jacob, D. J., Field, B. D., Jin, E. M., Bey, I., Li, Q. B., Logan, J. A., Yantosca, R.
10
M., and Singh, H. B.: Atmospheric budget of acetone, J. Geophys. Res.-Atmos., 107, doi:10.1029/2001JD000694, 2002.
Jacob, D. J., Field, B. D., Li, Q. B., Blake, D. R., de Gouw, J., Warneke, C., Hansel, A., Wisthaler, A., Singh, H. B., and Guenther, A.: Global budget of methanol: Constraints from atmospheric observations, J. Geophys. Res.-Atmos., 110, doi:10.1029/2004JD005172, 2005.
15
Jayne, J. T., Leard, D. C., Zhang, X. F., Davidovits, P., Smith, K. A., Kolb, C. E., and Worsnop, D. R.: Development of an aerosol mass spectrometer for size and composition analysis of submicron particles, Aerosol Sci. Technol., 33, 49–70, 2000.
Kanakidou, M., Seinfeld, J. H., Pandis, S. N., Barnes, I., Dentener, F. J., Facchini, M. C., Van Dingenen, R., Ervens, B., Nenes, A., Nielsen, C. J., Swietlicki, E., Putaud, J. P., Balkanski,
20
Y., Fuzzi, S., Horth, J., Moortgat, G. K., Winterhalter, R., Myhre, C. E. L., Tsigaridis, K., Vignati, E., Stephanou, E. G., and Wilson, J.: Organic aerosol and global climate modelling: A review, Atmos. Chem. Phys., 5, 1053–1123, 2005,
http://www.atmos-chem-phys.net/5/1053/2005/.
Kwan, A. J., Crounse, J. D., Clarke, A. D., Shinozuka, Y., Anderson, B. E., Crawford, J. H.,
25
Avery, M. A., McNaughton, C. S., Brune, W. H., Singh, H. B., and Wennberg, P. O.: On the flux of oxygenated volatile organic compounds from organic aerosol oxidation, Geophys. Res. Lett., 33, doi:10.1029/2006GL026144, 2006.
Lamanna, M. S. and Goldstein, A. H.: In situ measurements of c-2-c-10 volatile organic com-pounds above a sierra nevada ponderosa pine plantation, J. Geophys. Res.-Atmos., 104,
30
21 247–21 262, 1999.
Lewis, A. C.: New directions: Novel separation techniques in voc analysis pose new challenges to atmospheric chemistry, Atmos. Environ., 34, 1155–1156, 2000.