HAL Id: hal-03230967
https://hal.sorbonne-universite.fr/hal-03230967
Submitted on 20 May 2021
HAL is a multi-disciplinary open access
archive for the deposit and dissemination of
sci-entific research documents, whether they are
pub-lished or not. The documents may come from
teaching and research institutions in France or
abroad, or from public or private research centers.
L’archive ouverte pluridisciplinaire HAL, est
destinée au dépôt et à la diffusion de documents
scientifiques de niveau recherche, publiés ou non,
émanant des établissements d’enseignement et de
recherche français ou étrangers, des laboratoires
publics ou privés.
phytoplankton blooms and determines their subsequent
vertical export
Emilia Trudnowska, Léo Lacour, Mathieu Ardyna, Andreas Rogge, Jean
Olivier Irisson, Anya Waite, Marcel Babin, Lars Stemmann
To cite this version:
Emilia Trudnowska, Léo Lacour, Mathieu Ardyna, Andreas Rogge, Jean Olivier Irisson, et al..
Ma-rine snow morphology illuminates the evolution of phytoplankton blooms and determines their
sub-sequent vertical export. Nature Communications, Nature Publishing Group, 2021, 12 (1), pp.2816.
�10.1038/s41467-021-22994-4�. �hal-03230967�
Marine snow morphology illuminates the evolution
of phytoplankton blooms and determines their
subsequent vertical export
Emilia Trudnowska
1
✉
, Léo Lacour
2
, Mathieu Ardyna
3,4
, Andreas Rogge
5,6
, Jean Olivier Irisson
4
,
Anya M. Waite
7
, Marcel Babin
2
& Lars Stemmann
4
The organic carbon produced in the ocean’s surface by phytoplankton is either passed
through the food web or exported to the ocean interior as marine snow. The rate and
ef
ficiency of such vertical export strongly depend on the size, structure and shape of
indi-vidual particles, but apart from size, other morphological properties are still not quantitatively
monitored. With the growing number of in situ imaging technologies, there is now a great
possibility to analyze the morphology of individual marine snow. Thus, automated methods
for their classi
fication are urgently needed. Consequently, here we present a simple, objective
categorization method of marine snow into a few ecologically meaningful functional
mor-photypes using
field data from successive phases of the Arctic phytoplankton bloom. The
proposed approach is a promising tool for future studies aiming to integrate the diversity,
composition and morphology of marine snow into our understanding of the biological
carbon pump.
https://doi.org/10.1038/s41467-021-22994-4
OPEN
1Institute of Oceanology Polish Academy of Sciences, Sopot, Poland.2Takuvik Joint International Laboratory (CNRS and Université Laval), Québec, QC,
Canada.3Department of Earth System Science, Stanford University, Stanford, CA, USA.4Sorbonne Université, CNRS, Laboratoire d’Océanographie de
Villefranche, LOV, Villefranche-sur-Mer, France.5Institute for Ecosystem Research, Kiel University, Kiel, Germany.6Alfred Wegener Institute, Helmholtz
Center for Polar and Marine Research, Polar Biological Oceanography Section, Bremerhaven, Germany.7Ocean Frontier Institute and Department of
Oceanography, Dalhousie University, Halifax, Nova Scotia, Canada. ✉email:[email protected]
123456789
O
ne key vector of the biological carbon pump is marine
snow, representing large (>500 µm) particles of detritus
(including zooplankton fecal pellets), organic matter
(remnants and exudates of plankton), inorganic matter, and/or
aggregated mixtures of those
1–5. Changes in both phytoplankton
and zooplankton community structure directly influence the
quantity and composition of marine snow
6,7and thus the efficiency
of the biological carbon pump
8,9. Many previous biogeochemical
models
5,10,11and calculations estimating carbon export, based on
in situ observations
12–14, assumed a
fixed mass to volume
rela-tionship and simple geometry of particles, such as spheres or a
defined fractal dimension. This simplification was necessary because
marine snow is difficult to study due to its fragile nature and
complex morphological characteristics. However, the role and fate of
marine snow in vertical particle
flux are strictly determined by its
key features, including morphology (size, shape, porosity) and
composition (organic, mineral). These features have an impact on
aggregation and disaggregation processes, export rate to the deep
sea, and biological interactions (colonization, feeding) with the
plankton community
2,15–17. Therefore, an objective and universal
method to classify marine snow into functional types represent an
important step forward to understand and follow the pathways of
the biological carbon pump
4,8,18–20, and the deposition of e.g.,
microplastics
21. Although the capacity to detect and enumerate
marine snow in situ has radically improved with the development of
optical methods
22–24, the establishment of distinct, standardized
morphological categories of marine snow remains a methodological
challenge due to their high numbers, vast variety, and smooth
transitions between individual classes. Over the last 10 years, various
optical systems have provided millions of images of plankton and
marine snow, with an average ratio of 1 organism per 100
particles
18,25,26. Some studies have focused on plankton images,
which are less abundant and can be classified into distinct
mor-phological groups
25,27,28. The ability to discriminate between
eco-logically relevant groups of marine snow is still poor
29, even though
it may be critical to incorporate their morphological information
into studies of the spatio-temporal patchiness in plankton
produc-tion and its subsequent export via the biological carbon pump
24,30.
Here we propose an approach in the processing of underwater
images collected by the Underwater Vision Profiler, which database
is already extremely large globally (tens of millions of images) and
growing exponentially. We apply statistical discrimination of
mar-ine snow into morphotypes and study the linkages between their
composition in relation to the dynamics of plankton communities
on the example of two comparable study areas within the Arctic
marginal ice zones (the Baffin Bay and Fram Strait, Fig.
1
) which
are characterized by high productivity
20,31,32and distinct
phyto-plankton bloom phases
19,33,34. We hypothesized that our method
could be used to investigate how the concentration of different
categories of marine snow and their vertical distribution change
during sequential phases of the phytoplankton bloom and how this
could be linked to the carbon export. We compare qualitatively
resolved patterns with more classical analyses including total
con-centration, biovolume, and size distribution of marine snow. We
further discuss the potential of marine snow classification applied to
underwater imaging techniques in order to integrate an ecological
approach for a better understanding of the ocean’s carbon cycle.
Results
Morphotypes of marine snow. Twenty-four morphological
properties of individual marine snow objects (Supplementary
Table 1) representing their size (e.g., area, perimeter), shade
intensity (e.g., mean/median gray level), shape (e.g., symmetry,
elongation), and structure (i.e., homogeneity or heterogeneity,
mostly based on the variability in gray level) were combined to
build a PCA (Principal Component Analysis) space (Fig.
2
). The
k-means clustering applied to the PCA coordinates defined five
marine snow morphotypes. Type 1 comprised dark objects, that
are mostly small (the mean perimeter of 50 pixels ~4 mm),
cir-cular and homogenous (Fig.
2
; Supplementary Table 1). Type 2
consisted of elongated objects, that are medium-sized (the mean
perimeter of 78 pixels ~7 mm) and quite diverse in their
bright-ness (Fig.
2
). Type 3 consisted of
flake-type marine snow,
represented by the small (the mean perimeter of 46 pixels ~4
mm), circular, but bright marine snow. Type 4 represented
fluffy
flocs, that were medium-sized (the mean perimeter of 75 pixels
~7 mm), bright, and had heterogeneous forms. Type 5 consisted
of large (the mean perimeter of 194 pixels ~17 mm), bright,
agglomerated forms of multielement structure (Fig.
2
,
Supple-mentary Table 1). These
five morphotypes were then used to
characterize the distribution and composition of marine snow.
Sea ice-related time series of marine snow morphotypes–Baffin
Bay. In the Baffin Bay, the dynamics of the distribution of specific
morphotypes of marine snow were analyzed according to Open
Water Days (OWD), which aligns stations in relation to ice
conditions. OWD indicates how long the station had been ice-free
before sampling (positive values) or how long after sampling it
took to become ice-free (negative value).
The
first signal of elevated concentrations of marine snow was
observed under the ice (−20 OWD) and significantly increased
around the time of the ice break-up (0 OWD) until reaching the
maximum after 20 days of ice-free conditions (Supplementary
Fig. 1). Increased sizes of marine snow were detected 15 days after
sea ice break-up below depths of 100 m, which were also associated
with less steep size spectra slopes (Supplementary Fig. 1).
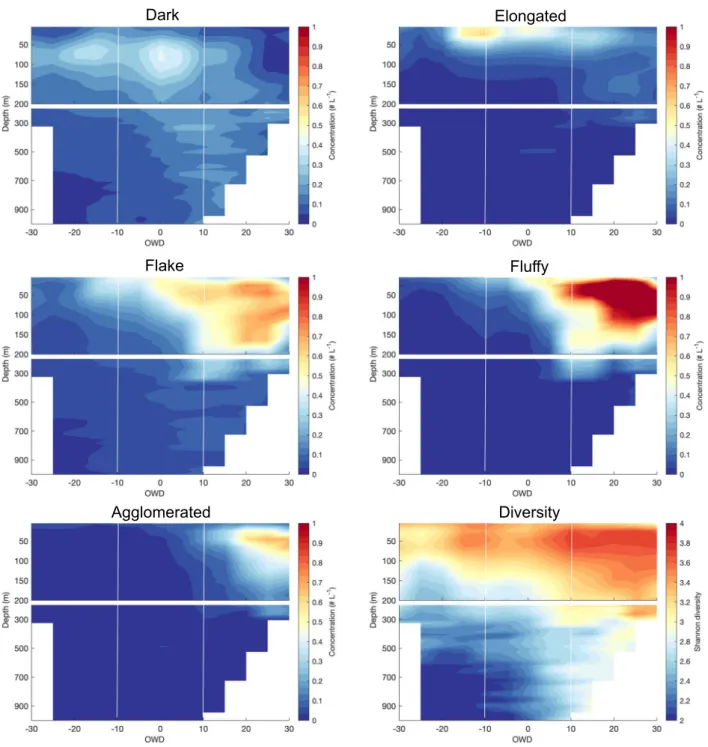
The concentration maximum of dark compact marine snow was
located between 50 and 100 m of the water column before sea ice
break-up, and it deepened successively afterward down to ~1000 m
(Fig.
3
). Throughout the observation period, dark compact particles’
vertical attenuation was the lowest of all marine snow categories,
with visibly more dark compact morphotypes in deep waters at the
end of the bloom (Supplementary Fig. 2). This type of marine
snow-dominated below 100 m until 10 OWD (Supplementary Fig. 3), but
later on they were outnumbered by other morphotypes
(Supple-mentary Fig. 3). The highest concentration of elongated forms of
marine snow was found in the upper 50 m layer throughout the
investigated period, whereas a distinct peak could be observed at
−10 OWD and during sea ice break-up (Fig.
3
, Supplementary
Fig. 3). Their vertical attenuation was the highest among all the
marine snow morphotypes but decreased rapidly after OWD
= 10
(Supplementary Fig. 2). Flake and
fluffy forms of marine snow were
two the most abundant morphotypes in the upper 200 m of ice-free
waters (>0 OWD), but rare under ice-covered conditions (Fig.
3
).
The concentration maximum of large heterogeneous agglomerated
forms of marine snow was observed at the late ice-free phase (>10
OWD), where they were mainly located in subsurface waters
between 20 and 100 m (Fig.
3
). The highest diversity
(Shannon-Wiener index) of marine snow composition was observed within the
upper 100 m until ice break-up, after which it increased also in
deeper waters (300 m before and 500 m after 20 OWD, Fig.
3
).
Sea ice-related time series of the coupling between
phyto-plankton, marine snow, and zooplankton–the Baffin Bay. The
ice-covered period was characterized by particulate matter
con-taining a relatively low concentration of phytoplankton pigments
(<1 mg m
−3), consisting mainly of diatom origin (Fig.
4
A), and
also by a low concentration of marine snow, mainly consisting of
dark, elongated, and
flake morphotypes (Fig.
4
B). With the ice
increased, and diatoms remained the dominant group (Fig.
4
A).
At that time, a pronounced (>0.5 ind.L
−1), but the narrow peak
of elongated marine snow, restricted to the upper 20–30 m layer
appeared (Fig.
4
B). Under ice-free conditions, the contribution of
diatoms decreased, while Phaeocystis bloomed, mainly below 20
m (Fig.
4
A). This change in the dominant group of
phyto-plankton was accompanied by a change in the composition of
marine snow, which at that time was the most variable among the
stations (Supplementary Fig. 4). Dark and elongated
morpho-types, which dominated under the ice and at the ice break-up,
were outnumbered in the ice-free waters by the
fluffy and
agglomerated morphotypes (Fig.
4
B).
The concentration of marine snow drastically exceeded
zooplankton concentrations throughout the study (Fig.
4
C).
During the ice-covered and ice break-up phases, the highest
zooplankton concentrations were observed near the surface, while
Fram Strait
A
C
B
B CFig. 1 Study areas: the Baffin Bay and Fram Strait. A Station locations (stars) with a schematic representation of the main ocean currents (arrows, blue: outflow of Arctic water masses, yellow and orange: inflow of Atlantic water masses). The close-up maps of the particular regions (B: Baffin Bay, C: Fram Strait) present the sampling stations (yellow dots indicate stations used for the associated temperature sections). The mean 15% sea ice concentration limit of the ice edge for June and July are indicated by dark and light gray contour lines, respectively.
PCA2 (20.1%) PCA1 (49.4%) PCA4 (5.6%) PCA3 (11.7%) homogenous structure circularity size brightness elongation symmetry heterogenous structure soft edges homogenous structure
dark elongated flakes fluffy agglomerated
A
B
C
D
E
Baffin Bay Fram Straitdark elongated flake fluffy agglomerated
log(perimeter) circularity
1/mean grey level
kurtosis 2.75 2.50 2.25 2.00 1.75 1.50 1.0 0.75 0.5 0.25 0 250 200 150 100 20 10 0
SIZE SHAPE BRIGHTNESS STRUCTURE
dark elongated flake fluffy agglomerated dark elongated flake fluffy agglomerated dark elongated flake fluffy agglomerated
Fig. 2 Assignation of marine snow into morphotypes. A The PCA morphospace presenting correlations between 24 morphological characteristics of individual marine snow particles (arrows) and their exemplary appearance spread over the 1st and 2nd axes on the left and the 3rd and 4th axes on the right side.B The projection of 1,063,576 marine snow particles in the common morphospace of two sampling regions distinguished by color (blue: Fram Strait, yellow: Baffin Bay). C Categorisation of the marine snow into 5 morphotypes by k-means clustering (color-coded). D Box plots of the median values (size of the boxes present 25th and 75th quartiles, whiskers present distance from the quartile max/min to 1.5 * IQR (inter-quartile range)) of key exemplary morphological properties (perimeter, circularity, 1/grey level, kurtosis of grey level) characterizing 5 morphotypes.E Representation of example images of marine snow in each category morphotype.
they were most abundant at 30 m depth during ice-free
conditions (Supplementary Fig. 5).
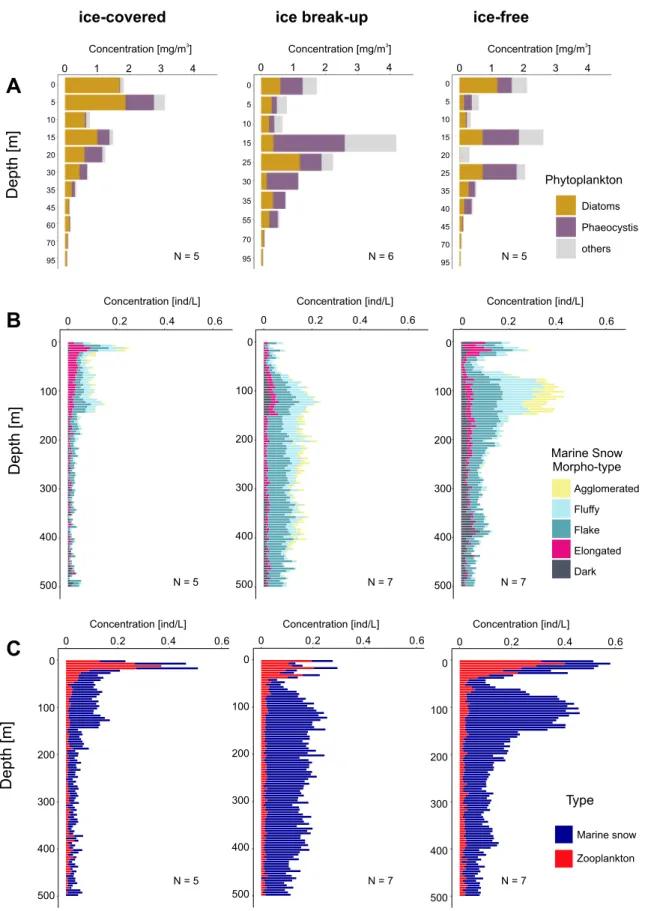
Spatio-temporal coupling between phytoplankton, marine
snow, and zooplankton
–Fram Strait. In Fram Strait, diatom
pigments dominated in the ice-covered phase, and they
co-occurred with Phaeocystis during the ice break-up and ice-free
conditions. Elevated pigment concentrations (>1 mg.m
−3) of
diatoms were observed near the surface, whereas Phaeocystis-type
pigments were observed below 15 m (Fig.
5
A). Generally, low
marine snow concentration, dominated by elongated
morpho-types, was observed under the sea ice and concentrated mainly in
the upper 150 m (Fig.
5
B). Interestingly,
fluffy and agglomerated
marine snow was rather rare but already present under the ice
(Fig.
5
B). At ice break-up, high concentrations of phytoplankton
pigments were accompanied by high concentrations of
zoo-plankton in the upper 50 m, but not by an increase of the marine
snow concentrations (Fig.
5
C). In contrast, high concentrations of
marine snow (appr. 0.4 ind.L
−1), dominated by
flake and fluffy
types, were found below the 50 m surface layer extending
sub-stantially over depth down to 500 m (Fig.
5
B), but with high
intra-station variability (Supplementary Fig. 4). At the ice-free
stations, the still relatively high (>0.5 mg m
−3) concentration of
diatom chl a (Fig.
5
A) corresponded to the surface peak
domi-nated by dark and elongated morphotypes (appr. 50%) in the
upper 50 m (Fig.
5
B), concurrent with the zooplankton
con-centration maximum (Fig.
5
C). The second peak of marine snow
Dark
Elongated
Flake
Fluffy
Agglomerated
Diversity
Fig. 3 Spatio-temporal distribution of marine snow morphotypes. Section plots of the concentration of various morphotypes of marine snow, their diversity (Shannon-Wiener index) over depth and time (open water days (OWD)) in the Baffin Bay. White vertical lines indicate the ranges of assigned periods (under ice, ice break-up, ice-free).
was restricted to between 50 and 150 m, consisting of a mixture of
flake, fluffy, and agglomerated morphotypes. In general,
zoo-plankton contributed a lot to images collected by Underwater
vision profiler (UVP) within the upper 50 m of the water column
in Fram Strait (Fig.
5
C).
Discussion
Since the pioneering work of Alldredge and Silver
1it has been
widely recognized that marine snow consists of aggregated
par-ticles of diverse size and origins, mainly produced by plankton
and brought together by different biological and physical
0 100 200 300 400 500 0 1 2 3 0 100 200 300 400 500 0 1 2 3
Depth
Depth
0 1 2 3 0 100 200 300 400 500 0 100 200 300 400 500 0 1 2 3A
B
C
0 5 10 15 20 25 35 40 45 55 65 75 85 95 0 5 10 15 20 25 30 35 45 50 55 65 75 85 95 0 1 2 3 0 1 2 3Depth
0 100 200 300 400 500 0 1 2 3 0 100 200 300 400 500 0 1 2 3 Agglomerated Fluffy Flake Elongated Dark Marine snow Zooplankton Zooplankton * 10 0 5 10 15 20 25 30 35 40 45 50 55 65 77 75 95 Diatoms Phaeocystis others 0 1 2 3 Marine Snow Morpho-type Concentration [ind/L] Concentration [ind/L] Concentration [ind/L]Concentration [ind/L] Concentration [ind/L] Concentration [ind/L]
3 3 3
Concentration [mg/m ] Concentration [mg/m ] Concentration [mg/m ]
ice-covered ice break-up ice-free
Phytoplankton
N = 54 N =24 N = 42 N = 16 N =25 N = 15
N = 54 N =24 N = 42
Fig. 4 Coupling between phytoplankton, marine snow morphotypes, and zooplankton among periods over defined sea ice coverage phases: ice-covered (pre-bloom), ice break-up (bloom), ice-free (late bloom) in the Baffin Bay. A Pigment concentrations of dominant phytoplankton groups. B cumulative concentrations of different marine snow morphotypes. C total concentrations of marine snow and zooplankton. The red line highlights the distribution of zooplankton (the concentration multiplied by 10).
processes
18. The extreme variability in their nature, size, porosity,
elemental composition, and spatio-temporal dynamics makes it a
huge methodological challenge to observe and quantify them
objectively.
Previous
studies
that
applied
marine
snow
catchers
35,36, gel-filled sediment traps
37,38in situ, or mesocosm
experiments
7revealed essential features of marine snow
mor-phological attributes and biogeochemical content. However, those
investigations presented a rather low spatial or temporal
0 0.2 0.4 0.6 0 100 200 300 400 500
Depth [m]
0 0.2 0.4 0.6 0 100 200 300 400 500 0 0.2 0.4 0.6 0 100 200 300 400 500 0 0.2 0.4 0.6 0 0.2 0.4 0.6 0 0.2 0.4 0.6 0 100 200 300 400 500 0 100 200 300 400 500 0 100 200 300 400 500Depth [m]
Concentration [ind/L] Concentration [ind/L] Concentration [ind/L]
Marine snow Zooplankton
A
B
C
Agglomerated Fluffy Flake Elongated Dark Diatoms Phaeocystis others 0 5 10 15 20 30 35 45 60 70 95 0 5 10 15 25 30 35 55 70 95 0 5 10 15 20 25 35 40 45 70 95 0 1 2 3 4 0 1 2 3 4 0 1 2 3 4 Marine Snow Morpho-type PhytoplanktonConcentration [ind/L] Concentration [ind/L] Concentration [ind/L]
3 3 3
Concentration [mg/m ] Concentration [mg/m ] Concentration [mg/m ]
Depth [m]
N = 5 N = 7 N = 7
N = 5 N = 7 N = 7 N = 5 N = 6 N = 5
ice-covered ice break-up ice-free
Fig. 5 Coupling between phytoplankton, marine snow morphotypes, and zooplankton among periods over defined sea ice coverage phases in Fram Strait. A Pigment concentrations of dominant phytoplankton groups. B Cumulative concentrations of the different marine snow morphotypes. C Total concentrations of marine snow and zooplankton.
resolution, as could focus only on a limited amount of objects.
Other in situ sensors such as laser counters
39,40, coulter
counters
41,42, or cameras
22,24have been used extensively to
address spatial and temporal particle dynamics, but without
taking their structural properties into account, aggregating all
morphotypes of marine snow in one detritus compartment
resolved by size
18. Although size is not always directly correlated
with the sinking velocity of marine snow
43, most studies were
neglecting other morphological attributes. Here we present that
advanced in situ imaging techniques enable us to analyze also
many other morphological properties of marine snow, including
their shapes, darkness, and structural heterogeneity.
To do this, we created an approach for the robust classification
of marine snow into several ecologically meaningful categories,
based on a set of individual morphological attributes of single
marine snow images. We then questioned whether such
quali-tative marine snow analysis could provide a better understanding
of particulate dynamics during different stages of phytoplankton
blooms than by analyzing size-related metrics alone.
The classification of marine snow into morphotypes was based
on several methodological choices available from the many
pos-sible options considered. Our choices were motivated partly by
the practicality of the computation (with millions of objects) and
furthermore by the interpretability of the results. And so the
decision fell on the number and type of morphological properties
(24 properties presented in Supplementary Table 1), PCA as the
dimension reduction, and k-means as the clustering algorithm.
For example, we chose a rather low number of categories (five:
dark, elongated,
flake, fluffy, and agglomerated) to facilitate
ecological interpretation, while retaining enough detail and
avoiding hindering the perception of compositional change.
Defining categories of marine snow is even more difficult and less
objective than for plankton taxa, because of the continuity in their
morphological attributes and the infinite variability of forms that
may be embodied. Therefore, no classification scheme will be able
to create groups of well-defined types of marine snow that all look
alike; rather they will create groups that each contain a fairly wide
variety of forms but that still share some common characteristics.
Here, Arctic phytoplankton bloom and its successive phases in
the Baffin Bay gave us an initial context to train the classification
scheme and assess its scientific relevance. The data from Fram
Strait was used to test our classification scheme and its ecological
interpretation within an analogous process. Inter-rater reliability
analysis showed that the classification into morphotypes was very
robust to changes in the dataset used.
The origin of specific morphotypes of marine snow was
determined based on both a priori knowledge of the bloom
dynamics in studied regions and on the concurrent datasets of
oceanographic variables related to the ice retreat and
phyto-plankton composition (HPLC, microscopy).
The potential origin of the dark morphotype can be very broad.
In the upper layers of the ice-covered stations, they were formed
in association with ice algae, which, when accumulated under the
sea ice
44–47tend to aggregate and become metabolically less
active
48. During sea ice break-up, the release of ice algae into the
underlying water increased the concentration of this morphotype
rapidly (Fig.
3
). Their constant presence, regardless of the
phy-toplankton bloom phase and depth layer (Figs.
4
and
5
), indicate
that they may also represent other objects such as fecal pellets
and/or fragments of such and larger aggregates
15,36. As they were
a dominant morphotype of marine snow in the deeper layers,
they are likely also to represent old
49, fragmented or densified
objects, as compactness is increasing with depth
50. Even though
marine snow undergoes a myriad of transformations when
set-tling down, our observations show that it mostly ends up in form
of the dark morphotype in the deep ocean.
The distribution of the concentration peaks of dark
morpho-type was clearly associated with the steepest size spectra slopes
(indicating the prevailing role of the smallest objects) from the
surface to 900 m depth (Fig.
3
and Supplementary Fig. 1).
Assuming they were produced in large quantities at ice break-up
at the surface and observing them at a depth of 900 m 10 days
later, an estimated maximum sinking speed of about 90 m.d
−1can be inferred
23. This clearly shows how the signal of
spatio-temporal patchiness in plankton production may be efficiently
transferred to the deep and form the
‘particle injection pump’
4. A
type I linear regression of time of the maximum concentration
signal (dependent variable) vs. depth (independent variable)
yielded an average sinking rate estimate of 38 m.d
−1(Supple-mentary Fig. 6)). This rough estimate is of the same order of
magnitude as sinking speeds calculated using similar optical
methods during the spring bloom in the Mediterranean Sea
(estimated as 30 and 40 m d
−1for 0.5–1 mm and >1 mm
aggregates, respectively)
51and lower than the rate of export
pulses during the evolution of the sub-polar North Atlantic spring
bloom (~74 m d
−1(52)), or episodic sedimentation events in
the upwelling system off California (mean 75 m d
−1, median
59 m d
−1(53)).
The source of the elongated morphotypes is also difficult to
discriminate explicitly. Their appearance is similar to diatom
chains and indeed they matched with the presence of diatoms
either under the ice in Fram Strait
54or at the ice break-up in
Baffin Bay
55(Supplementary Fig. 2). They may also embody fecal
pellets, as their distribution was spatially aligned with the
zoo-plankton distribution (Supplementary Fig. 5), especially in Fram
Strait (Fig.
5
), where the younger life stages of Calanus spp. are
dominant at that time
56,57and could benefit from the bloom by
intensive feeding. The elongated morpho-types can also represent
colonies of phytoplankton, or various
filaments, or tentacles of
cnidarians. Those elongated forms apparently do not sink
effi-ciently, since they were found mostly in the upper 100 m. Sinking
speeds calculated following the depth distribution and time of
their peaks (average of 7.2 m d
−1Supplementary Fig. 6) are much
lower than the sinking rates of dark morphotypes. It is possible
that they are not settling as elongated forms, but become
frag-mented into the dark categories or aggregated into the
flake,
fluffy, or agglomerated morphotypes (starting to accumulate at
ice break-up and peaking in ice-free phase) (Fig.
3
;
Supplemen-tary Fig. 2).
Flake and
fluffy morphotypes are representatives of typically
perceived
“marine snow”, appearing as rather circular and light
flocks. They were numerically dominant in ice-free waters of both
Baffin Bay and Fram Strait during the late bloom phase, which
was associated with the accumulation of phytoplankton
biomass
58and change in marine snow composition
55,54.
Flake-type marine snow can be the precursors of the
fluffy forms, which
are created when the bloom is massive enough to enhance
aggregation. These, together with the large heterogeneous
agglomerated category (peaking in ice-free conditions) were
associated with the increasing importance of Phaeocystis as the
bloom progressed (Supplementary Fig. 5). The formation of
agglomerated morphotype of marine snow was likely greatly
enhanced by exopolymeric polysaccharides produced by
Phaeo-cystis when forming mucilaginous colonies
50,59. The increased
stickiness of such aggregates can play a
‘cleaning’ role in the water
column, by scavenging smaller particles while settling
2,60,61,
resulting in a large size and heterogeneous structure
62. This may
be the reason why the Phaeocystis—origin marine snow could
also be found at great depths. The short time span of their
observation late in the bloom prevented the estimate of their
settling speed as for the two other categories (Supplementary
Fig. 6). However, all three categories developed their sub-surface
peak at 50 m after ice break-up and then extended to 300 m depth
during the late bloom phase in ice-free waters with a strong depth
attenuation suggesting their slow settling. Because the dark
morphotype, which is mostly small and compact had a
five times
higher estimated sinking speed than the larger elongated type
(Supplementary Fig. 6), we can conclude that size is not always
the dominant factor driving particle settling speed and that
composition, compactness, and density have also to be taken into
account
43. Such morphologically-driven differences in settling
speeds impact the vertical attenuation of marine snow particles,
which can be summarized as the exponent
“b” in the Martin
Curve
63. The dark morphotype showed the lowest attenuation,
while the elongated forms had the highest values (Supplementary
Fig. 2). By contrast, b values calculated from the vertical profile of
total concentrations were more stable over time and did not
reflect the high variability between morphotypes. The fact that the
attenuation of specific morphotypes differed from the average is a
further argument pointing towards the additional value of marine
snow classification into specific categories. The observed temporal
pattern of each morphotype (the appearance and increasing/
decreasing trends observed in Fig.
3
) was consistent with the
temporal pattern of each group’s vertical attenuation and the
resulting concentrations at 100 m (N
100observed in
Supple-mentary Fig. 2). According to our results the composition of
marine snow may change clearly over depth (e.g., the shift from
the diversified composition in the upper 100–150 m to the clear
dominance of dark morphotype in the deepest layers). All these
indicate that our method is a major step forward in our capacity
to depict complex marine snow dynamics compared to the more
classical, size-based approach. Thus, developing a generic
classi-fication approach and improved algorithms to calculate mass and
flux, which take also morphological properties into account will
be promising tools for our understanding and quantification of
the biological carbon pump.
In both the Baffin Bay and Fram Strait, the classical Arctic
bloom
succession,
from
diatom-dominated
to
flagellate-dominated communities
59,64–67, was clearly accompanied by
changes in the morphology and composition of marine snow. We
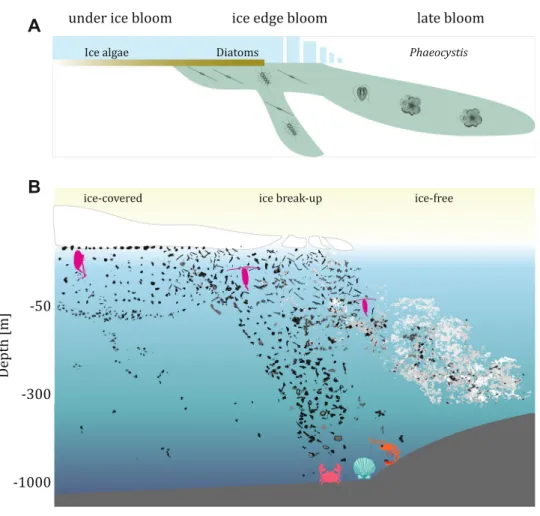
therefore can extend the traditional scheme of the Arctic
phyto-plankton bloom phenology (Fig.
6
A) with a conceptual scheme of
the developmental phases of marine snow composition (Fig.
6
B).
By following the changes in marine snow morphology, we
could observe that the
first, sea ice-covered phase, was
char-acterized by low concentrations and thus low export of marine
snow, mainly composed of the dark, compact morphotype in
Baffin Bay and elongated forms in Fram Strait. At the time of sea
ice break-up, not only increased marine snow concentration but
also diversity could be observed (Fig.
6
). Although previous
stu-dies suggest that the diversity of marine snow is rather low (e.g.,
95% represented by the same type
68), the bloom at the ice
break-up phase was accompanied by a mixture of many categories of
marine snow. In the late bloom phase that was observed in
ice-free waters, large agglomerated forms of marine snow were
observed in both campaigns in the form of massive sub-surface
peaks. The relatively deep location of concentration peaks of
those heterogeneous agglomerates points towards their effective
sinking or towards their association with Atlantic waters
69,70,
which lay below the surface, Polar Waters. Because in both study
regions, the succession of phytoplankton was connected with
different hydrographical regimes: the observed differences in
marine snow composition may also reflect the differences in the
ecological states of particular water masses
58,54,71,72.
With the increasing number of in situ imaging technologies,
there is an urgent need for classification methods for marine
particles and plankton. Plankton classification has been developed
in numerous studies, both for the development of classification
algorithms
29,73–75and for retrieving ecological dynamics from
imaging datasets
76–79. In contrast, marine snow classification has
not been addressed quantitatively, although analysis of marine
snow dynamics remains fundamental for building an
under-standing of trophic interactions and carbon sequestration. Our
proposed classification of marine snow into several ecologically
meaningful morphotypes represents a useful approach to better
understand sources and sinks of plankton material and provides
data about structural features of marine snow that would not be
possible using size distribution analysis. Direct and immediate
digitalization of particles and plankton, accompanied by
com-putational methods for object classification enables fast data
processing, which may assist in defining sampling strategies
during cruises in almost real-time. It also opens a new avenue for
monitoring the high-frequency spatio-temporal patchiness of the
pelagic realm by autonomous devices, such as moorings and sea
gliders
80.
However, unlike plankton classification, which benefits from
externally-defined taxonomy, with clear distinctions between
taxa, the classification of marine snow must address a continuous
variation of properties and encompass a mixture of diversely
sourced particles. Furthermore, we cannot make explicit
recog-nition of the origin (content) of individual marine snow, since
they are not collected. But in turn, one may set a question
whe-ther we actually need to know it. Developing new algorithms
calculating sinking speed by considering not only size but also
image-derived porosity or density would be a considerable
improvement in estimating
flux from in situ images, which, for
the moment, solely relies on size
24,30). Furthermore, we consider
that similar to what was recognized for plankton
79,81,82, the
morphological trait-based approach should be informative and
complementary to other approaches to assess and model a variety
of ocean processes. Moreover, one important advantage of the
classification we proposed is that it is based on deterministic
morphological features, easily assessed and compared across
systems. The challenge relies on building training sets
repre-sentative of most existing morphotypes. This challenge may be
resolved by an augmented observation effort
22,83.
At this state, the typology we propose is only valid for
eco-system dynamics restricted to a given time and place
(phyto-plankton bloom at the Arctic ice edge). The high degree of
compatibility between morpho-spaces created for two
indepen-dent datasets suggests that the addition of new data from blooms
with similar phytoplankton succession in other open ocean Arctic
regions should not radically change the classification system.
However, adding new datasets from other ecosystems in the
Arctic (e.g., fjords submitted to mineral particle injection from
glaciers and rivers), other locations across the world (e.g., tropical
regions dominated by picophytoplankton), or other seasons
would likely allow the identification of more categories of marine
snow. Although we have not captured the full range of possible
marine snow morphotypes present in the oceans, the ability to
distinguish them is evident in our results and is a promising
avenue for a worldwide marine snow classification based on
underwater images. A future compilation of worldwide UVP
datasets would provide better insight into how many
combina-tions of morphotypes can be distinguished and interpreted
globally and whether marine snow differs drastically among
regions, or is rather uniform because it undergoes similar
mod-ification processes. As the modmod-ifications of marine snow
mor-phology are so spectacular over time and depth, one ultimate
perspective resulting from the use of the method presented would
be the definition of a ‘transformation function’ between various
morphotypes.
Because billions of images will be collected in the coming years,
the extensive list of potential scientific outcomes enabled by this
method should motivate future efforts to further develop and
implement objective marine snow classifications. The possibility
to gain qualitative information on each individual marine snow
particle in its natural environment, to identify it, and to retrieve
its ecological role in trophic webs and carbon sequestration is the
most important step forward we have taken. For future studies,
we recommend broadening the perspectives of the selected
morphotypes interpretations, extending the
‘taxonomical’ catalog
of possible types of marine snow, and expanding it over other
regions and processes.
Methods
Sampling locations. Two separate research programs were conducted in June–July 2016.
As part of the GreenEdge project, the CCGS Amundsen icebreaker sampled 164 stations along east–west transects by following the sea-ice retreat in the Baffin Bay (Fig.1). The Baffin Bay is a deep-water basin connected to the Arctic Ocean
through three straits: Lancaster Sound, Jones Sound, and Nares Strait. It is covered by sea ice during winter; it becomes completely ice-free only in July. Between these two situations, there is a marginal ice zone present in this area for most of the year. The Baffin Bay is characterized by intense hydrographic gradients caused by interactions between the northward-flowing relatively warm current from the North Atlantic (West Greenland Current) and the colder southwardflowing current from the Arctic (Baffin Current)58(Fig.1).
As part of the FRAM project (Frontiers in Arctic marine Monitoring, Long-Term Ecological Research LTER Hausgarten), Fram Strait was sampled at 26 stations (Fig.1) from the RV Polarstern. Fram Strait is the only deep gateway into the Arctic basin and a crucial passage of warm Atlantic water advection into the Arctic Ocean84. It is also characterized by complex hydrography driven by the
interaction between the northward-flowing Atlantic waters of the West Spitsbergen
Current and the southwardflowing Arctic waters of the East Greenland Current that results in strong mesoscale dynamics and intense formation of eddies85.
Because of the increased transport of warm water by the West Spitsbergen Current (WSC) in recent years, the ice extent in the Svalbard region has been rapidly declining86.
Grouping sampling time into phases according to sea ice position. A value of Open Water Days (OWD) was ascribed to each station of the Baffin Bay campaign, based on how long it had been ice-free before sampling (positive value) or how long after sampling it took to become ice-free (negative value), following the approach applied to the same dataset by Randelhoff et al.58. Because OWD
cor-related clearly with distance to the ice edge (R= 0.88), binning and arranging stations according to their OWD enabled us to treat it as the spatial distance relative to the ice coverage.
In Baffin Bay, the dataset was then divided into three phases according to the sea ice conditions based on OWD. The ice-covered period comprised 54 stations that were located under the sea ice (<−10 OWD), in the deeper, Arctic-water-influenced western part of Baffin Bay. The ice break-up period included 24 stations that were within 10 days of the ice break-up (10 days before to 10 days after). The ice-free period included 42 stations that were in open waters for more than 10 days and were located mostly in the eastern shallower part of the Baffin Bay, which is largely influenced by Atlantic water.
Stations in the Fram Strait were divided following a similar time-for-space approach into three different phases determined by ice conditions and timing. The ice-covered phase included 5 stations located in the East Greenland Current domain. Ice break-up phase included 7 stations in the core of the West Spitsbergen Current when it was still the ice edge zone (June 25th to 29th). The ice-free phase included the same stations, but sampled two weeks later (July 6th to 7th), when the ice had disappeared.
The time-for-space approach, although advantageous in terms of data analysis, could involve some caveats, mostly due to the impact of different ocean currents on two sides of the studied areas. In both regions, the differences in the composition of marine snow between eastern and western stations could be amplified by the fact
-50
-300
-1000
Depth [m]
under ice bloom ice edge bloom late bloom
Ice algae Diatoms Phaeocystis
ice-covered ice break-up ice-free
A
B
Fig. 6 Conceptual schemes of the phases of the Arctic ice-associated phytoplankton bloom dynamics extended by the corresponding morphological changes of marine snow. The exemplary marine snow images assessed by the UVP (Underwater Vision Profiler) are presented over various phases of the Arctic phytoplankton bloom.A Conceptual scheme of the stages of the Arctic phytoplankton bloom. B Conceptual scheme of the corresponding modification in marine snow composition.
that occupying them two different water mass regimes (Arctic and Atlantic domains) could represent different phenological states of phytoplankton bloom54,58,71. To assess this possible bias, the same analysis was performed
independently in both water masses. The overall composition of the marine snow was similar, regardless if based on data from two jointed water masses, or only on Atlantic water mass alone (Supplementary Fig. 7).
Phytoplankton community composition. Relative abundances of distinct algal groups expressed in terms of chl a were estimated from in situ pigment mea-surements processed using the CHEMTAX algorithm87. The CHEMTAX software
is based on a factorization program that uses“best guess” ratios of accessory pigments to chl a for each phytoplankton taxa. These ratios are based on marker pigment concentrations of algal groups that are known to be present in the Arctic Ocean86. The methodology of assigning pigment ratios for specific taxa was
explained elsewhere70. The phytoplankton composition was additionally verified by
microscopic identifications54,55.
Underwater vision profiler. Images were collected using the most recent version of the high definition and high-frequency Underwater Vision Profiler (UVP 5hd; Hydroptic, France)26. The UVP system detects and counts all objects larger than
~100 µm in a defined and illuminated volume of ~1 L, and automatically stores cut-out vignettes of objects >80 pixels (from approximately 500 µm to a maximum of 200 mm). Particles imaged by the UVP encompass all types of particles from specific ones (e.g., fecal pellets) to very complex ones such as aggregates composed of a mixture of sources (phytoplankton and zooplankton detritus, minerals). For this study, the UVP was mounted onto the carrousel water sampler that also carried a conductivity, temperature, and depth sensor (CTD; SBE 911plus, Seabird Scientific, USA). The acquisition frequency was up to 20 Hz; the carrousel water sampler was lowered with a descent speed of up to 1 m s−1.
Morphological properties of marine snow. The dataset consisted of 24 mor-phological properties of more than one million images of marine snow. Images were individually classified in the EcoTaxa web application ( https://ecotaxa.obs-vlfr.fr/), with the assistance of machine learning classifiers; this classification
dis-tinguished non-living (assigned as marine snow) from living (assigned as zoo-plankton) forms and was fully validated manually. Morphological properties of individual marine snow objects (Supplementary Table 1), representing size (e.g., area, perimeter), shade intensity (e.g., mean/median gray value), shape (e.g., symmetry, elongation), and structural complexity (i.e., homogeneity or hetero-geneity, mostly of gray levels) were selected and analyzed.
After trimming the 0.1% most extreme values for each measurement to eliminate outliers and logarithmic transformation of some variables to remove skewness, the combination of those properties was used to build a Principal Component Analysis (PCA) space. PCA analysis was chosen to summarize and hierarchize the morphological information contained in the original multivariate data into few new variables (the principal components) while retaining the interpretability of those components in relation to the original variables. Thefirst 4 components of the PCA space together explained 87% of total variation (Fig.2). PCA was analyzed via“FactoMineR” and “factoextra” packages in R.
After PCA, each marine snow object was defined by its 4 coordinates in this new morphological space. The k-means clustering method was applied to these PCA coordinates in order to distinguish separate morphotypes of marine snow. K-means classifies objects into a pre-specified number of clusters, such that objects within the same cluster are as similar as possible (i.e., high intra-class similarity), whereas objects from different clusters are as dissimilar as possible (i.e., low inter-class similarity. Using this method we distinguishedfive types of marine snow (Fig.2).
To verify the reproducibility of the method, we defined the morphospace and clusters on (a) Baffin Bay data only, (b) Fram Strait data only, and (c) both (Supplementary Fig. 8); then we classified all objects from both locations according to a, b, and c and compared their cluster membership with Inter-Rater Reliability Analyses (Cohen’s Kappa and agreement test, implemented in the “irr” package in R. The agreement between the classification based on both campaigns and each single campaign dataset was highly significant (99.3%, k = 0.991, p < 0.001 for the test, when the Baffin Bay was the training set and the Fram Strait dataset was predicted and 92.9% of agreement, k= 0.905, p < 0.001 when reversed, i.e., Fram Strait as training dataset and the Baffin Bay as predicted). Moreover, we did the same for two predicted datasets, independent from the original, 2-campaigns based classification and again, the agreement of classifying particular particles into their types between various datasets was highly significant (92.2%, k = 0.898, p < 0.001). To quantify the morphological diversity of marine snow particles during the various ice phases studied, the Shannon-Wiener diversity index was computed from concentrations in each cluster treated as‘species’ in the usual formula (package“vegan” in R). Marine snow assemblages dominated by one type would be characterized by low diversity, whereas high diversity corresponds to assemblages where the marine snow is evenly spread among all types. To test the sensitivity of the results to the choice of 5 categories, additional k-means clustering was performed to extract 25, 50, 100 clusters from the morpho-space and the diversity
index was recomputed. Conclusions were the same no matter the number of clusters.
The marine snow concentrations were binned over 5-m depth intervals and calculated as the count of particles divided by the water volume sampled (on average 112 L per bin). To compare our approach with more classical descriptions, other indicators of particle dynamics were calculated: total concentration, total equivalent spherical volume, and the slope of the size spectrum. The slope (a) of the particle-size spectrum was calculated from ln(n)*ln(a) + b ln(d), where n is the number of particles in a given size bin and d the equivalent spherical diameter of the center of the bin. The vertical attenuation of particle concentration with depth (over the depth range 0-500 m) was quantified by a power law, analogous to the equation used by Martin et al.63to describeflux attenuation, nz = n100*zb/z100),
where z is depth, z100is the referenced depth (taken as 100 m) and nzis the
concentration of particles at depth z (n100is the concentration at 100 m); the
exponent b quantifies attenuation with depth. Fluxes could not be calculated because of the lack of information about the density and porosity of the different particle types. However, bulk sinking rates of thefive categories were calculated from the deepening of the peak through time23,51,52,88.
Data availability
The UVP data that support thefindings of this study can be acquired from the corresponding author on request and browsed on EcoTaxa (BaffinBay data:https:// ecotaxa.obs-vlfr.fr/prj/149; Fram Strait data:https://ecotaxa.obs-vlfr.fr/prj/257). Background data from Baffin Bay is accessible at the GreenEdge database (http://www. obs.vlfr.fr/proof/php/GREENEDGE/greenedge.php). Background data from Fram Strait is available at the PANGEA database (https://doi.pangaea.de/10.1594/
PANGAEA.894874,https://doi.pangaea.de/10.1594/PANGAEA.865180,https://doi. pangaea.de/10.1594/PANGAEA.871949).
Code availability
The code to build the morphospace from UVP measurements and display examples of images onto is provided athttps://github.com/jiho/morphr.
Received: 30 June 2020; Accepted: 8 April 2021;
References
1. Alldredge, A. L. & Silver, M. W. Characteristics, dynamics and significance of marine snow. Prog. Oceanogr. 20, 41–82 (1988).
2. Burd, A. B. & Jackson, G. A. Particle aggregation. Ann. Rev. Mar. Sci. 1, 65–90 (2009).
3. Turner, J. T. Zooplankton fecal pellets, marine snow, phytodetritus and the ocean’s biological pump. Prog. Oceanogr. 130, 205–248 (2015).
4. Boyd, P. W., Claustre, H., Levy, M., Siegel, D. A. & Weber, T. Multi-faceted particle pumps drive carbon sequestration in the ocean. Nature 568, 327–335 (2019).
5. Omand, M. M., Govindarajan, R., He, J. & Mahadevan, A. Sinkingflux of particulate organic matter in the oceans: Sensitivity to particle characteristics. Sci. Rep. 10, 1–16 (2020).
6. Tréguer, P. et al. Influence of diatom diversity on the ocean biological carbon pump. Nat. Geosci. 11, 27–37 (2018).
7. Bach, L. T. et al. The Influence of plankton community structure on sinking velocity and remineralization rate of marine aggregates. Glob. Biogeochem. Cycles 33, 971–994 (2019).
8. Francois, R., Honjo, S., Krishfield, R. & Manganini, S. Factors controlling the flux of organic carbon to the bathypelagic zone of the ocean. Glob. Biogeochem. Cycles 16, 34-1–34–20 (2002).
9. Wiedmann, I. et al. Arctic observations identify phytoplankton community composition as driver of carbonflux attenuation. Geophys. Res. Lett. 47, 1–10 (2020).
10. Kriest, I., Oschlies, A. & Khatiwala, S. Sensitivity analysis of simple global marine biogeochemical models. Glob. Biogeochem. Cycles 26, 1–15 (2012). 11. Stemmann, L., Jackson, G. A. & Ianson, D. A vertical model of particle size
distributions andfluxes in the midwater column that includes biological and physical processes-Part I: model formulation. Deep. Res. Part I 51, 865–884 (2004).
12. Stemmann, L., Jackson, G. A. & Gorsky, G. A vertical model of particle size distributions andfluxes in the midwater column that includes biological and physical processes-Part II: application to a three year survey in the NW Mediterranean Sea. Deep. Res. Part I Oceanogr. Res. Pap. 51, 885–908 (2004). 13. Kiko, R. et al. Biological and physical influences on marine snowfall at the
equator. Nat. Geosci. 10, 852–858 (2017).
14. Guidi, L. et al. Plankton networks driving carbon export in the oligotrophic ocean. Nature 532, 465–470 (2016).
15. Kiørboe, T. Formation and fate of marine snow: small-scale processes with large-scale implications. Sci. Mar. 65, 57–71 (2001).
16. Kiørboe, T., Lundsgaard, C., Olesen, M. & Hansen, J. L. S. Aggregation and sedimentation processes during a spring phytoplankton bloom: afield experiment to test coagulation theory. J. Mar. Res. 52, 297–323 (1994). 17. Jackson, G. A. & Burd, A. B. Simulating aggregate dynamics in ocean
biogeochemical models. Prog. Oceanogr. 133, 55–65 (2015).
18. Stemmann, L. & Boss, E. Plankton and particle size and packaging: from determining optical properties to driving the biological pump. Ann. Rev. Mar. Sci. 4, 263–290 (2012).
19. Laurenceau-Cornec, E. C., Trull, T. W., Davies, D. M., De La Rocha, C. L. & Blain, S. Phytoplankton morphology controls on marine snow sinking velocity. Mar. Ecol. Prog. Ser. 520, 35–56 (2015).
20. Le Moigne, F. A. C. et al. Carbon export efficiency and phytoplankton community composition in the Atlantic sector of the Arctic Ocean. J. Geophys. Res. Ocean. 120, 3896–3912 (2015).
21. Kvale, K. F., Friederike Prowe, A. E. & Oschlies, A. A critical examination of the role of marine snow and zooplankton fecal pellets in removing ocean surface microplastic. Front. Mar. Sci. 6, 1–8 (2020).
22. Lombard, F. et al. Globally consistent quantitative observations of planktonic ecosystems. Front. Mar. Sci. 6, 196 (2019).
23. Giering, S. et al. Sinking organic particles in the ocean—flux estimates from in situ optical devices. Front. Mar. Sci. 6, 834 (2020).
24. Markussen, T. N. et al. Tracks in the snow–advantage of combining optical methods to characterize marine particles and aggregates. Front. Mar. Sci. 7, 476 (2020).
25. Forest, A. et al. Size distribution of particles and zooplankton across the shelf-basin system in southeast Beaufort Sea: combined results from an Underwater Vision Profiler and vertical net tows. Biogeosciences 9, 1301–1320 (2012). 26. Picheral, M. et al. The underwater vision profiler 5: an advanced instrument
for high spatial resolution studies of particle size spectra and zooplankton. Limnol. Oceanogr. Methods 8, 462–473 (2010).
27. Dennett, M. R., Caron, D. A., Michaels, A. F., Gallager, S. M. & Davis, C. S. Video plankton recorder reveals high abundances of colonial Radiolaria in surface waters of the central North Pacific. J. Plankton Res. 24, 797–805 (2002).
28. Ohman, M. D. & Browman, H. A sea of tentacles: optically discernible traits resolved from planktonic organisms in situ. ICES J. Mar. Sci. 76, 1959–1972 (2019).
29. Schröder, S. M., Kiko, R. & Koch, R. Morphocluster: efficient annotation of Plankton images by clustering. Sensors 20, 1–26 (2020).
30. Durkin, C. A. et al. A visual tour of carbon export by sinking particles.https:// doi.org/10.1101/2021.02.16.431317(2021).
31. Habbeln, D. & Wefer, G. Ice cover. Nature 350, 409–411 (1991).
32. Lalande, C., Bauerfeind, E., Nöthig, E. M. & Beszczynska-Möller, A. Impact of a warm anomaly on exportfluxes of biogenic matter in the eastern Fram Strait. Prog. Oceanogr. 109, 70–77 (2013).
33. Lundgreen, R. B. C. et al. Eukaryotic and cyanobacterial communities associated with marine snow particles in the oligotrophic Sargasso Sea. Sci. Rep. 9, 1–12 (2019).
34. Many, G. et al. Geometry, fractal dimension and settling velocity offlocs duringflooding conditions in the Rhône ROFI. Estuar. Coast. Shelf Sci. 219, 1–13 (2019).
35. Riley, J. S. et al. The relative contribution of fast and slow sinking particles to ocean carbon export. Glob. Biogeochem. Cycles 26, 1–10 (2012).
36. Lampitt, R. S., Wishner, K. F., Turley, C. M. & Angel, M. V. Marine snow studies in the Northeast Atlantic Ocean: distribution, composition and role as a food source for migrating plankton. Mar. Biol. 116, 689–702 (1993). 37. Waite, A. M. & Nodder, S. D. The effect of in situ iron addition on the sinking
rates and exportflux of Southern Ocean diatoms. Deep. Res. Part II 48, 2635–2654 (2001).
38. McDonnell, A. M. P. & Buesseler, K. O. Variability in the average sinking velocity of marine particles. Limnol. Oceanogr. 55, 2085–2096 (2010). 39. Marcolin, C., da, R., Schultes, S., Jackson, G. A. & Lopes, R. M. Plankton and
seston size spectra estimated by the LOPC and ZooScan in the Abrolhos Bank ecosystem (SE Atlantic). Cont. Shelf Res. 70, 74–87 (2013).
40. Trudnowska, E., Sagan, S. & Błachowiak-Samołyk, K. Spatial variability and size structure of particles and plankton in the Fram Strait. Prog. Oceanogr. 168, 1–12 (2018).
41. Bochdansky, A. B., Clouse, M. A. & Herndl, G. J. Dragon kings of the deep sea: marine particles deviate markedly from the common number-size spectrum. Sci. Rep. 6, 4–10 (2016).
42. Prairie, J. C. & White, B. L. A model for thin layer formation by delayed particle settling at sharp density gradients. Cont. Shelf Res. 133, 37–46 (2017). 43. Iversen, M. H. & Lampitt, R. S. Size does not matter after all: no evidence for a
size-sinking relationship for marine snow. Prog. Oceanogr. 189, 102445 (2020).
44. Boetius, A. et al. Export of algal biomass from the melting arctic sea ice. Science 339, 1430–1432 (2013).
45. Leu, E. et al. Arctic spring awakening-steering principles behind the phenology of vernal ice algal blooms. Prog. Oceanogr. 139, 151–170 (2015). 46. Olsen, L. M. et al. The seeding of ice algal blooms in Arctic pack ice: the
multiyear ice seed repository hypothesis. J. Geophys. Res. Biogeosciences 122, 1529–1548 (2017).
47. Lalande, C., Nöthig, E. & Fortier, L. Algal export in the Arctic Ocean in times of global warming. Geophys. Res. Lett.https://doi.org/10.1029/2019GL083167. (2019).
48. Rontani, J. F. et al. Monitoring abiotic degradation in sinking versus suspended Arctic sea ice algae during a spring ice melt using specific lipid oxidation tracers. Org. Geochem. 98, 82–97 (2016).
49. Alldredge, A. L., Granata, T. C., Gotschalk, C. C. & Dickey, T. D. The physical strength of marine snow and its implications for particle disaggregation in the ocean. Limnol. Oceanogr. 35, 1415–1428 (1990).
50. Tansel, B. Morphology, composition and aggregation mechanisms of soft bioflocs in marine snow and activated sludge: a comparative review. J. Environ. Manag. 205, 231–243 (2018).
51. Stemmann, L., Gorsky, G., Marty, J. C., Picheral, M. & Miquel, J. C. Four-year study of large-particle vertical distribution (0-1000 m) in the NW Mediterranean in relation to hydrology, phytoplankton, and verticalflux. Deep. Res. Part II 49, 2143–2162 (2002).
52. Briggs, N. et al. High-resolution observations of aggregateflux during a sub-polar North Atlantic spring bloom. Deep. Res. Part I 58, 1031–1039 (2011). 53. Jackson, G. A., Checkley, D. M. & Dagg, M. Settling of particles in the upper
100m of the ocean detected with autonomous profiling floats off California. Deep. Res. Part I 99, 75–86 (2015).
54. Fadeev, E. et al. Microbial communities in the east and west fram strait during sea ice melting season. Front. Mar. Sci. 5, 1–21 (2018).
55. Lafond, A. et al. Late spring bloom development of pelagic diatoms in Baffin Bay. Elem. Sci. Anth 7, 44https://doi.org/10.1525/elementa.382(2019). 56. Gluchowska, M. et al. Variations in the structural and functional diversity of
zooplankton over vertical and horizontal environmental gradients en route to the Arctic Ocean through the Fram Strait. PLoS ONE 12, e0171715 (2017). 57. Weydmann, A., Walczowski, W., Carstensen, J. & Kwaśniewski, S. Warming
of Subarctic waters accelerates development of a key marine zooplankton Calanusfinmarchicus. Glob. Chang. Biol. 24, 172–183 (2018).
58. Randelhoff, A. et al. The evolution of light and vertical mixing across a phytoplankton ice-edge bloom. Elem. Sci. Anth 7, 20 (2019).
59. Engel, A. et al. Inter-annual variability of transparent exopolymer particles in the Arctic Ocean reveals high sensitivity to ecosystem changes. Sci. Rep. 7, 1–9 (2017).
60. Wollenburg, J. E. et al. Ballasting by cryogenic gypsum enhances carbon export in a Phaeocystis under-ice bloom. Sci. Rep. 8, 1–9 (2018). 61. Passow, U. & Wassmann, P. On the trophic fate of Phaeocystis pouchetii
(Hariot): IV. The formation of marine snow by P. pouchetii. Mar. Ecol. Prog. Ser. 104, 153–161 (1994).
62. Kilps, J. R., Logan, B. E. & Alldredge, A. L. Fractal dimensions of marine snow determined from image analysis of in situ photographs. Deep. Res. Part I 41, 1159–1169 (1994).
63. Martin, J., Knauer, G., Karl, D. & Broenkow, W. VERTEX: carbon cycling in the northeast Pacific. Deep Sea Res. Part A 34, 267–285 (1987).
64. Nöthig, E. M. et al. Summertime plankton ecology in fram strait-a compilation of long-and short-term observations. Polar Res. 34, 23349 (2015).
65. Kubiszyn, A. M. et al. The annual planktonic protist community structure in an ice-free high Arctic fjord (Adventfjorden, West Spitsbergen). J. Mar. Syst. 169, 61–72 (2017).
66. Olsen, L. M. et al. A red tide in the pack ice of the Arctic Ocean. Sci. Rep. 9, 9536 (2019).
67. Ardyna, M. & Arrigo, K. R. Phytoplankton dynamics in a changing Arctic Ocean. Nat. Clim. Chang. 10, 892–903 (2020).
68. Alldredge, A. L. & Gotschalk, C. C. The relative contribution of marine snow of different origins to biological processes in coastal waters. Cont. Shelf Res. 10, 41–58 (1990).
69. Metfies, K., Von Appen, W. J., Kilias, E., Nicolaus, A. & Nöthig, E. M. Biogeography and photosynthetic biomass of arctic marine pico-eukaroytes during summer of the record sea ice minimum 2012. PLoS ONE 11, 1–20 (2016).
70. Ardyna, M. et al. Environmental drivers of under-ice phytoplankton bloom dynamics in the Arctic Ocean. Elem. Sci. Anth 8, 30 (2020).
71. Saint-Béat, B. et al. Contrasting pelagic ecosystem functioning in eastern and western Baffin Bay revealed by trophic network modeling. Elem. Sci. Anth 8, 1–24 (2020).
72. Wekerle, C. et al. Properties of Sediment Trap Catchment Areas in Fram Strait: Results From Lagrangian Modeling and Remote Sensing. Front. Mar. Sci. 5, 407 (2018).