HAL Id: hal-00298224
https://hal.archives-ouvertes.fr/hal-00298224
Submitted on 5 Jun 2008HAL is a multi-disciplinary open access
archive for the deposit and dissemination of sci-entific research documents, whether they are pub-lished or not. The documents may come from teaching and research institutions in France or abroad, or from public or private research centers.
L’archive ouverte pluridisciplinaire HAL, est destinée au dépôt et à la diffusion de documents scientifiques de niveau recherche, publiés ou non, émanant des établissements d’enseignement et de recherche français ou étrangers, des laboratoires publics ou privés.
Mid-depth South Atlantic ocean circulation and
chemical stratification during MIS-10 to 12: implications
for atmospheric CO2
A. J. Dickson, M. J. Leng, M. A. Maslin
To cite this version:
A. J. Dickson, M. J. Leng, M. A. Maslin. Mid-depth South Atlantic ocean circulation and chemical stratification during MIS-10 to 12: implications for atmospheric CO2. Climate of the Past Discussions, European Geosciences Union (EGU), 2008, 4 (3), pp.667-695. �hal-00298224�
CPD
4, 667–695, 2008 SE Atlantic circulation during MIS-10 to 12 A. J. Dickson et al. Title Page Abstract Introduction Conclusions References Tables Figures ◭ ◮ ◭ ◮ Back CloseFull Screen / Esc
Printer-friendly Version Interactive Discussion Clim. Past Discuss., 4, 667–695, 2008
www.clim-past-discuss.net/4/667/2008/
© Author(s) 2008. This work is distributed under the Creative Commons Attribution 3.0 License.
Climate of the Past Discussions
Climate of the Past Discussions is the access reviewed discussion forum of Climate of the Past
Mid-depth South Atlantic ocean
circulation and chemical stratification
during MIS-10 to 12: implications for
atmospheric CO
2
A. J. Dickson1, M. J. Leng2,*, and M. A. Maslin1 1
Environmental Change Research Centre, Department of Geography, University College London, Pearson Building, Gower Street, London, WC1E 6BT, UK
2
NERC Isotope Geosciences Laboratory, British Geological Survey, Keyworth, Nottingham, NG12 5FF, UK
*
also at: School of Geography, University of Nottingham, Nottingham, NG7 2RD, UK Received: 13 May 2008 – Accepted: 19 May 2008 – Published: 5 June 2008 Correspondence to: A. J. Dickson ([email protected])
CPD
4, 667–695, 2008 SE Atlantic circulation during MIS-10 to 12 A. J. Dickson et al. Title Page Abstract Introduction Conclusions References Tables Figures ◭ ◮ ◭ ◮ Back CloseFull Screen / Esc
Printer-friendly Version Interactive Discussion
Abstract
A detailed record of benthic foraminifera carbon isotopes from the South East Atlantic margin shows little glacial-interglacial variability between MIS-12 to MIS-10, suggesting that Glacial North Atlantic Intermediate Water (GNAIW) consistently penetrated to at least 30◦S. Millennial-scale increases in either the mass or flux of GNAIW over the core
5
site occur alongside reductions in Lower North Atlantic Deep Water recorded in North Atlantic sediment cores and show that the lower and intermediate limb of the Atlantic deepwater convective cell oscillated in anti-phase during previous glacial periods. In addition, a 500 yr resolution record of the Cape Basin intermediate-deep δ13C gradi-ent shows that a reduction in deep Southern Ocean vgradi-entilation at the end of MIS-11
10
was consistent with a modelled CO2 drawdown of ∼21–30 ppm. Further increases in the Southern Ocean chemical divide during the transition into MIS-10 were completed before minimum CO2levels were reached, suggesting that other mechanisms such as
alkalinity changes were responsible for the remaining ∼45 ppm drawdown.
1 Introduction
15
A number of mechanisms within the earth-ocean-atmosphere system have the po-tential to exert a positive or negative feedback on orbitally forced climate variability. Changes in ocean circulation can have an impact on climate changes over timescales ranging from decades to millennia, by altering the distribution of alkalinity in the oceans, and thus changing atmospheric CO2(e.g. Boyle, 1988; Toggweiler et al., 1999; Sigman
20
and Boyle, 2000), or by changing the distribution of surface heat transported by ocean currents (Clark et al., 2002). Glacial-interglacial changes in ocean circulation have been reconstructed in a number of studies, traditionally using changes in the carbon isotope ratios of benthic foraminifera (e.g. Curry and Lohmann, 1983; Shackleton et al., 1983; Boyle and Keigwin, 1985/86; Boyle and Keigwin, 1987; Oppo and Fairbanks,
25
CPD
4, 667–695, 2008 SE Atlantic circulation during MIS-10 to 12 A. J. Dickson et al. Title Page Abstract Introduction Conclusions References Tables Figures ◭ ◮ ◭ ◮ Back CloseFull Screen / Esc
Printer-friendly Version Interactive Discussion Charles et al., 1996; Yu et al., 1996; Lynch-Stieglitz et al., 2007; Martinez-Mendez
et al., 2008) and have consistently shown that the production of Lower North Atlantic Deep Water (LNADW) decreased during the cold climates of the Last Glacial Maximum (LGM) and during Heinrich events and was replaced by southern sourced deepwaters that expanded into the Northern Atlantic below ∼2000 m. At the same time, Glacial
5
North Atlantic Intermediate Water (GNAIW) spread southwards at depths shallower than 2000 m to at least 30◦S (Duplessy et al., 1988; Oppo and Lehman, 1993; Oppo and Horowitz, 2000; Curry and Oppo, 2005).
Marine Isotope Stage (MIS) 11, the most recent interglacial period to occur under a similar pattern of orbital forcing to the Holocene (Loutre and Berger, 2003) has the
10
potential to provide information on the type and magnitude of climate variability that could be expected under “baseline” (i.e. non-anthropogenic) conditions. However, few detailed records of deepwater variability during the middle Brunhes period have been produced, and those that do are predominantly located in the North Atlantic Ocean (e.g. Oppo et al., 1998; Poli et al., 2000; Thunell et al., 2002; McManus et al., 2003;
15
Hall and Becker, 2007; Martrat et al., 2007).
Here we present a new ∼450 yr resolution benthic foraminifera δ13C record from ODP-1085 in the South Eastern Atlantic Ocean (Table 1 and Fig. 1) that extends be-tween 480–330 ka. The data show that the increased advection of GNAIW to interme-diate depths in the South East Atlantic Ocean at millennial-timescales was coincident
20
with a reduced production of LNADW, possibly in response to the delivery of meltwater to sites of deepwater production in the North Atlantic. Furthermore, similarities be-tween the structure of the Cape Basin vertical δ13C gradient and the spliced EPICA Dome C (EDC)/Vostok atmospheric CO2 record supports previous suggestions of a
close link between ventilation of the deep ocean and changes in atmospheric
green-25
CPD
4, 667–695, 2008 SE Atlantic circulation during MIS-10 to 12 A. J. Dickson et al. Title Page Abstract Introduction Conclusions References Tables Figures ◭ ◮ ◭ ◮ Back CloseFull Screen / Esc
Printer-friendly Version Interactive Discussion
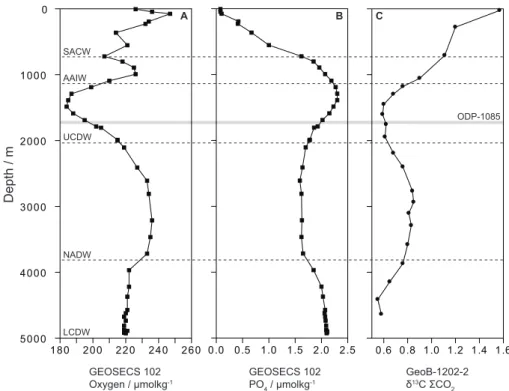
2 Modern deepwater hydrography at ODP-1085
The structure of the South Atlantic water column has been discussed in detail by Mc-Cartney (1977), Saunders and King (1994), and Siedler et al. (1996), and is shown in Fig. 2 with profiles of dissolved oxygen, phosphate and δ13C CO2 from GEOSECS
Station 102 (Kroopnick, 1980). NADW flows southwards in the Western Atlantic
be-5
tween 1200–4000 m, and is marked by dissolved O2concentrations of ∼230 µmol kg−1 and PO4 concentrations of ∼1.6 µmol kg−1. South of the equator, this flow branches into two components and enters the South East Atlantic, where it can be identified between 2000–3500 m (Fig. 2a and b). Northwards-flowing Circumpolar Deep Water (CDW) is intersected by NADW east of Drake Passage, and bifurcates into an upper
10
and lower branch (UCDW and LCWD respectively). UCDW can be identified by low dis-solved oxygen (<200 µmol kg−1) and high phosphate (∼2 µmol kg−1) concentrations, which are derived from its origins in Indian and Pacific waters (Whitworth and Nowlin Jr., 1987). These properties are modified slightly by mixing with underlying NADW and are identifiable in the GEOSECS 102 data between ∼1100 m and 2000 m. LCDW
15
occupies the bottom of the Cape Basin below 3500 m (Siedler et al., 1996) where it can be distinguished from NADW by comparatively higher phosphate and lower oxy-gen concentrations. Antarctic Intermediate Water (AAIW) is formed by the subduction of upwelled CDW at the sub-Antarctic front (McCartney, 1977), and fills much of the South Atlantic at depths between 700–1000 m.
20
ModernPCO2 δ 13
C profiles in the South Eastern Atlantic are clearly related to the distribution of these water masses (Kroopnick, 1980; Bickert and Wefer, 1999). In Fig. 2c, NADW is clearly distinguished by high δ13C values of +0.8‰, while values for AAIW, UCDW and LCDW are <+0.5‰. ODP-1085 is currently located within the NADW/UCDW mixing boundary, where T-S data suggests that it is influenced by a
25
CPD
4, 667–695, 2008 SE Atlantic circulation during MIS-10 to 12 A. J. Dickson et al. Title Page Abstract Introduction Conclusions References Tables Figures ◭ ◮ ◭ ◮ Back CloseFull Screen / Esc
Printer-friendly Version Interactive Discussion
3 Methods
Benthic foraminifera samples from ODP-1085 were picked from the >250 µm fraction at 2 cm intervals between 11.00–17.50 mbsf. Measurements were performed on the epibenthic species Cibicidoides wuellerstorfi and the infaunal species Uvigerina spp. where C. wuellerstorfi was absent. Each sample was reacted at 90◦C in a VG IsoCarb
5
common acid bath system attached to an Optima mass spectrometer. δ18O and δ13C values are expressed relative to the Vienna PDB scale by reference to an internal laboratory working standard (KCM) calibrated against NBS-19. Internal precision was monitored with repeat measurements of KCM and was 0.09‰ for δ18O and 0.06‰ for
δ13C over the period of analysis. δ18O values of C. wuellerstorfi have been corrected
10
by +0.64‰ and δ13C values of Uvigerina spp. have been corrected by +0.90‰ to correct for offset from isotopic equilibrium (Duplessy et al., 1984).
Foraminifera fragments >150 µm have also been counted as a qualitative measure of carbonate dissolution (e.g. Le and Shackleton, 1992). In order to account for changes in the abundance of foraminifera through time, the abundance of fragments is
ex-15
pressed relative to the mass of sand-sized material (>63 µm), which is dominated by planktonic foraminifera. An age-model for ODP-1085B has been generated through vi-sual correlation to the LR04 benthic oxygen isotope stack (Lisiecki and Raymo, 2005). This approach yields a study section extending between 330–480 ka, at an average temporal resolution of 450 years. Tie points are shown in Table 1.
20
4 Results
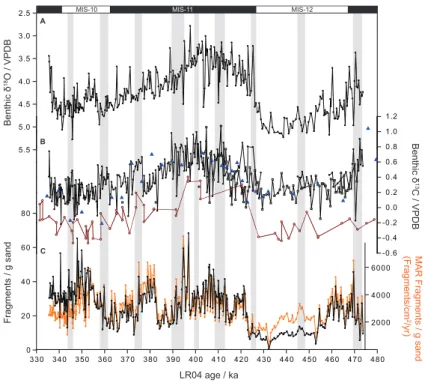
The C. wuellerstorfi/Uvigerina spp. δ18O/δ13C data from ODP-1085 are shown in Fig. 3, along with foraminifera fragment abundances and accumulation rates. The δ18O record shows the most obvious features of MIS-11, in particular the long deglaciation during termination 5 and a decrease in the rate of δ18O change in the early part of
25
CPD
4, 667–695, 2008 SE Atlantic circulation during MIS-10 to 12 A. J. Dickson et al. Title Page Abstract Introduction Conclusions References Tables Figures ◭ ◮ ◭ ◮ Back CloseFull Screen / Esc
Printer-friendly Version Interactive Discussion MIS-10, these features permitted the transfer of the LR04 chronology to the studied
section of ODP-1085. δ13C values of individual data points range from 0 to +1‰. However, the average glacial-interglacial change in δ13C is close to the mean-ocean changes found for the last deglaciation (Curry et al., 1988; Duplessy et al., 1988, see discussion below). Several short-term δ13C increases are superimposed on this
long-5
term trend. These increases are defined as periods when δ13C values rise abruptly by +0.1 to +0.3‰, and are maintained for several adjacent data points before decreasing again to pre-excursion values (shaded bands in Figs. 3 and 4). Foraminifera fragments indicate varying levels of carbonate preservation through the study interval. Highest abundances/accumulation rates occur at the beginning of MIS-12, during the climate
10
optimum of MIS-11 (424–390 ka), towards the end of MIS-11 (383–370 ka) and dur-ing MIS-10 (355–345 ka). The intervendur-ing intervals are characterised by relatively low amounts of fragmentation.
5 Discussion
5.1 Effects of organic matter on benthic foraminifera δ13C in ODP-1085
15
The release of 12C into bottom waters during organic matter breakdown may cause locally lowered δ13C values in benthic foraminifera. Although C. wuellerstorfi has been demonstrated to calcify close to bottom-water carbon isotopic equilibrium (Graham et al., 1980; Belanger et al., 1981; Duplessy et al., 1984), a highly seasonal flux of or-ganic matter to the seafloor can generate C. wuellerstorfi blooms whose δ13C is offset
20
from bottom water PCO2 by −0.4 to −0.6‰ (Mackensen et al., 1993; Bickert and Wefer, 1999). A number of lines of evidence suggest that this “photodetritus” effect does not unreasonably compromise the C. wuellerstorfi δ13C data from ODP-1085. Firstly, highly pulsed seasonal organic matter production does not occur over the study site, although there is a small peak in organic matter flux during summer (Romero
25
val-CPD
4, 667–695, 2008 SE Atlantic circulation during MIS-10 to 12 A. J. Dickson et al. Title Page Abstract Introduction Conclusions References Tables Figures ◭ ◮ ◭ ◮ Back CloseFull Screen / Esc
Printer-friendly Version Interactive Discussion ues of nearby cores GeoB-1721-5, GeoB1719-4, GeoB-1729-2 and GeoB-1720-3 are
within 0.15‰ of bottom water δ13C PCO2, suggesting that unlike sites closer to the
coastal upwelling cells, a photodetritus effect does not arise from enhanced produc-tivity in more open-ocean locations (Bickert and Wefer, 1999; Dickson et al., in prep.).
Uvigerina spp. calcify within sediment porewaters and thus may be biased by
low-5
δ13C metabolic carbon during organic matter oxidation (Zahn et al., 1986). However, 43 paired measurements of C. wuellerstorfi and Uvigerina spp. from ODP-1085 and GeoB-17202/3 give a δ13C difference of +0.96‰ which is close to the Duplessy et al. (1984) +0.90‰ correction, and is also constant downcore. Additionally, C.
wueller-storfi δ13C in nearby ODP-1088 (Pierre et al., 2001) (41.8◦S, 13.3◦E, 2082 m) (Fig. 3b)
10
are extremely similar to Uvigerina spp. during MIS-12 in ODP-1085, suggesting that these values may be reliably interpreted in terms of bottom water δ13C.
5.2 Glacial-interglacial changes in benthic δ13C
Deep sites within the Cape Basin have more negative benthic foraminifera δ13C values than the deep Pacific Ocean during late Pleistocene glacials (Raymo et al., 1990; Oppo
15
and Horowitz, 2000; Ninnemann and Charles, 2002; Hodell et al., 2003a). In contrast, benthic δ13C in ODP-1085 reaches +0.8–0.9‰ during MIS-11 and +0.1–0.2‰ during MIS-10 and 12, and never falls below the deep Pacific δ13C values recorded at ODP-849 (Mix et al., 1995) (Fig. 3b). The average glacial-interglacial δ13C change between the MIS-11 climate optimum (424–397 ka) and MIS-10 (360–340 ka) is −0.34‰, which
20
is similar in amplitude to the 0.32‰ glacial-interglacial change in whole-ocean δ13C due to expansions and contractions of the terrestrial biosphere seen over the MIS-2/1 transition (Curry et al., 1988), but less than the 0.95‰ proposed for the MIS-12/11 boundary (Thunell et al., 2002). Consequently, it may be surmised that a low-nutrient water mass with similar δ13CPCO2values to the present NADW/UCDW mixture must
25
have been present at ∼1700 m depth during glacial stages MIS-10 and 12 in the South East Atlantic Ocean at 30◦S. Slightly higher δ13C values at ODP-1088 between 360– 340 ka (Pierre et al., 2001) probably reflect increased mixing with underlying CDW
CPD
4, 667–695, 2008 SE Atlantic circulation during MIS-10 to 12 A. J. Dickson et al. Title Page Abstract Introduction Conclusions References Tables Figures ◭ ◮ ◭ ◮ Back CloseFull Screen / Esc
Printer-friendly Version Interactive Discussion during full glacial conditions (Fig. 3b).
The source of the low-nutrient water mass that overlay ODP-1085 during MIS-10 and 12 may be sought through a comparison to several studies that have shown the pres-ence of a sharp chemocline in the South Atlantic and adjacent Southern Ocean during glacial periods (Ninnemann and Charles, 2002; Hodell et al., 2003a). This
chemo-5
cline separated low-nutrient (high δ13C) water above 2100 m from high-nutrient (low
δ13C) water below. The presence of a low-nutrient water mass at intermediate depths
<2100 m can also be traced along the African continental slope (Pierre et al., 2001; Mackensen et al., 2001) and into the western South Atlantic Ocean, where it has been identified as a water mass with δ13C values >+0.8‰ centred at ∼1500 m depth and
10
bounded above and below by higher-nutrient water masses (Oppo and Horowitz, 2000; Curry and Oppo, 2005). A glacial chemocline at 2000 m depth has also been identified in the North Atlantic (Oppo and Lehmann, 1993), and is related to the production of GNAIW and the northwards spread of low δ13C southern sourced deepwaters below the minimum depth of the mid-Atlantic ridge (Curry and Oppo, 2005). Based on the
15
similarity of δ13C values, the consistency with existing reconstructions of glacial water mass geometry, and the consistency with modern oceanographic observations of a divergence of NADW flow from the western to the eastern South Atlantic south of the equator, bottom waters over ODP-1085 during MIS-10 and 12 were likely influenced by GNAIW, and not the SAMW suggested by Hodell et al. (2003a).
20
5.3 Millennial-scale changes in benthic δ13C
The temporal resolution of the ODP-1085 dataset allows millennial-scale changes in deepwater δ13C to be identified (shaded bands in Fig. 3). These events are most pronounced during the transition from MIS-11 into MIS-10 (397–340 ka), when their amplitude ranges from +0.1 to +0.3‰. Each event is superimposed onto the
glacial-25
interglacial δ13C trend, over timescales that are too short to be explained by terrestrial biosphere expansions. Supplementary information about the balance between CDW and northern-sourced waters (either NADW in the modern sense or GNAIW in the
CPD
4, 667–695, 2008 SE Atlantic circulation during MIS-10 to 12 A. J. Dickson et al. Title Page Abstract Introduction Conclusions References Tables Figures ◭ ◮ ◭ ◮ Back CloseFull Screen / Esc
Printer-friendly Version Interactive Discussion glacial sense) over the core site may be obtained from a measure of calcium carbonate
preservation. Contemporary observations indicate that NADW has a higher alkalinity than CDW. This distribution of alkalinity affects the preservation of calcium carbonate in the deep sea, since the carbonate lysocline will be deeper in regions overlain by NADW (Broecker, 2003). Each millennial increase in benthic δ13C corresponds to a
5
small decrease in the abundance and accumulation rate of planktonic foraminifera frag-ments in ODP-1085 (Fig. 3c), which would be expected if the carbon isotope change were being caused by the mixing of NADW/GNAIW with CDW. This relationship is not straightforward because of a number of factors that can also influence calcium carbon-ate dissolution, such as changes in the population of foraminifera species (e.g. Berger,
10
1970) and the release of metabolic CO2in sediment porewaters (Broecker, 2003). The millennial-scale increases in benthic δ13C during MIS-10 to 12 were likely caused either by less NADW(GNAIW)/CDW mixing (deepening of the GNAIW/CDW boundary), or by an increase in pre-formed δ13C of GNAIW entering the intermediate-depth Cape Basin. Higher flux rates of GNAIW could reduce its residence time in
15
the western Atlantic, thus increasing pre-formed δ13C in the South East Atlantic, in agreement with studies showing an enhanced export of this water mass from the North Atlantic during the LGM (Yu et al., 1996; Oppo and Horowitz, 2000). In either case, the data from ODP-1085 point to periodically enhanced transport of GNAIW into the South Atlantic due to higher flux rates or higher mass transport.
20
5.4 Comparison to North Atlantic and Southern Ocean records
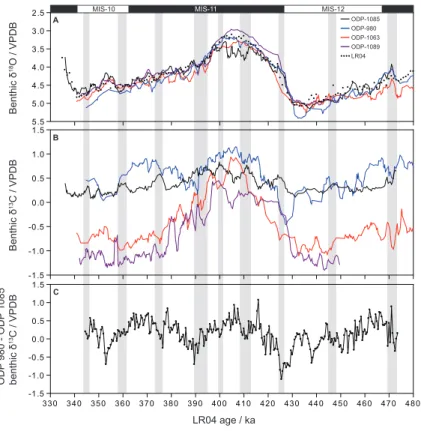
The benthic foraminifera δ13C record from ODP-1085 may be compared to other high-resolution datasets covering the period 330–480 ka from the North and South Atlantic Ocean in order to identify basin-wide responses to deep-ocean circulation changes. To maximise the potential for examining sub-orbital variability, only datasets with a
tempo-25
ral resolution of ≤500 years have been used in our comparison. Details of these cores are shown in Table 2. Briefly, ODP-980 and ODP-1063 monitor changes in Upper and Lower NADW respectively (Oppo et al., 1998; McManus et al., 1999; Poli et al., 2000;
CPD
4, 667–695, 2008 SE Atlantic circulation during MIS-10 to 12 A. J. Dickson et al. Title Page Abstract Introduction Conclusions References Tables Figures ◭ ◮ ◭ ◮ Back CloseFull Screen / Esc
Printer-friendly Version Interactive Discussion Thunell et al., 2002), while ODP-1089 is located within LCDW in the southern Cape
Basin, south of ODP-1085 (Hodell et al., 2001). Each record has been placed on a common age-scale by tying benthic δ18O to the LR04 stack (Lisiecki and Raymo, 2005) (Fig. 4a and Table 1). This procedure allows an internal comparison to be made within the precision allowed by stratigraphic correlation (∼2000 years). ODP-1085, ODP-980
5
and ODP-1089 have been interpolated at 500 year intervals to calculate inter-site gra-dients. The North Atlantic-South Atlantic gradient has been calculated as ∆(980–1085) (Fig. 4c), and the vertical Cape Basin gradient has been calculated as ∆(1085–1089) (Fig. 6). Our selection of records with a high temporal resolution means that changes in water mass end-member values may have affected inter-site the δ13C gradients.
10
However, these changes also provide information about the phasing of different modes of deepwater circulation.
5.4.1 ∆(980–1085)δ13C gradient
Assuming that the δ13CPCO2 of CDW is primarily controlled by mixing with NADW
(Charles et al., 1996; Ninnemann and Charles, 2002), the δ13C gradient between
15
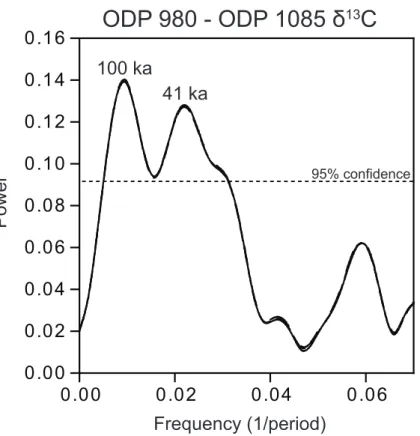
NADW source regions and the South Atlantic/Southern Ocean should provide a mea-sure of the southward flux of NADW and thus the relative strength of Northern Hemi-sphere deepwater production (Oppo et al., 1990; Raymo et al., 1990). From Fig. 4c, ∆(980–1085) values become lower on several occasions, suggesting an increase in the flux of NADW/GNAIW into the South Atlantic. A strong 41 000 periodicity (Fig. 5)
20
is consistent with the modulation of intermediate-depth ventilation by changes in high-latitude sea-surface temperatures and sea-ice in response to obliquity (Ruddiman and McIntyre, 1984; Raymo et al., 1990).
Negative values of ∆980–1085 occur at 360 ka, 375 ka, 390 ka, 425 ka and 440 ka, which would suggest a reversal of the modern north-south Atlantic δ13C gradient if
25
end-member values remained constant. These reversals are partially due to increases in benthic δ13C in ODP-1085 (Fig. 3b) and decreases in benthic δ13C in ODP-980 (Fig. 4b), which was sensitive to shoaling of the GNAIW/Southern Component Water
CPD
4, 667–695, 2008 SE Atlantic circulation during MIS-10 to 12 A. J. Dickson et al. Title Page Abstract Introduction Conclusions References Tables Figures ◭ ◮ ◭ ◮ Back CloseFull Screen / Esc
Printer-friendly Version Interactive Discussion (SCW) boundary during the last glacial period (Oppo and Lehmann, 1993).
Millennial-scale increases in the penetration of SCW into the North Atlantic at the expense of LNADW can also be found in benthic δ13C isotope decreases in deep western Atlantic site ODP-1063 (Poli et al., 2000; Fig. 4b), and from increases in sortable silt grain size related to shoaling of the LNADW-derived Deep Western Boundary Current in
ODP-5
1061 (Hall and Becker, 2007). These events correspond particularly well at 360 ka, 375 ka, 390 ka and 470 ka. Consequently, it may be surmised that the flux/mass of GNAIW to the South East Atlantic Ocean increased during periods when several sites suggest less LNADW production and/or more SCW production. This anti-phased re-lationship was also present during the most recent glacial termination (Marchitto et
10
al., 1998). Since UNADW/GNAIW differs from LNADW by containing a component of Labrador Sea Water (LSW) in addition to the Greenland-Scotland Overflow Waters that are common to both (van Aken, 2000), the contrasting behaviour of these water masses through the MIS-12 to MIS-10 study period points towards a strong variability of deepwater production in the Nordic Seas over millennial timescales during MIS-10
15
and 12.
Several studies have suggested that MIS-11 was an extremely stable interglacial, with little variability in surface water mass temperature and salinity in the North At-lantic (e.g. Oppo et al., 1998; McManus et al., 2003). However, two decreases in the ∆(980–1085) gradient at 410 ka and 400 ka occur alongside increases in benthic δ13C
20
in ODP-1085 and show that the Southeast Atlantic NADW/UCDW boundary shoaled at these times. Similar benthic δ13C values in ODP-1089 and ODP-1063 (Fig. 4b) suggest that the LCDW/NADW boundary also shoaled during these events, allowing southern-sourced deepwater to spread into the abyssal North Atlantic. There was lit-tle IRD deposition in the North Atlantic during 410–390 ka (Oppo et al., 1998; Helmke
25
and Bauch, 2003), which would tend to argue against changes in NADW production. In contrast, there is some evidence of a regional cooling in the Southern Ocean at 410–415 ka (Becquey and Gersonde, 2002; Cortese et al., 2007), which occurs along-side a small (5–10 ppm) increase in atmospheric CO2 (Siegenthaler et al., 2005). It is
CPD
4, 667–695, 2008 SE Atlantic circulation during MIS-10 to 12 A. J. Dickson et al. Title Page Abstract Introduction Conclusions References Tables Figures ◭ ◮ ◭ ◮ Back CloseFull Screen / Esc
Printer-friendly Version Interactive Discussion therefore tempting to speculate that these interglacial changes in water mass structure
were somehow related to the increased production of deepwaters around Antarctica, although more detailed information from the Southern Ocean would be needed to test this suggestion.
5.4.2 ∆1085–1089 δ13C gradient
5
The concentration of atmospheric CO2 during late Pleistocene glacial periods was
∼80 ppm lower than during interglacials (e.g. Petit et al., 1999). A number of mecha-nisms probably combined to produce this change, involving physical changes in ocean temperature, salinity, circulation and mixing, changes in the export of organic carbon to the deep sea, and changes in deep-ocean alkalinity (e.g. Toggweiler, 1999; Stephens
10
and Keeling, 2000; Sigman and Boyle, 2000; Marinov et al., 2005; Broecker, 2003; Sigman and Haug, 2003). To examine the relevance of deepwater ventilation changes on atmospheric CO2during MIS-12 to 10, a similar approach to Hodell et al. (2003a) is
used, whereby the benthic δ13C gradient between high-resolution intermediate water site ODP-1085 and high-resolution deepwater site ODP-1089 is calculated at 500 year
15
intervals between ∼450 ka and 340 ka. Despite geographical distance, both sites are located within the Cape Basin north of the Subtropical Front, and are characterised by ∼70% CaCO3concentrations during glacials.
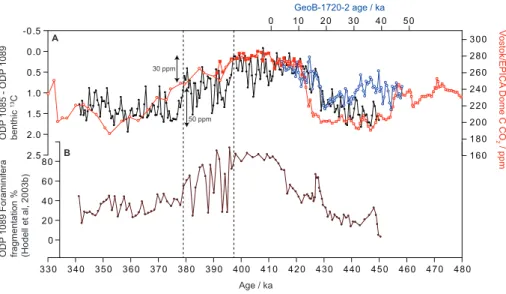
The vertical Cape Basin δ13C gradient shown in Fig. 6 closely corresponds to the spliced EPICA Dome C/Vostok atmospheric CO2record (Petit et al., 1999; Siegenthaler
20
et al., 2005), in agreement with suggestions that the glacial chemocline that formed at ∼2 km in the Southern Ocean represents a shift in oceanographic conditions that impacted strongly on atmospheric CO2concentrations (Ninnemann and Charles, 2002;
Hodell et al., 2003a; Mortyn et al., 2003). From Fig. 6, the first ∼0.5‰ increase in ∆δ13C took place at 397 ka, accompanying a 30 ppm decrease in CO2 to fairly stable
25
intermediate levels of ∼250 ppm. The chemical divide then reached its maximum at 377 ka following a second abrupt rise in ∆δ13C, thus leaving other mechanisms to
CPD
4, 667–695, 2008 SE Atlantic circulation during MIS-10 to 12 A. J. Dickson et al. Title Page Abstract Introduction Conclusions References Tables Figures ◭ ◮ ◭ ◮ Back CloseFull Screen / Esc
Printer-friendly Version Interactive Discussion explain the remaining 45‰ CO2 drop. Carbonate deposition continues to increase
alongside an increase in carbonate preservation after 375 ka in ODP-1089 (Fig. 6) (Hodell et al., 2001; 2003b). Consequently, the effects of deep-ocean alkalinity change may have become more important than deep-ocean ventilation in forcing CO2 change later during the transition into MIS-10.
5
Toggweiler (1999) suggested that an interglacial-glacial shift of −80 ppm in atmo-spheric CO2could be forced by the reduced ventilation of the deep ocean (−21 ppm), along with a decrease in SST and an increase in deep-ocean alkalinity (−59 ppm). The sequence of events suggested by Toggweiler (1999) was that the change in deep-ocean ventilation would impact on CO2first, followed by SST and carbonate
compen-10
sation. A similar sequence of events was proposed by Peacock et al. (2006), who used a box model to suggest that in order to avoid the timing constraints imposed by sea-level change, reduced glacial sea-surface temperatures and reduced high-latitude vertical mixing could explain up to 50 ppm of the initial CO2drop leading into MIS-5a to 5d. Alkalinity and nutrient changes could then explain the second part of the CO2
15
decline leading into MIS-4. The range of CO2found to accompany the initial change in
∆(1085–1089) (∼30 ppm) is similar to the 21 ppm modelled by Toggweiler (1999), and therefore supports the role of deep-ocean ventilation as the initial driver of CO2decline
following the MIS-11 climate optimum.
McManus et al. (1999) suggested that millennial-scale climate variability increases
20
when benthic δ18O reaches a value of +3.5‰ (or +4.14‰ when corrected for equi-librium effects). The period of “intermediate” δ13C stratification in the Cape Basin between 392–378 ka occurs when benthic foraminifera δ18O in ODP-1085 reaches this threshold, thus suggesting that periods of intermediate ice-volume were also char-acterised by a unique configuration of water masses in the South Atlantic/Southern
25
Ocean, and a correspondingly unique mode of ocean circulation.
Recent ice-core data has revealed that despite a large amount of deep-ocean car-bonate dissolution during MIS-11 (e.g. Ziegler et al., 2003), atmospheric CO2
agree-CPD
4, 667–695, 2008 SE Atlantic circulation during MIS-10 to 12 A. J. Dickson et al. Title Page Abstract Introduction Conclusions References Tables Figures ◭ ◮ ◭ ◮ Back CloseFull Screen / Esc
Printer-friendly Version Interactive Discussion ment with this, the vertical δ13C gradient between GeoB-1720-2 (near to ODP-1085 at
1995 m depth) and ODP-1089 has an almost identical magnitude of change over termi-nation 1 as during termitermi-nation 5, and similar interglacial values (Fig. 4d, blue circles). However, the δ13C gradient was ∼1‰ higher during MIS-12 than during MIS-2, yet CO2concentrations were, if anything, 5–10 ppm higher during the former glacial period
5
(Siegenthaler et al., 2005). This discrepancy may be due to the slightly deeper depth of GeoB-1720-2 that makes it more sensitive to mixing with CDW during glacials, as seen for ODP-1088 (Fig. 3b). These observations reinforce the proposed role of Southern Ocean stratification in contributing to changes in atmospheric CO2(Toggweiler, 1999; Hodell et al., 2003a), and also show that the position of the South Atlantic/Southern
10
Ocean chemocline was located slightly shallower than 2 km during full glacial stages MIS-12, MIS-10 and MIS-2.
6 Conclusions
Intermediate water δ13C variability at ODP-1085 was extremely muted between ∼480– 330 ka and can be explained by the continuous influence of northern sourced
deepwa-15
ters during glacials MIS-10 and MIS-12 (GNAIW) and interglacial MIS-11 (NADW). During glacials, millennial-scale increases in benthic δ13C match small decreases in foraminifera fragmentation and imply either an increased flux of GNAIW to the South East Atlantic, or a decrease in the amount of mixing with adjacent CDW due to a tem-porary deepening of the South Atlantic glacial chemocline. These events correspond to
20
shoaling of the GNAIW/SCW boundary in the north Atlantic, and imply an anti-phased relationship at millennial timescales between the production North Atlantic deepwaters in the Greenland and Labrador Seas respectively. During MIS-11, millennial-scale increases in benthic δ13C indicate shoaling of the NADW/UCDW boundary. From comparison to other published core sites, this may reflect the increased penetration
25
of southern-sourced deepwaters into the abyssal North Atlantic Ocean, although the cause of these events remains uncertain.
CPD
4, 667–695, 2008 SE Atlantic circulation during MIS-10 to 12 A. J. Dickson et al. Title Page Abstract Introduction Conclusions References Tables Figures ◭ ◮ ◭ ◮ Back CloseFull Screen / Esc
Printer-friendly Version Interactive Discussion Our data also reveals that the detailed vertical Cape Basin ∆δ13C gradient
paral-lels atmospheric CO2concentrations derived from the EPICA Dome C and Vostok ice
cores. This supports previous suggestions that a strong chemical divide in the glacial Southern Ocean was able to isolate nutrient and CO2-rich deepwaters and thus
con-tribute to glacial CO2 drawdown (Toggweiler, 1999; Hodell et al., 2003a), although this
5
mechanism may have been most important during the initial phases of CO2 decline following the warmest part of MIS-11. The similarity in the magnitude of the δ13C gra-dient shift over terminations 1 and 5 matches the similar magnitude of CO2 change
observed over each transition (Siegenthaler et al., 2005) and strongly implicates the Southern Ocean as an important store of CO2 during Middle-Pleistocene glacial
pe-10
riods. Its potential importance for sub-orbital CO2 changes awaits more detailed gas
measurements from the Antarctic ice-core records.
Acknowledgements. The authors wish to thank Hilary Sloane for running the mass
spectrome-ter at NIGL, Torsten Bickert for kindly providing waspectrome-ter-column data from GeoB-1202 and Amelia Shevenell for commenting on an early draft of the manuscript. This work was supported by a
15
NERC PhD studentship award to AJD (NER/S/A/2005/13226) and NIGFSC grant IP/894/0506.
References
Becquey, S. and Gersonde, R.: A 0.55-Ma paleotemperature record from the Subantarctic zone: Implications for Antarctic Circumpolar Current development, Paleoceanography, 18, 1014, doi:10.1029/2000PA000576, 2002.
20
Belanger, P. E., Curry, W. B., and Matthews, R. K.: Core-top evaluation of benthic foraminiferal isotopic ratios for paleo-oceanographic interpretations, Palaeogeogr. Palaeo-climatol. Palaeoecol., 33, 205–220, 1981.
Berger, A.: Planktonic foraminifera – selective solution and lysocline, Mar. Geol., 8, 111–138, 1970.
25
Bickert, T. and Wefer, G.: South Atlantic and benthic foraminifer 13C deviations: implications for reconstructing the late Quaternary deep water circulation, Deep Sea Res. II, 46, 437–452, 1999.
CPD
4, 667–695, 2008 SE Atlantic circulation during MIS-10 to 12 A. J. Dickson et al. Title Page Abstract Introduction Conclusions References Tables Figures ◭ ◮ ◭ ◮ Back CloseFull Screen / Esc
Printer-friendly Version Interactive Discussion
Boyle, E. A. and Keigwin, L. D.: Deep circulation of the north Atlantic over the last 200,000 years: geochemical evidence, Science, 218, 784–787, 1982.
Boyle, E. A.: The role of vertical chemical fractionation in controlling late Quaternary atmo-spheric carbon dioxide, J. Geophys. Res., 93, 15 701–15 714, 1988.
Boyle, E. A. and Keigwin, L. D.: Comparison of Atlantic and Pacific paleochemical records for
5
the last 215,000 years: changes in deep ocean circulation and chemical inventories, Earth Planet. Sci. Lett., 76, 135–150, 1985/86.
Boyle, E. A. and Keigwin, L. D.: North Atlantic thermohaline circulation during the last 20,000 years: link to high latitude surface temperature, Nature, 330, 35–40, 1987.
Broecker, W. S.: The oceanic CaCO3cycle, in: Treatise in Geochemistry, 6, edited by: Holland,
10
H. D. and Turekian, K. K., Elsevier, 539–549, 2003.
Broecker, W. S. and Henderson, G. M.: The sequence of events surrounding termination II and their implications for the cause of glacial-interglacial CO2 changes, Paleoceanography 13, 352–364, 1998.
Charles, C. D., Lynch-Steiglitz, J., Ninnemann, U., and Fairbanks, R. G.: Climate connections
15
between the hemisphere revealed by deep sea sediment core/ice core correlations, Earth Planet. Sci. Lett., 142, 19–27, 1996.
Clark, P. U., Pisias, N. G., Stocker, T. F., and Weaver, A. J.: The role of the thermohaline circulation in abrupt climate change, Nature, 415, 863–869, 2002.
Cortese, G., Abelmann, A., and Gersonde, R.: The last five glacial-interglacial transitions: A
20
high resolution 450,000-year record from the subantarctic Atlantic, Paleoceanography, 22, PA4203, doi:10.1029/2007PA001457, 2007.
Curry, W. B., Duplessy, J. C., Labeyrie, L. D., and Shackleton, N. J.: Changes in the distribution of δ(13)C of deep water CO2between the last glaciation and the Holocene, Paleoceanogra-phy, 3, 31–341, 1988.
25
Curry, W. B. and Lohmann, G. P.: Reduced advection into Atlantic Ocean deep eastern basins during last glacial maximum, Nature, 306, 577–580, 1983.
Curry, W. B. and Oppo, D. W.: Glacial water mass geometry and the distribution of δ(13)C of CO2 in the western Atlantic Ocean, Paleoceanography, 20, PA1017, doi:10.1029/2004PA001021, 2005.
30
Duplessy, J. C., Shackleton, N. J., Fairbanks, R. G., Labeyrie, L., Oppo, D., and Kallel, N.: Deepwater source variations during the last climatic cycle and their impact on the global deepwater circulation, Paleoceanography, 3, 343–360, 1988.
CPD
4, 667–695, 2008 SE Atlantic circulation during MIS-10 to 12 A. J. Dickson et al. Title Page Abstract Introduction Conclusions References Tables Figures ◭ ◮ ◭ ◮ Back CloseFull Screen / Esc
Printer-friendly Version Interactive Discussion
Duplessy, J. C., Shackleton, N. J., Matthews, R. K., Prell, W., Ruddiman, W. F., Caralp, M., and Hendy, C. H.: 13C record of benthic foraminifera in the last interglacial ocean: implications for the carbon cycle and the global deep water circulation, Quat. Res., 21, 225–243, 1984. Garzoli, S. L. and Gordon, A. L.: Origins and variability of the Benguela Current, J.Geophys.
Res., 101, 897–906, 1996.
5
Graham, D. W., Corliss, B. H., Bender, M. L., and Keigwin Jr., L. D.: Carbon and oxygen isotopic disequilibria of recent deep sea benthic foraminifera, Mar. Micropaleontol., 6, 483– 497, 1981.
Hall, I. R. and Becker, J.: Deep western Boundary Current variability in the subtropical North-west Atlantic during Marine Isotope Stages 12-10, Geochem. Geophy. Geosy., 8, Q06013,
10
doi:10.1029/2006GC001518, 2007.
Helmke, J. P. and Bauch, H. A.: Comparison of glacial and interglacial conditions between the polar and subpolar North Atlantic region over the last five climatic cycles, Paleoceanography, 18, 1036, doi:10.1029/2002PA000794, 2003.
Heslop, D. and Dekkers, M. J.: Spectral analysis of unevenly spaced climatic time series using
15
CLEAN: signal recovery and derivation of significance levels using a Monte-Carlo simulation, Phys. Earth Planet. Inter., 130, 103–116, 2002.
Hodell, D. A.: Late Pleistocene paleoceanography of the South Atlantic sector of the Southern Ocean: Ocean Drilling Program hole 704A, Paleoceanography, 8, 47–67, 1993.
Hodell, D. A., Charles, C. D., and Sierro, F. J.: Late Pleistocene evolution of the oceans
carbon-20
ate system, Earth Planet. Sci. Lett., 192, 109–124, 2001.
Hodell, D. A., Venz, K. A., Charles, C. D., and Ninnemann, U. S.: Pleistocene vertical car-bon isotope and carcar-bonate gradients in the South Atlantic sector of the Southern Ocean, Geochem. Geophy. Geosy., 4, 1004, doi:10.1029/2002GC000367, 2003a.
Hodell, D. A., Kanfoush, S., Venz, K. A., and Charles, C. D.: The Mid-Brunhes transition in ODP
25
sites 1989 and 1090 (Subantarctic South Atlantic), in: Earth’s climate and orbital eccentricity: the marine isotope stage 11 question, edited by: Droxler, A. W., Poore, R. Z., and Buckle, L. H., AGU Geophysical Monograph, 137, 113–129, AGU, 2003b.
Kroopnick, P.: The distribution of δ13C in the Atlantic Ocean, Earth Planet. Sci. Lett., 49, 469– 484, 1980.
30
Le, J. and Shackleton, N. J.: Carbonate dissolution fluctuations in the western Equatorial Pacific during the late Quaternary, Paleoceanography, 7, 21–42, 1992.
CPD
4, 667–695, 2008 SE Atlantic circulation during MIS-10 to 12 A. J. Dickson et al. Title Page Abstract Introduction Conclusions References Tables Figures ◭ ◮ ◭ ◮ Back CloseFull Screen / Esc
Printer-friendly Version Interactive Discussion
δ18O records, Paleoceanography, 20, PA1003, doi:10.1029/2004PA001071, 2005.
Loutre, M.-F. and Berger, A.: Marine Isotope Stage 11 as an analogue for the present inter-glacial, Global Planet. Change, 36, 209–217, 2003.
Lynch-Stieglitz, J., Adkins, J. F., Curry, W. B., Dokken, T., Hall, I. R., Herguera, J. C., Hirschi, J. J. M., Ivanova, E. V., Kissel, C., Marchal, O., Marchitto, T. M., McCave, I. N., McManus,
5
J. F., Mulitza, S., Ninnemann, U., Peeters, F., Yu, E. F., and Zahn, R.: Atlantic meridional overturning circulation during the last glacial maximum, Science, 316, 66–69, 2007.
Mackensen, A., Hubberton, H. W., Bickert, T., Fischer, G., and Futterer, D. K.: The δ13C in ben-thic foraminiferal tests of Fontbotia wuellerstorfi (Schwager) relative to the δ13C of dissolved inorganic carbon in Southern Ocean deep water: implications for glacial ocean circulation
10
models, Paleoceanography, 8, 587–610, 1993.
Mackensen, A., Rudolph, M., and Kuhn, G.: Late Pleistocene deep-water circulation in the subantarctic eastern Atlantic, Global Planet. Change, 30, 197–229, 2001.
Marchitto, T. M., Curry, W. B., and Oppo, D. W.: Millennial-scale changes in North Atlantic circulation since the last glaciation, Nature, 393, 557–561, 1998.
15
Marinov, I., Gnanadesikan, A., Toggweiler, J. R., and Sarmiento, J. L.: The Southern Ocean biogeochemical divide, Nature, 441, 964–967, 2006.
Martinez-Mendez, G., Zahn, R., Hall, I. R., Pena, L. D., and Cacho, I.: 345,000 year long multi-proxy records off South Africa document variable contributions of Northern versus Southern component water to the deep South Atlantic, Earth Planet. Sci. Lett., 267, 309–321, 2007.
20
Martrat, B., Grimalt, J. O., Shackleton, N. J., de Abreu, L., Hutterli, M. A., and Stocker, T. F.: Four climate cycles of recurring deep and surface water destabilizations on the Iberian margin, Science, 317, 502–507, 2007.
McCartney, M. S.: Subantarctic mode water, in: A voyage of Discovery, George Deacon 70th Anniversary Volume, edited by: Angel, M. V., Deep Sea Res. Suppl., 103–119, 1977.
25
McManus, J. F., Oppo, D. W., and Cullen, J. L.: A 0.5-million-year record of millennial-scale climate variability in the North Atlantic, Science, 283, 971–974, 1999.
McManus, J. F., Oppo, D. W., Cullen, J., and Healey, S.: Marine Isotope Stage 11 (MIS-11): Analog for Holocene and future climate?, in: Earth’s climate and orbital eccentricity: the marine isotope stage 11 question, edited by: Droxler, A. W., Poore, R. Z., and Buckle, L. H.,
30
AGU Geophysical Monograph, 137, 69–85, 2003.
Mortyn, P. G., Charles, C. D., Ninnemann, U. S., Ludwig, K., and Hodell, D. A.: Deep sea sedimentary analogues for the Vostok ice core, Geochem. Geophy. Geosy., 4, 8405,
CPD
4, 667–695, 2008 SE Atlantic circulation during MIS-10 to 12 A. J. Dickson et al. Title Page Abstract Introduction Conclusions References Tables Figures ◭ ◮ ◭ ◮ Back CloseFull Screen / Esc
Printer-friendly Version Interactive Discussion
doi:10.1029/2002GC000475, 2003.
Muller, P. J. and Fischer, G.: C37-alkenones as paleotemperature tool: fundamentals based on sediment traps and surface sediments from the South Atlantic Ocean, in: The South Atlantic in the Late Quaternary: Reconstruction of material budgets and current systems, edited by: Wefer, G., Mulitza, S., and Ratmeyer, V., Spring-Verlag, Berlin, 167–193, 2003.
5
Ninnemann, U. S. and Charles, C. D.: Changes in the mode of Southern Ocean circulation over the last glacial cycle revealed by foraminiferal stable isotope variability, Earth Planet. Sci. Lett., 201, 383–396, 2002.
Oppo, D. W., Fairbanks, R. G., and Gordon, A. L.: Late Pleistocene Southern Ocean δ13C variability, Paleoceanography, 5, 43–54, 1990.
10
Oppo, D. W. and Horowitz, M.: Glacial deep water geometry: South Atlantic benthic foraminiferal Cd/Ca and δ13C evidence, Paleoceanography, 15, 147–160, 2000.
Oppo, D. W. and Lehman, S. J.: Mid-depth circulation of the subpolar North Atlantic during the Last Glacial Maximum, Science, 259, 1148–1152, 1993.
Oppo, D. W., McManus, J. F., and Cullen, J. L.: Abrupt climate events 500,000 to 340,000 years
15
ago: evidence from subpolar North Atlantic sediments, Science, 279, 1335–1338, 1998. Peacock, S., Lane, E., and Restrepo, J. M.: A possible sequence of events
for the generalized glacial-interglacial cycle, Global Biogeochem. Cy., 20, GB2010, doi:10.1029/2005GB002448, 2006.
Petit, J. R., Jouzel, J., Raynaud, D., Barkov, N. I., Barnola, J.-M., Basile, I., Bender, M.,
Chap-20
pellaz, J., Davis, M., Delaygue, G., Delmotte, M., Kotlyakov, V. M., Legrand, M., Lipenkov, V. Y., Lorius, C., Pepin, L., Ritz, C., Saltzman, E., and Stievenard, M.: Climate and atmospheric history of the past 420,000 years from the Vostok ice core, Antarctica, Nature, 399, 429–436, 1999.
Pierre, C., Saliege, J. F., Urrutiaguer, M. J., and Giradeau, J.: Stable isotope record of the last
25
500 k.y. at site 1087 (Southern Cape Basin), in: Proceedings of the Ocean Drilling Program Scientific Results, edited by: Wefer, G., Berger, W. H., and Richter, C., 175, 1–22, 2001. Poli, M. S., Thunell, R. C., and Rio, D.: Millennial-scale changes in North Atlantic Deep Water
circulation during marine isotope stages 11 and 12: linkage to Antarctic climate, Geology, 28, 807–810, 2000.
30
Raymo, M. E., Ruddiman, W. F., Shackleton, N. J., and Oppo, D. W.: Evolution of Atlantic-Pacific
δ13C gradients over the last 2.5 m.y., Earth Planet. Sci. Lett., 97, 353–368, 1990.
productiv-CPD
4, 667–695, 2008 SE Atlantic circulation during MIS-10 to 12 A. J. Dickson et al. Title Page Abstract Introduction Conclusions References Tables Figures ◭ ◮ ◭ ◮ Back CloseFull Screen / Esc
Printer-friendly Version Interactive Discussion
ity dynamics in the pelagic central Benguela system inferred from the flux of carbonate and silicate organisms., J. Mar. Syst., 37, 259–278, 2002.
Ruddiman, W. F. and McIntyre, A.: Ice age thermal response and climatic role of the surface Atlantic Ocean 40◦N to 63◦N, Geol. Soc. Am. Bull., 95, 381–396, 1984.
Ruddiman, W. F.: Cold climate during the closest Stage 11 analog to recent Millennia, Quat.
5
Sci. Rev., 24, 111–1121, 2005.
Saunders, P. M. and King, B. A.: Oceanic fluxes on the WOCE A11 section, J. Phys. Oceanogr., 25, 1942–1958, 1994.
Saunders, P. M. and Thompson, S. R.: Transport, heat and freshwater fluxes within a diagnostic numerical model (FRAM), J.Phys. Oceanogr., 23, 452–464, 1993.
10
Schlitzer, R.: Ocean Data View,http://odv.awi.de, 2006.
Shackleton, N. J., Imbrie, J., and Hall, M. A.: Oxygen and carbon isotope record of east Pa-cific core V19-30:implications for the formation of deep water in the late Pleistocene North Atlantic, Earth Planet. Sci. Lett., 65, 233–244, 1983.
Shackleton, N. J., Wiseman, J. D. H., and Buckley, H. A.: Non-equilibrium isotopic fractionation
15
between seawater and planktonic foraminiferal tests, Nature, 242, 177–179, 1973.
Siegenthaler, U., Stocker, T. F., Monin, E., Luthi, D., Schwander, J., Stauffer, B., Raynaud, D., Barnola, J.-M., Fischer, H., Masson-Delmotte, V., and Jouzel, J.: Stable carbon cycle-climate relationship during the late Pleistocene, Science, 310, 1313–1317, 2005.
Siedler, G., Muller, T. J., Onken, R., Arhan, M., Mercier, H., King, B. A., and Saunders, P. M.:
20
The zonal WOCE sections in the South Atlantic, In: The South Atlantic: past and present circulation, edited by: Wefer, G., Berger, W. H., Siedler, G., and Webb, D. J., Springer-Verlag, Berlin, 83–104, 1996.
Sigman, D. M. and Boyle, E. A.: Glacial/interglacial variations in atmospheric carbon dioxide, Nature, 407, 859–869, 2000.
25
Sigman, D. M. and Haug, G. H.: The biological pump in the past, in: Treatise in Geochemistry, edited by: Holland, H. D. and Turekian, K. K., Elsevier, 6, 539–549, 2003.
Stephens, B. B. and Keeling, R. F.: The influence of Antarctic sea ice on glacial-interglacial CO2 variations, Nature, 404, 171–174, 2000.
Thunell, R. C., Poli, M.-S., and Rio, D.: Changes in deep and intermediate water properties
30
in the western North Atlantic during marine isotope stages 11-12: evidence from ODP Leg 172, Mar. Geol., 189, 63–77, 2002.
CPD
4, 667–695, 2008 SE Atlantic circulation during MIS-10 to 12 A. J. Dickson et al. Title Page Abstract Introduction Conclusions References Tables Figures ◭ ◮ ◭ ◮ Back CloseFull Screen / Esc
Printer-friendly Version Interactive Discussion
Paleoceanography, 14, 571–588, 1999.
Whitworth III, T. and Nowlin Jr., W. D.: Water masses and currents of the Southern Ocean at the Greenwich Meridian, J.Geophys. Res., 92(C6), 6462–6476, 1987.
Woodruff, F., Savin, S. M., and Douglas, R. G.: Biological fractionation of oxygen and carbon isotopes by recent benthic foraminifera, Mar. Micropaleontol., 5, 3–11, 1980.
5
Yu, E. F., Francois, R., and Bacon, M. P.: Similar rates of modern and last-glacial ocean ther-mohaline circulation inferred from radiochemical data, Nature, 379, 689–694, 1996.
Zahn, R., Winn, K., and Sarnthein, M.: Benthic foraminiferal δ13C and accumulation rates of or-ganic carbon: Uvigerina peregrine group and Cibicidoides wuellerstorfi, Paleoceanography, 1, 27–42, 1986.
10
Zeigler, K. E., Schwartz, J. P., Droxler, A. W., Shearer, M. C., and Peterson, L.: Caribbean carbonate crash in Pedro Channel at subthermoclinal depth during marine isotope stage 11: a case of basin to shelf carbonate fractionation?, in: Earth’s climate and orbital eccentricity: the marine isotope stage 11 question, edited by: Droxler, A. W., Poore, R. Z., and Buckle, L. H., AGU Geophysical Monograph, 137, 181–204, 2003.
CPD
4, 667–695, 2008 SE Atlantic circulation during MIS-10 to 12 A. J. Dickson et al. Title Page Abstract Introduction Conclusions References Tables Figures ◭ ◮ ◭ ◮ Back CloseFull Screen / Esc
Printer-friendly Version Interactive Discussion
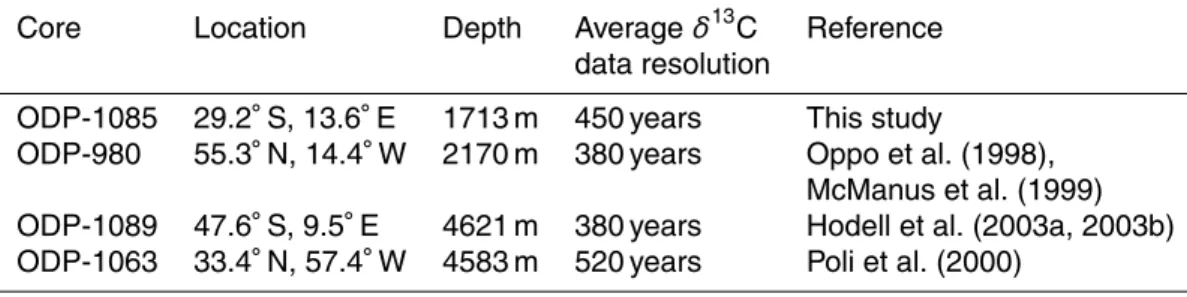
Table 1. Core sites with benthic δ13C data resolution ≤500 years used in this study.
Core Location Depth Average δ13C Reference data resolution
ODP-1085 29.2◦S, 13.6◦E 1713 m 450 years This study
ODP-980 55.3◦N, 14.4◦W 2170 m 380 years Oppo et al. (1998), McManus et al. (1999) ODP-1089 47.6◦S, 9.5◦E 4621 m 380 years Hodell et al. (2003a, 2003b) ODP-1063 33.4◦N, 57.4◦W 4583 m 520 years Poli et al. (2000)
CPD
4, 667–695, 2008 SE Atlantic circulation during MIS-10 to 12 A. J. Dickson et al. Title Page Abstract Introduction Conclusions References Tables Figures ◭ ◮ ◭ ◮ Back CloseFull Screen / Esc
Printer-friendly Version Interactive Discussion
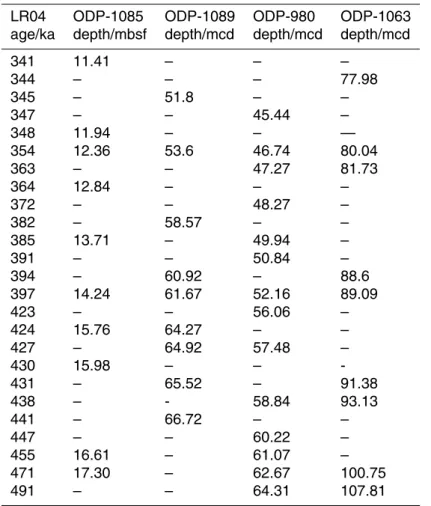
Table 2. Age control points for each core.
LR04 ODP-1085 ODP-1089 ODP-980 ODP-1063 age/ka depth/mbsf depth/mcd depth/mcd depth/mcd
341 11.41 – – – 344 – – – 77.98 345 – 51.8 – – 347 – – 45.44 – 348 11.94 – – — 354 12.36 53.6 46.74 80.04 363 – – 47.27 81.73 364 12.84 – – – 372 – – 48.27 – 382 – 58.57 – – 385 13.71 – 49.94 – 391 – – 50.84 – 394 – 60.92 – 88.6 397 14.24 61.67 52.16 89.09 423 – – 56.06 – 424 15.76 64.27 – – 427 – 64.92 57.48 – 430 15.98 – – -431 – 65.52 – 91.38 438 – - 58.84 93.13 441 – 66.72 – – 447 – – 60.22 – 455 16.61 – 61.07 – 471 17.30 – 62.67 100.75 491 – – 64.31 107.81
CPD
4, 667–695, 2008 SE Atlantic circulation during MIS-10 to 12 A. J. Dickson et al. Title Page Abstract Introduction Conclusions References Tables Figures ◭ ◮ ◭ ◮ Back CloseFull Screen / Esc
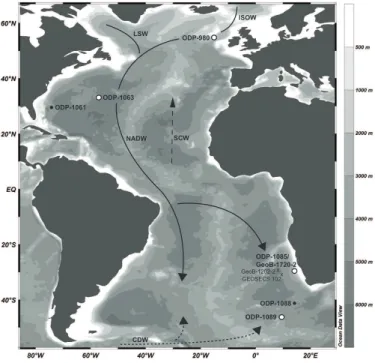
Printer-friendly Version Interactive Discussion ODP-1089 ODP-1085/ GeoB-1720-2 ODP-1063 ODP-1061 ODP-980 ODP-1088 NADW LSW ISOW CDW SCW GEOSECS 102 GeoB-1202-2 x x
Fig. 1. Locations of tuned benthic δ13Crecords (open circles) and other core sites mentioned in the text (filled circles), created using Ocean Data View (Schlitzer, 2006). The locations of geochemical profiles shown in Fig. 2 are plotted as crosses. Arrows schematically indicate synoptic deep-water flow paths of North Atlantic Deep Water (NADW), Circumpolar Deep Water (CDW, dashed line) and Southern Component Water (SCW, dashed line, comprising CDW and Antarctic Bottom Water) through the North and South Atlantic basins.
CPD
4, 667–695, 2008 SE Atlantic circulation during MIS-10 to 12 A. J. Dickson et al. Title Page Abstract Introduction Conclusions References Tables Figures ◭ ◮ ◭ ◮ Back CloseFull Screen / Esc
Printer-friendly Version Interactive Discussion GEOSECS 102 Oxygen / μmolkg-1 GEOSECS 102 PO4 / μmolkg-1 Depth / m SACW AAIW UCDW NADW LCDW ODP-1085 GeoB-1202-2 δ13C ΣCO 2 1 8 0 2 0 0 2 2 0 2 4 0 2 6 0 0 1 0 0 0 2 0 0 0 3 0 0 0 4 0 0 0 5 0 0 0 0 .0 0 .5 1 .0 1 .5 2 .0 2 .5 0 .6 0 .8 1 .0 1 .2 1 .4 1 .6 A B C
Fig. 2. Dissolved oxygen,phosphate, and δ13CPCO2profiles from GEOSECS 102 and GeoB-1202 (Bickert and Wefer, 1999), with delineations of the main deep water masses in the Cape Basin. The depth of studied core ODP-1085 is marked with a shaded horizontal band.
CPD
4, 667–695, 2008 SE Atlantic circulation during MIS-10 to 12 A. J. Dickson et al. Title Page Abstract Introduction Conclusions References Tables Figures ◭ ◮ ◭ ◮ Back CloseFull Screen / Esc
Printer-friendly Version Interactive Discussion Benthic δ 18O / VPDB Benthic δ 13 C / VPDB LR04 age / ka Fragments / g sand
MAR Fragments / g sand
(Fragments/cm 2 /yr) A B C 2 .5 3 .0 3 .5 4 .0 4 .5 5 .0 5 .5 -0 .6 -0 .4 -0 .2 0 .0 0 .2 0 .4 0 .6 0 .8 1 .0 1 .2 2 0 0 0 4 0 0 0 6 0 0 0 3 3 0 3 4 0 3 5 0 3 6 0 3 7 0 3 8 0 3 9 0 4 0 0 4 1 0 4 2 0 4 3 0 4 4 0 4 5 0 4 6 0 4 7 0 4 8 0 0 2 0 4 0 6 0 8 0 MIS-11
MIS-10 MIS-11 MIS-12
Fig. 3. Benthic isotope and foraminifera fragment data from ODP-1085. (A) Benthic δ18O data composed of C. wuellerstorfi and Uvigerina spp. data, the former corrected by +0.64‰.
(B) δ13C data composed of C. wuellerstorfi (circles) and Uvigerina spp. corrected by +0.9‰ (open squares). Benthic δ13C data from ODP-849 and ODP-1088 are plotted on their original timescales and are shown as a thin brown line and blue triangles respectively. (C) Abun-dance (black) and mass accumulation rate (orange) of foraminifera fragments per gram sand
>150 µm. Shaded vertical bands represent millennial-scale increases in ODP-1085 benthic
CPD
4, 667–695, 2008 SE Atlantic circulation during MIS-10 to 12 A. J. Dickson et al. Title Page Abstract Introduction Conclusions References Tables Figures ◭ ◮ ◭ ◮ Back CloseFull Screen / Esc
Printer-friendly Version Interactive Discussion Benthic δ 13C / VPDB LR04 age / ka ODP-1085 ODP-980 ODP-1063 ODP 980 - ODP 1085 benthic δ 13C / VPDB ODP-1089 A B C MIS-11
MIS-10 MIS-11 MIS-12
Benthic δ 18 O / VPDB 3 3 0 3 4 0 3 5 0 3 6 0 3 7 0 3 8 0 3 9 0 4 0 0 4 1 0 4 2 0 4 3 0 4 4 0 4 5 0 4 6 0 4 7 0 4 8 0 -1 .5 -1 .0 -0 .5 0 .0 0 .5 1 .0 1 .5 -1 .5 -1 .0 -0 .5 0 .0 0 .5 1 .0 1 .5 2 .5 3 .0 3 .5 4 .0 4 .5 5 .0 5 .5 LR04
Fig. 4. Sub-millennial resolution benthic carbon isotope data for Atlantic Ocean sites aligned
on the LR04 timescale. (A) Benthic δ18O (5-point running averages). (B) Benthic δ13C (5-point running averages). (C) North-South Atlantic δ13C gradient calculated from ODP-980–ODP-1085. Shaded vertical bands as in Fig. 3.
CPD
4, 667–695, 2008 SE Atlantic circulation during MIS-10 to 12 A. J. Dickson et al. Title Page Abstract Introduction Conclusions References Tables Figures ◭ ◮ ◭ ◮ Back CloseFull Screen / Esc
Printer-friendly Version Interactive Discussion
41 ka
100 ka
Power
Frequency (1/period)
95% confidenceODP 980 - ODP 1085 δ
13C
0 .0 0
0 .0 2
0 .0 4
0 .0 6
0 .0 0
0 .0 2
0 .0 4
0 .0 6
0 .0 8
0 .1 0
0 .1 2
0 .1 4
0 .1 6
Fig. 5. Spectral response of the ∆(980–1085)δ13C gradient, calculated using the MC-Clean 2.0 MATLAB algorithm of Heslop and Dekkers (2002). The horizontal line indicates the 95% confidence level across all frequencies estimated from a series of spectra generated from white noise applied to the input time series.
CPD
4, 667–695, 2008 SE Atlantic circulation during MIS-10 to 12 A. J. Dickson et al. Title Page Abstract Introduction Conclusions References Tables Figures ◭ ◮ ◭ ◮ Back CloseFull Screen / Esc
Printer-friendly Version Interactive Discussion -0 .5 0 .0 0 .5 1 .0 1 .5 2 .0 2 .5 1 6 0 1 8 0 2 0 0 2 2 0 2 4 0 2 6 0 2 8 0 3 0 0 0 1 0 2 0 3 0 4 0 5 0 3 3 0 3 4 0 3 5 0 3 6 0 3 7 0 3 8 0 3 9 0 4 0 0 4 1 0 4 2 0 4 3 0 4 4 0 4 5 0 4 6 0 4 7 0 4 8 0 0 2 0 4 0 6 0 8 0 ODP 1089 Foraminifera
fragmentation % (Hodell et al, 2003b)
ODP 1085 - ODP 1089 benthic 13C V ostok/EPICA Dome C CO 2 / ppm GeoB-1720-2 age / ka Age / ka 30 ppm 50 ppm A B
Fig. 6. Cape Basin benthic δ13C gradients and atmospheric CO2. (A) Intermediate-deep Cape Basin δ13C gradient calculated from ODP-1085–ODP-1089 (black), plotted alongside the spliced Vostok (open red circles)/EDC (open and closed red squares) CO2record on the EDC2 gas age timescale (Petit et al., 1999; Siegenthaler et al., 2005). The intermediate-deep
δ13C gradient calculated for the last 50,000 years from GeoB-1720-2–ODP-1089 is shown for comparison (open blue circles) on its own14C age-scale (Dickson et al., in prep., inset hori-zontal axis). The latter record has been positioned by aligning the steep deglacial decreases in δ13C, rather than orbital parameters (e.g. Ruddiman, 2005) as the objective is to compare the magnitude of change over the two terminations rather than the timing. (B) Foraminifera fragmentation record from ODP-1089 (Hodell et al., 2003b).