HAL Id: hal-00304087
https://hal.archives-ouvertes.fr/hal-00304087
Submitted on 9 Apr 2008HAL is a multi-disciplinary open access
archive for the deposit and dissemination of sci-entific research documents, whether they are pub-lished or not. The documents may come from teaching and research institutions in France or abroad, or from public or private research centers.
L’archive ouverte pluridisciplinaire HAL, est destinée au dépôt et à la diffusion de documents scientifiques de niveau recherche, publiés ou non, émanant des établissements d’enseignement et de recherche français ou étrangers, des laboratoires publics ou privés.
Why are estimates of global isoprene emissions so
similar (and why is this not so for monoterpenes)?
A. Arneth, R. K. Monson, G. Schurgers, Ü. Niinemets, P. I. Palmer
To cite this version:
A. Arneth, R. K. Monson, G. Schurgers, Ü. Niinemets, P. I. Palmer. Why are estimates of global isoprene emissions so similar (and why is this not so for monoterpenes)?. Atmospheric Chemistry and Physics Discussions, European Geosciences Union, 2008, 8 (2), pp.7017-7050. �hal-00304087�
ACPD
8, 7017–7050, 2008
Why are estimates of global isoprene emissions so similar? A. Arneth et al. Title Page Abstract Introduction Conclusions References Tables Figures ◭ ◮ ◭ ◮ Back Close
Full Screen / Esc
Printer-friendly Version
Interactive Discussion Atmos. Chem. Phys. Discuss., 8, 7017–7050, 2008
www.atmos-chem-phys-discuss.net/8/7017/2008/ © Author(s) 2008. This work is distributed under the Creative Commons Attribution 3.0 License.
Atmospheric Chemistry and Physics Discussions
Why are estimates of global isoprene
emissions so similar (and why is this not
so for monoterpenes)?
A. Arneth1, R. K. Monson2, G. Schurgers1, ¨U. Niinemets3, and P. I. Palmer4
1
Department of Physical Geography and Ecosystems Analysis, Geobiosphere Science Centre, Lund University S ¨olvegatan 12, 223 62, Lund, Sweden
2
Department of Ecology and Evolutionary Biology, and Cooperative Institute for Environmental Sciences, University of Colorado, Boulder, CO, 9 80309, USA
3
Institute of Agricultural and Environmental Sciences, Estonian University of Life Sciences, Kreutzwaldi 1, 51014, Tartu, Estonia
4
School of GeoSciences, University of Edinburgh, King’s Buildings, Edinburgh, UK Received: 29 February 2008 – Accepted: 17 March 2008 – Published: 9 April 2008 Correspondence to: A. Arneth (almut.arneth@nateko.lu.se)
ACPD
8, 7017–7050, 2008
Why are estimates of global isoprene emissions so similar? A. Arneth et al. Title Page Abstract Introduction Conclusions References Tables Figures ◭ ◮ ◭ ◮ Back Close
Full Screen / Esc
Printer-friendly Version
Interactive Discussion
Abstract
Emissions of biogenic volatile organic compounds (BVOC) are a chief uncertainty in calculating the burdens of important atmospheric compounds like tropospheric ozone or secondary organic aerosol, reflecting either imperfect chemical oxidation mecha-nisms or unreliable emission estimates, or both. To provide a starting point for a more
5
systematic discussion we review here global isoprene and monoterpene emission es-timates to-date. We note a surprisingly small variation in the predictions of global iso-prene emission rate that is in stark contrast with our lack of process understanding and the small number of observations for model parameterisation and evaluation. Most of the models are based on similar emission algorithms, using fixed values for the
emis-10
sion capacity of various plant functional types. In some studies these values are very similar, but they differ substantially in others. The models differ also broadly with regard to their representation of net primary productivity, method of biome coverage determi-nation and climate data. Their similarities with regard to the global isoprene emission rate would suggest that the dominant parameters driving the ultimate global estimate,
15
and thus the dominant determinant of model sensitivity, are the specific emission algo-rithm and isoprene emission capacity. Contrary to isoprene, monoterpene estimates show significantly larger model-to-model variation although variation in terms of leaf algorithm, emission capacities, the way of model upscaling, vegetation cover or cli-matology used in terpene models are comparable to those used for isoprene. From
20
our summary of published studies there appears to be no evidence that the terrestrial modelling community has been any more successful in “resolving unknowns” in the mechanisms that control global isoprene emissions, compared to global monoterpene emissions. Rather, the proliferation of common parameterization schemes within a large variety of model platforms lends the illusion of convergence towards a common
25
estimate of global isoprene emissions. This convergence might be used to provide optimism that the community has reached the “relief phase”, the phase when sufficient process understanding and data for evaluation allows for models to converge, when
ACPD
8, 7017–7050, 2008
Why are estimates of global isoprene emissions so similar? A. Arneth et al. Title Page Abstract Introduction Conclusions References Tables Figures ◭ ◮ ◭ ◮ Back Close
Full Screen / Esc
Printer-friendly Version
Interactive Discussion applying a recently proposed concept. We argue that there is no basis for this
appar-ent “relief” phase. Rather, we urge modellers to be bolder in their analysis to draw attention to the fact that terrestrial emissions, particularly in the area of biome-specific emission capacities, are unknown rather than uncertain.
1 Introduction 5
Isoprene (2-methyl-1,3-butadiene, C5H8) and monoterpenes (a diverse group of molecules made up of two isoprene units) are biogenic volatile hydrocarbons (BVOC) emitted from vegetation that are of widely recognized importance for atmospheric chemistry and climate. Their significance in the climate system arises from the large quantity emitted annually (e.g., the estimates of isoprene emissions summarised in
Ta-10
ble 1 are similar in magnitude to the emission of methane) and from their fast reactivity with tropospheric oxidants (Atkinson, 2000):
1. Isoprene and monoterpene oxidation products are important precursors for pho-tochemical ozone production, in reactions that require the presence of NOx. Con-versely, in conditions of high or very low ratio of BVOC to NOx, their atmospheric
15
reactions consume O3 (Atkinson and Arey, 2003; Derwent, 1995). O3 acts as a potent greenhouse gas in the troposphere with an anthropogenic radiative forcing of near equal magnitude to that of methane (IPCC, 2007). In addition, O3 is a pollutant and toxic for human beings, animals and plants; O3 causes not only a direct inhibition of crop and forestry yields (Ashmore, 2005), but may also exert
20
a significant indirect radiative forcing effect following a phytotoxically reduced ter-restrial carbon sink (Sitch et al., 2007). A number of studies have investigated the possible protective role against oxidative stress that BVOC may have (Loreto and Fares, 2007; Loreto and Velikova, 2001; Velikova et al., 2005) which so far has not been taken into account in global O3-carbon cycle-feedback calculations.
25
ACPD
8, 7017–7050, 2008
Why are estimates of global isoprene emissions so similar? A. Arneth et al. Title Page Abstract Introduction Conclusions References Tables Figures ◭ ◮ ◭ ◮ Back Close
Full Screen / Esc
Printer-friendly Version
Interactive Discussion on the tropospheric concentration of OH., thereby influencing the atmospheric
lifetime of methane. Reduced BVOC emissions increase the atmospheric oxida-tion sink strength for CH4 in atmospheric chemistry models, notably decreasing its atmospheric lifetime and hence concentrations. Since biochemical models cannot explain the low CH4 concentrations at the last glacial maximum (LGM)
5
compared to the pre-industrial atmosphere based on changes in wetland sources alone, greatly reduced LGM-BVOC emissions and CH4 lifetime helped to repro-duce this long-term trend in a number of studies (Adams et al., 2001; Valdes et al., 2005; Kaplan et al., 2006). It is plausible that over glacial-interglacial time scales changes in atmospheric sink strength need to be taken into consideration
10
for the interpretation of the ice-core methane records. However, the so-far unac-counted direct CO2-leaf isoprene interaction suggests a rather more conservative BVOC emissions trend from the LGM to pre-industrial conditions over this period: the relatively larger leaf emissions at low CO2levels offset the effects of reduced productivity and a cooler and drier climate which complicates efforts to predict
15
past dynamics in atmospheric CH4notably (Arneth et al., 2007a).
3. Formation of biogenic secondary organic aerosol (SOA) is a third process of rel-evance for atmospheric composition and climate in which BVOC play a key role. SOA affect radiative transfer through the atmosphere and act as cloud condensa-tion nuclei. Monoterpenes, sesquiterpenes and their oxidacondensa-tion products have for
20
some years been considered as an important precursor source, forming condens-able products that are required for SOA growth (Hoffmann et al., 1997; Kulmala, 2003). However, more recently isoprene oxidation products have also been iden-tified in SOA particles, and while SOA yield from isoprene may be low, its source strength and the gas-particle partitioning characteristics of its oxidation products
25
are efficient to the point where it is expected to promote SOA growth at higher altitudes and enhance the SOA formation from other sources (Claeys et al., 2004; Henze and Seinfeld, 2006).
ACPD
8, 7017–7050, 2008
Why are estimates of global isoprene emissions so similar? A. Arneth et al. Title Page Abstract Introduction Conclusions References Tables Figures ◭ ◮ ◭ ◮ Back Close
Full Screen / Esc
Printer-friendly Version
Interactive Discussion Given their central role in several important atmospheric processes, it is important
that we are capable of estimating the magnitude and dynamics in surface isoprene and monoterpene emissions. Regional and global BVOC estimates have to rely on simulation experiments since, on that scale, no observational constraints exist. As a rule, these experiments use bottom-up approaches with the exception of one top-down
5
model analysis driven by satellite remote-sensing information (see Table 1, Sect. 2). It comes as no surprise that model experiments addressing the current, past or future climate or health effects of global tropospheric O3 or SOA point with recurring regu-larity to the magnitude and spatial distribution of biogenic precursor emissions as one of the chief sources of uncertainty (e.g., Shindell et al., 2003; Stevenson et al., 2006;
10
Liao et al., 2006; Henze and Seinfeld, 2006). Considering this uncertainty the lack of a systematic assessment of the global simulation estimates is surprising, particularly since many of the global chemistry models need to adjust the “standard” emission es-timates of BVOC downward, at least in some regions, to permit reconciliation between chemistry calculations and ozone observations (Prather et al., 2001). It is a matter of
15
debate whether the requirement for this adjustment is a consequence of emission esti-mates being too high or whether it is related to shortcomings in the modelled chemical degradation and transport mechanisms, although over recent years a number of chem-istry models have learned to deal with higher BVOC emissions (Prather et al., 2001; Stevenson et al., 2006).
20
The purpose of this paper is to review the existing global isoprene emission esti-mates, discuss their variation and to summarise the chief uncertainties in the sim-ulations in terms of drivers and processes. We address the question whether the terrestrial modelling community has reached a degree of consensus on global iso-prene emissions that would clearly attribute the uncertainties in atmospheric chemistry
25
simulations to be dominated by unknown reaction pathways, reaction kinetics or tro-pospheric transport, and if so, why a similar case cannot be made for emissions of monoterpenes.
ACPD
8, 7017–7050, 2008
Why are estimates of global isoprene emissions so similar? A. Arneth et al. Title Page Abstract Introduction Conclusions References Tables Figures ◭ ◮ ◭ ◮ Back Close
Full Screen / Esc
Printer-friendly Version
Interactive Discussion
2 Approaches to model global isoprene and monoterpene emissions – an
overview
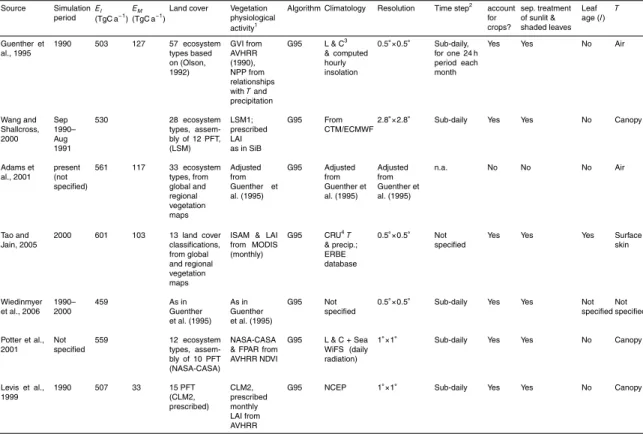
Table 1 provides a summary overview of annual global terrestrial isoprene and monoterpene emission estimates (EI,EM) that have been published over the last two
decades and includes present day as well as two pre-industrial estimates. The table is
5
exclusive in the sense that it lists only studies where in the case of isoprene, both light and temperature were considered as environmental constraints on emissions. Some earlier work (Mueller, 1992; Turner et al., 1991) used algorithms that varied isoprene emissions with temperature only. However, this approach is now known to be inad-equate since isoprene in leaves of green plants is synthesised via light-dependent
10
processes in the chloroplastic 1-deoxyxylulose-5-phosphate (DOXP) pathway that re-quires redox equivalents and ATP (Lichtenthaler et al., 1997).
Broadly, global isoprene (and monoterpene) simulations may be assembled into five groups:
(I) In the first, vegetation cover is prescribed from satellite remote sensing
informa-15
tion. Changes in vegetation phenology and physiological activity as reflected in leaf area index (LAI) and net primary productivity (NPP) influence emissions via variation in the amount of emitting leaf biomass, which is calculated from the re-mote sensing input (Guenther et al., 1995; Wang and Shallcross, 2000; Adams et al., 2001; Tao and Jain, 2005; Wiedinmyer et al., 2006). The vegetation’s capacity
20
to emit isoprene or monoterpenes is specified at standard environmental condi-tions on a leaf basis, and is assigned to a number of representative plant func-tional types (PFT, e.g., tropical broadleaf tree, boreal needleleaf tree) or ecosys-tem types (e.g., tropical rain forest). The instantaneous leaf emission rate is de-termined from modification of the emission capacity according to the prevailing
25
temperature and, for isoprene, light. In the seminal work presented by Guenther and co-workers (Guenther et al., 1993; Guenther et al., 1995; Guenther, 1997)
ACPD
8, 7017–7050, 2008
Why are estimates of global isoprene emissions so similar? A. Arneth et al. Title Page Abstract Introduction Conclusions References Tables Figures ◭ ◮ ◭ ◮ Back Close
Full Screen / Esc
Printer-friendly Version
Interactive Discussion widely applicable algorithms were developed as:
EI,M = EI,M∗ X γ, (1)
with (for isoprene)
γ = pαcL1Q 1 + α2Q2 expcT 1(T −TsRT ) sT CT 3+ exp cT 2(T −Tm) RTsT (1a)
and (for monoterpenes)
5
γ = exp(β(T − Ts)) (1b)
E∗
I andEM∗ are isoprene and monoterpene emission capacities (sometimes called
“basal emission rates”) referenced to the standard temperature (Ts) of 30◦C and (in case of isoprene) incident quantum flux density (Q) of 1000 µmol m−2s−1. T is leaf temperature, R is the gas constant. A number of empirical coefficients
10
describe the light response (α, CL1) or the activation and deactivation energies that define the steepness of the temperature response and the location of the temperature optimum (CT 1,CT 2, CT 3, Tm); their values are assumed to be iden-tical for plants from all environments. For the case of isoprene, the tempera-ture algorithm reflects the Arrhenius-type response of the enzyme isoprene
syn-15
thase to temperature (Monson et al., 1992), and the light algorithm the depen-dence of chloroplast electron transport on the absorbed quantum flux density. For monoterpenes, a single exponential function (with the steepness depending on
β) is used. This function describes the short-term (minutes to a few hours)
in-crease of the monoterpene emissions to temperature and is valid for plants that
20
store monoterpenes in special storage tissues or organs, as found, for instance, in many conifers. It describes the increase of monoterpene diffusion flux out of the
ACPD
8, 7017–7050, 2008
Why are estimates of global isoprene emissions so similar? A. Arneth et al. Title Page Abstract Introduction Conclusions References Tables Figures ◭ ◮ ◭ ◮ Back Close
Full Screen / Esc
Printer-friendly Version
Interactive Discussion leaves that is associated with higher diffusion gradient between the storage pool
and ambient atmosphere due to higher equilibrium monoterpene vapour pressure. The algorithm is inappropriate for species without specialised storage organs, in which monoterpene emissions are mainly controlled by the rate of monoterpene synthesis. In this latter instance, monoterpene emissions are controlled by bothT
5
and light in a similar way to isoprene emissions (Staudt and Seufert, 1995; Kuhn et al., 2004; Greenberg et al., 2003).
The global emission estimates derived by upscaling these leaf-algorithms to ecosystem types (Guenther et al., 1995) have been considered as a point of ref-erence in many of the more recent simulations, and will be refref-erenced in the
10
following as “G95”. For isoprene and monoterpene emission capacity, most of the modelling studies conducted to date use, either directly or indirectly, the parame-terisation of vegetation types provided in the G95 study.
(II) A second group of models have used the G95 temperature and light algorithms in combination with dynamic global vegetation models to simulate vegetation
dis-15
tribution, physiological activity and phenology rather than to prescribe it (Potter et al., 2001; Levis et al., 2003; Sanderson et al., 2003; Naik et al., 2004; Valdes et al., 2005; Kaplan et al., 2006; Lathi `ere et al., 2006). Some of these models contain mixed features, e.g., vegetation cover and variation in LAI are prescribed whereas vegetation productivity is calculated with a process-based model.
20
(III) One recent study presents a third approach that combines prescribed, fixed veg-etation cover with the use of canopy emission capacities that are expressed on ground area basis (MEGAN model, Guenther et al., 2006). These canopyE∗
I are
still largely based on leaf and branch enclosure data that are spatially extrapo-lated using a canopy environment model. The MEGAN model includes also an
25
extensive expansion of the G95 algorithms by empirically specifying effects of leaf age, soil moisture, and previous days’ temperature and light conditions. It requires a much wider range of standard conditions for the emission factor to be set
be-ACPD
8, 7017–7050, 2008
Why are estimates of global isoprene emissions so similar? A. Arneth et al. Title Page Abstract Introduction Conclusions References Tables Figures ◭ ◮ ◭ ◮ Back Close
Full Screen / Esc
Printer-friendly Version
Interactive Discussion yondT and Q that include standard LAI, foliage age classes, solar angle, relative
humidity, wind speed, soil moisture, and past weather conditions (Guenther et al., 2006).
(IV) One study approximated global emissions using a dynamic global vegetation model with a chloroplastic isoprene model that calculates emissions coupled to
5
photosynthetic electron transport rate (J) due to the consumption of
photosyn-thetic energy in the synthesis of volatile isoprenoids (Arneth et al., 2007a,b).
I = ε J αT, where α= (Ci−Γ
∗)
6(4.67Ci + 9.33Γ∗) (2)
Here,ε is the fraction of electrons available for isoprene production, Ci is the
leaf-internal CO2 concentration, and Γ∗ denotes the hypothetical CO2compensation
10
point in the absence of non-photorespiratory respiration. The difference between the temperature optimum of photosynthesis and isoprene synthase is estimated by T =exp[aτ (T −Ts)], with a τ=0.1 and T and Ts as in (Eq. 1). This model also
accounts for the seasonality ofE∗
I related to growing and senescing leaves and
effects of changing atmospheric CO2 concentration on emission estimates (not
15
included in Eq. (2)), details are provided in (Arneth et al., 2007b; Arneth et al., 2008). Leaf emission capacities were assigned per PFT such that the parameter
ε esulted in EI=EI∗ when environmental conditions approach the standard
con-ditions of G95. The simulated short-term (diurnal) response with this approach is similar in shape compared to the empirical algorithms in G95 (Arneth et al.,
20
2007b) – predictably so, since these mimic the hyperbolic increase of photosyn-thesis with light, and the Arrhenius-type temperature response of enzymatic activ-ity. The model was recently extended to monoterpenes, for which chloroplast pro-duction is calculated as in Eq. (2) and plant functional types are either assumed as emitting the produced monoterpenes directly in an “isoprene-like” fashion, or
ACPD
8, 7017–7050, 2008
Why are estimates of global isoprene emissions so similar? A. Arneth et al. Title Page Abstract Introduction Conclusions References Tables Figures ◭ ◮ ◭ ◮ Back Close
Full Screen / Esc
Printer-friendly Version
Interactive Discussion from storage organs (Schurgers et al., 20081). Release from storage in the latter
case is temperature-dependent in aQ10-fashion and the average residence time (τ) is thus modified from a standard value (at 30◦C,τ
s)
τ = τs[Q
(T −T s)/10
10 ]−1 (2a)
where Q10 is the ratio of the average residence time at temperature T1 and at
5
10◦C lower temperature.
(V) While all the above estimates rely on bottom-up approaches to estimate global totals, one analysis presented a top-down view by using inversions of remotely sensed properties (Shim et al., 2005). This approach is based on providing emis-sion constraints from the short-term variations of the high-yield isoprene oxidation
10
product formaldehyde (HCHO, derived from GOME) that depend on the isoprene source on the one hand, and the removal of HCHO oxidation by OH and photol-ysis on the other. If horizontal transport can be ignored, HCHO columns can be linearly related to isoprene emissions, with the regression coefficient determined from an atmospheric chemistry model (Palmer et al., 2003). In the Shim et al.
15
study, a priori and a posteriori estimates of isoprene emissions were produced for a number of selected regions using a combination of prescribed vegetation, G95 estimates of functional type emission capacities (for the a priori run of the model) and a chemical transport model.
3 Global isoprene estimates and model uncertainties: processes and drivers 20
In view of the diverse combination of emission algorithms, climatic input, description of vegetation cover and physiological activity, and simulation period (Table 1) the
an-1
Schurgers, G., Arneth, A., Holzinger, R., and Goldstein, A. H.: Process-based modelling of biogenic monoterpene emissions on local and global scale: Sensitivity to temperature and light, submitted to Atmos. Chem. Phys. Discuss, 2008.
ACPD
8, 7017–7050, 2008
Why are estimates of global isoprene emissions so similar? A. Arneth et al. Title Page Abstract Introduction Conclusions References Tables Figures ◭ ◮ ◭ ◮ Back Close
Full Screen / Esc
Printer-friendly Version
Interactive Discussion nual emission estimates and/or the regional emission patterns would be expected to
vary widely; yet, at least for isoprene this expectation emerges as a seemingly un-founded preconception. The average annual total of the studies summarised in Table 1 is 516 TgC a−1, with a standard deviation of little more than ten percent of this value (55 TgC a−1), three of the 14 estimates (Tao and Jain, 2005; Valdes et al., 2005;
Ar-5
neth et al., 2007a) lie clearly outside the range defined by the standard deviation (460– 570 TgC a−1). The small standard deviation is remarkable, considering that in model intercomparisons of, e.g., net primary productivity values still varied with a standard deviation of close to 20%, even after driving variables were made to converge as far as possible (Cramer et al., 1999). The overall span between the minimum and maximum
10
isoprene estimate is 189 TgC a−1which is nearly similar to the variation that can be in-troduced within a single model depending on variation in driving variables (Guenther et al., 2006). There is also little divergence regarding the chief source areas: those stud-ies that break down global emissions by region attribute the largest isoprene source, betweenc. 70 and 90% of global totals, to be located in tropical ecosystems. Curiously,
15
a similar picture does not emerge from simulation estimates of global monoterpene emissions. For this class of compounds, the variation around the mean is considerably larger, with estimates varying by a factor ofc. four between minimum and maximum,
rather than by 1.5 as for isoprene. The standard deviation 37 TgC a−1 is 40% of the mean (91 TgC a−1). Calculated global gross or net primary productivity (GPP, NPP) is
20
generally not stated in the published papers. This is unfortunate: LAI, GPP and NPP are closely linked and since they are a main factor influencing emissions it would be instructive to being able to judge how much of the variation in emission estimates might be due to variation in productivity.
With one exception, the above-referenced studies include the G95 algorithms, or
25
their modifications, as a core scheme to calculate the emission response to variation in temperature and (in case of isoprene) light. Putting forward an initial raison d’ ˆetre for the surprisingly small variation in isoprene emission estimates thus seems straight-forward: the short-term variation in leaf-level emissions (i.e., the emission algorithm)
ACPD
8, 7017–7050, 2008
Why are estimates of global isoprene emissions so similar? A. Arneth et al. Title Page Abstract Introduction Conclusions References Tables Figures ◭ ◮ ◭ ◮ Back Close
Full Screen / Esc
Printer-friendly Version
Interactive Discussion is of overriding importance, such that experiments that are based on the same
emis-sion algorithm result in fairly similar totals with some additional variation introduced by differences in vegetation cover, effects of environmental stress on emission capacity, leaf-to-canopy upscaling, or by accounting for effects of leaf age, seasonality and/or past weather. Given this line of reasoning, however, we are left with a puzzle. The
5
studies in Table 1 use climate inputs from a range of sources that differ significantly in their monthly or daily light, temperature and precipitation patterns, particularly in the tropical regions. They also derive land cover from different methods and differ con-sequently in the relative aerial extent of important regions like the tropical evergreen forests and savannas. Moreover, emissions are in some cases reported for single
10
years, and in others for periods of varying length. If the short-term weather response ofEI (and hence the algorithm used) indeed was of overriding importance then, con-sidering the very strong sensitivities ofEI to temperature and light, the different climate inputs should be the cause for sizeable discrepancy between the emission estimates. The observed lack of model variation must lead us to two alternative explanations: (1)
15
the sensitivity of the models to variance in the instantaneous light and temperature drivers is much less than anticipated, and we must look to other model components to explain their convergence towards similar values; (2) discrete model components like vegetation characteristics, climatology or emission algorithms have the potential to independently increase or decrease in compensatory fashion, such that the total net
20
emissions remains relatively constant.
Below we briefly summarise the possible chief sources of model uncertainties to shed some light on possible causes for model discrepancies, and for compensating processes. Where appropriate/possible, we use our own model results to illustrate the effects some of these potential causes might have.
25
3.1 Emission algorithm
While the sensitivities of isoprene and monoterpene emissions to light and temper-ature are high, the shapes of those sensitivities are similar among all global models
ACPD
8, 7017–7050, 2008
Why are estimates of global isoprene emissions so similar? A. Arneth et al. Title Page Abstract Introduction Conclusions References Tables Figures ◭ ◮ ◭ ◮ Back Close
Full Screen / Esc
Printer-friendly Version
Interactive Discussion deployed to date. The light and temperature algorithms require parameterisation with
regard to the coefficients α, CL1,β, CT 1,CT 2,CT 3 and Tm as described above.
How-ever, virtually all investigators adopt values for these parameters recommended in the original G95 paper, and there have been no further efforts to differentiate these param-eters according to plant functional type. Recently, there has been some recognition of
5
the role of seasonal leaf development or weather conditions accumulated over a pe-riod of few days to weeks in modifying these coefficients (cf., Sect. 3.3; Guenther et al., 2006; Ekberg et al., 20082), but there is little empirical basis on which to inform such modification. Therefore, for most studies in Table 1 there is little potential for the algorithms themselves to generate variance among model predictions; only to the
ex-10
tent that the temperature and light inputs vary, as described above. For isoprene, it has been shown that the short-term response of the G95 algorithms and those where emis-sions are linked to photosynthesis, do not result in significant differences in short-term emission responses on the leaf scale (Arneth et al., 2007b). For monoterpenes, a large difference was found when taking into account the fact that many broadleaf deciduous
15
emitters do not store monoterpenes over long-term in specific organs, but rather emit them in an “isoprene-like” fashion (Staudt and Seufert, 1995; Schurgers et al., 2008). Further differences related to the algorithm will emerge when transient responses of emissions to global change are investigated since on decadal and longer time scales the possible effect of a direct CO2-isoprene interaction that has been demonstrated in
20
a range of laboratory experiments becomes apparent. Such an effect could result in greatly changed past and future emission estimates (Arneth et al., 2007a). For con-temporary global totals the differences in emission algorithm alone should not be a chief cause of difference between models.
2
Ekberg, A., Arneth, A., Holst, T., Hayward, S., and Hakola, H.: Leaf isoprene emissions from two subarctic wetland sedges, Oecologia, in review, 2008.
ACPD
8, 7017–7050, 2008
Why are estimates of global isoprene emissions so similar? A. Arneth et al. Title Page Abstract Introduction Conclusions References Tables Figures ◭ ◮ ◭ ◮ Back Close
Full Screen / Esc
Printer-friendly Version
Interactive Discussion 3.2 Emission capacity
Everything else being equal, total emissions depend linearly on the specified emission capacities (Eqs. 1 and 2). In global studies, the values of E∗
I and EM∗ are generally
adopted from the recommendations by Guenther et al. (1995) that were based on ag-gregated leaf enclosure and atmospheric concentration measurements. These original
5
recommendations included default values for E∗
I and EM∗ for a number of ecosystem
classes for which by the mid 1990 field observations had not been available. Values for
E∗
I have been updated since, based on new observations that became available over
the last two decades, and converted from leaf area to a grid area (canopy) basis (Guen-ther et al., 2006). However, for most ecosystems and vegetation types measurements
10
of BVOC emissions are still scarce (Guenther et al., 2006). Assigning values of E∗
I to a certain PFT or vegetation class can easily cause large
variation in modelled emissions, since the vegetation categories and the number of plant functional types may differ. Due to the scarcity of measurements and the in-evitable lumping of a large number of plant species into functional groups, the value
15
to be used requires considerable subjective judgement by the researcher. The effect this may have can be illustrated by four studies that used relatively similar PFT cate-gories (Table 1). Two of the studies (Naik et al., 2004; Arneth et al., 2007a) used full DGVM features for simulation of potential natural land cover and vegetation physiolog-ical activity, the other two calculated physiologphysiolog-ical activity dynamphysiolog-ically but used a
pre-20
scribed vegetation cover including crop area (Levis et al., 2003; Lathi `ere et al., 2005). In these experiments the authors had chosen to assign in some cases very different values ofE∗
I. For instance, Levis et al. (2003) use the same value of 24µg(C) g(leaf
fo-liar mass)−1h−1 for tropical, temperate and boreal broadleaf deciduous and evergreen PFTs. With the exception of the two herbaceous C3and C4PFTs, Arneth et al. (2007a)
25
adopted the values of Naik et al. (2004), including anE∗
I of 45µg g−1h−1 for tropical,
temperate and boreal broadleaf deciduous vegetation. Lathiere et al. (2006) chose 24, 45 and 8µg g−1h−1 for the tropical, temperate and boreal broadleaf deciduous PFT,
ACPD
8, 7017–7050, 2008
Why are estimates of global isoprene emissions so similar? A. Arneth et al. Title Page Abstract Introduction Conclusions References Tables Figures ◭ ◮ ◭ ◮ Back Close
Full Screen / Esc
Printer-friendly Version
Interactive Discussion respectively. All four studies assigned a value of 24µg g−1h−1 to tropical evergreen
woody vegetation. The calculated annual isoprene totals varied merely between 412 and 507 TgC a−1, despiteE∗
I varying by a factor ofc. two (tropical broadleaf deciduous)
to more than five (boreal broadleaf deciduous). The large differences in the latter are of little consequence for global totals – all four studies attribute less than 5% of the
5
global emissions to boreal ecosystems due to the overall short growing season and relatively low temperatures- but they will become a key factor in regional experiments, e.g., when studying effects of BVOC emissions on secondary organic aerosol forma-tion (Tunved et al., 2006) or effects of global warming on northern latitude ecosystems (Ekberg et al., 2008). By contrast, PFT basal rates for tropical trees matter greatly not
10
only on regional but also on global scale with typically 70–80% of total isoprene emis-sions attributed to originate from tropical ecosystems. The use of a value of either 24 or 45µg g−1h−1 for tropical deciduous trees should therefore cause major model-to-model differences. In LPJ-GUESS, global totals are reduced by 15% when the lower
E∗
I is used to simulate emissions from tropical raingreen ecosystems (Schurgers,
un-15
published model results). Variation of 50 TgC a−1 or more could also be attributed to dissimilarE∗
I of herbaceous vegetation alone, despite the fact that grasses and herbs
are generally considered to have notably lower emission potential than woody vegeta-tion (see next paragraph), particularly the C4 grasses which to our knowledge so far have not been found to emit isoprene. Naik et al. (2004), for instance, excluded these
20
PFT as emitters and commented that their 50 TgC a−1difference compared to the G95 estimate could be accounted for by this effect. By contrast, Lathi `ere et al. (2006) as-signed relatively high emission potential to C3 and C4 natural grass vegetation (16 and 24µg g−1h−1) and calculate 90 Tg a−1from these two PFT. They discuss that their similar global total emissions relative to the estimates presented by Naik et al. was
25
due to compensation of their higher herbaceousE∗
I by their use of prescribed
vege-tation that included crop cover with low E∗
I. In LPJ-GUESS, an emission potential of
0 vs. 24µg g−1h−1 for C
4 grasses results in an overall decrease of emissions by 10% (Schurgers, unpublished model results). Clearly, differences in the way that modellers
ACPD
8, 7017–7050, 2008
Why are estimates of global isoprene emissions so similar? A. Arneth et al. Title Page Abstract Introduction Conclusions References Tables Figures ◭ ◮ ◭ ◮ Back Close
Full Screen / Esc
Printer-friendly Version
Interactive Discussion parameterise the emission capacities of various plant functional types can have a
rela-tively large influence on the ultimate estimate of global emissions. One reason that the model results reported to date reflect such striking similarities is that they have relied on parameterisation schemes that are highly adaptable with regard to the set emission capacities, reflecting the large uncertainty in the values chosen for a PFT.
5
3.3 Weather conditions of previous days and acclimation of emission capacities Several studies have demonstrated that foliar isoprene emission rate is not only deter-mined by present weather conditions but also by cumulative conditions over a period of several days prior. This effect has only been accounted for in one of the global emis-sion estimates (Guenther et al., 2006) postulating a linear dependency ofTmaxon past
10
240 h temperature, and an exponential relationship with past 24 and 240 h – in both cases relative to present temperature. Emissions depend also on past 24 and 240 h light conditions. The shape of these responses – and the required complexity in the algorithm – is highly uncertain. It could be argued that disregarding past weather con-ditions would be of fairly small influence averaged over the course of a year, since they
15
will lead to underestimation at some, and overestimation during other parts of the year. This has been found for a local study at a subarctic wetland (Ekberg et al., 2008). But the short-term variation in emission capacity should not be ignored when emissions are linked to atmospheric chemistry calculations where a high temporal resolution is required. On the global scale, Tao and Jain (2005) report annual emissions similar to
20
Guenther et al. (2006), using the MEGAN emission factors but excluding short-term weather modifications. The inclusion of past temperature regimes as a modelled effect on the isoprene emission capacity is currently based on only one study which inves-tigated the response ofTmax to growth temperature at the leaf level with aspen trees (Monson et al., 1992). Thus, it is unclear at present how a broader consideration of
25
these effects can improve projections of emissions, or the degree to which its consid-eration will cause model projections to diverge from one another. As emphasised by Guenther et al. (2006), simulations that include the effects of past weather will lead to
ACPD
8, 7017–7050, 2008
Why are estimates of global isoprene emissions so similar? A. Arneth et al. Title Page Abstract Introduction Conclusions References Tables Figures ◭ ◮ ◭ ◮ Back Close
Full Screen / Esc
Printer-friendly Version
Interactive Discussion an enhanced rate of emissions in the future, since not only “present” but also “past”
temperatures in warmer climate scenarios will change. There is clearly room for fur-ther development as to how representative species of various plant functional types respond with regard to Tmax and past temperature conditions, and the effect of such responses on model projections.
5
3.4 Vegetation cover
Although some C3 grasses, sedges or herbaceous vegetation emit notable amounts (Kesselmeier and Staudt, 1999; Bai et al., 2006; Ekberg et al., 2008), by far the largest proportion of isoprene emission originates from woody vegetation. Azolla, a highly emitting fern is frequently found growing alongside non-emitting rice in aquaculture. A
10
small number of agriculturally important species have high isoprene emission rates, for instance velvet bean or tree-crops like poplar, willow, eucalypt and oil palm, but most of the widely planted crop species are relatively insignificant in terms of their isoprene and monoterpene emission rates (Kesselmeier and Staudt, 1999). Correspondingly, emission capacities specified for agricultural ecosystems tend to be relatively low, and
15
where annual crops replace natural forest ecosystems rather than natural grasslands, a significant difference in simulated emissions is to be expected.
Isoprene emission estimates for Europe differed by a factor of three for potential natural forest cover vs. real forested area (Arneth et al., 2008). Lathiere et al. (2006) report reduction of global isoprene emissions by nearly 30% in a simulation where the
20
two tropical PFTs had been replaced with tropical grasses and crops, even thoughE∗
I
of the former was assigned a similar value to that of the tropical tree PFT. Despite the clear differences that emerge in these experiments, the studies cited in Table 1 do not indicate a systematic land-cover effect that might override other model-to-model differ-ences. Some of the estimates using potential natural vegetation cover, and present
25
productivity and climate are lower or close to the average of all studies (Arneth et al., 2007a; Naik et al., 2004; Sanderson et al., 2003). Two studies that were performed using potential natural vegetation cover but pre-industrial climate and productivity were
ACPD
8, 7017–7050, 2008
Why are estimates of global isoprene emissions so similar? A. Arneth et al. Title Page Abstract Introduction Conclusions References Tables Figures ◭ ◮ ◭ ◮ Back Close
Full Screen / Esc
Printer-friendly Version
Interactive Discussion at the upper end of the range presented in Table 1 (Valdes et al., 2005; Kaplan et
al., 2006), with estimates of similar magnitude to some of the studies that accounted for cultivated land with non-woody crops that are low isoprene emitters (Tao and Jain, 2005; Potter et al., 2001). Overall, there appears to be a discrepancy between how intuition informs us about the effects of model specification of vegetation cover on the
5
projected global isoprene emission rate, and what actually emerges from the model runs. From our analysis, the sensitivity of model performance to spatially-prescribed vegetation cover schemes is lower than anticipated. It is possible that compensa-tion occurs within the composicompensa-tion of specified biomes with regard to specific plant functional types that vary in their associated isoprene emission capacities. However,
10
without more specific information on how each biome or vegetation cover class is com-posed in each model it is difficult to take this component of the analysis further.
3.5 Leaf area index and leaf to canopy upscaling
For a given vegetation cover large variations in emissions can be expected from the prescribed or calculated leaf area index and specific leaf area which arises from the
15
dependence ofEI orEM on total canopy foliage (Guenther et al., 1995). Differences to the G95 isoprene prediction of 503 TgC a−1were thus discussed in light of differences in estimated seasonality of foliar area density, particularly in tropical drought-deciduous ecosystems (Potter et al., 2001) or overall lower leaf biomass (Naik et al., 2004). Within one model, annual emissions have been shown to deviate from −11% to +29% around
20
a standard simulation, depending on the specified LAI (Guenther et al., 2006).
Due to the dependence of isoprene emissions on light, the total amount of radiation absorbed by the canopy, naturally, was also found to have a large effect on the total emissions estimates (Lathiere et al., 2006). The number of horizontal layers in the canopy influenced emissions only but little in some studies (Guenther et al., 1995), but
25
this observation depends on the type of the radiative transfer model used. For models that use the fraction of light absorbed by the canopy (fQ) for scaling rather than multiply leaf emissions by LAI, a critical step is to convert incident quantum flux density of
ACPD
8, 7017–7050, 2008
Why are estimates of global isoprene emissions so similar? A. Arneth et al. Title Page Abstract Introduction Conclusions References Tables Figures ◭ ◮ ◭ ◮ Back Close
Full Screen / Esc
Printer-friendly Version
Interactive Discussion 1000µmol m−2s−1that is used for specifyingE∗
I into the equivalentfQ. In LPJ-GUESS,
emissions vary proportionally to assumedfQ values under standard conditions, which introduces considerable uncertainty into the calculations; at this stage a value of 0.35 is used which is analogous to the assumption that a leaf close to the top of the canopy has aγ of unity when Q=1000 µmol m−2s−1(Guenther et al., 1999).
5
For canopy temperature, the crucial aspect is whether air or canopy temperature is used, particularly in canopies that have a high boundary layer resistance and low transpiration rate (Monteith and Unsworth, 1990). The potentially high sensitivity of isoprene or monoterpene emissions to the temperature specification scheme is due to the exponential dependence of emission rate on temperature. The global emission
10
estimates summarised in Table 1 used a range of temperatures, some assuming air temperature to approximate canopy temperature, some including a leaf energy balance scheme in their canopy vertical transfer model, while others are based on skin surface (at the surface-atmosphere interface) temperature. The latter may exceed canopy tem-perature significantly, and a 2◦C cap for the surface to air temperature difference was
15
imposed e.g., by Lathi `ere et al. (2006) but not so by Tao and Jain (2005). Lathi `ere et al. (2006) found that increasing the average global surface temperature by 1◦C led to an increase of isoprene emissions by 11%. In LPJ-GUESS, the emissions are calcu-lated based on a leaf energy balance model (Schurgers et al., 2008) and annual totals vary by less than 10% between years that differ in average temperature of c. 1◦C during
20
the period 1981–2000 if CO2 concentration is kept constant (Schurgers, unpublished model results). Guenther et al. (2006) draw attention to the fact that simulations are less sensitive to air temperature variation if the model uses leaf temperature as the ac-tual driver. This arises from the fact that leaf temperature is influenced by conductance (and hence soil moisture), radiation absorbed by the leaf and the assumed boundary
25
ACPD
8, 7017–7050, 2008
Why are estimates of global isoprene emissions so similar? A. Arneth et al. Title Page Abstract Introduction Conclusions References Tables Figures ◭ ◮ ◭ ◮ Back Close
Full Screen / Esc
Printer-friendly Version
Interactive Discussion 3.6 Simulation period and climatology used
Keeping in mind the strong dependence of emissions on temperature it would seem to follow logically that the average climate during the period of simulation should have a sizeable impact on emissions. For a 12-yr simulation, Lathi `ere et al. (2006) calculated (at constant CO2) a range in global isoprene emission rates from 435–478 TgC a−1,
5
with a positive correlation between isoprene emissions and globally averaged air tem-perature. Over a period of 20 yr the interannual variation in emission was largely due to climate variability in the study of Naik et al. (2004; coefficient of variation over the sim-ulation period was 2.5% for isoprene, 4.1% for monoterpenes), much less so than in variation in productivity in response to atmospheric CO2levels. Levis et al. (2003) found
10
a variation of 5% of annual global averages in ten years while Guenther et al. (2006) reported variation of −14 to +13% around the standard run for a range of 20th cen-tury climatologies covering four to 80 yr. Global annual totals in LPJ-GUESS vary by 25 TgC a−1 between the coolest and the warmest year within the period 1981–2000 when calculated with the CRU climatology. This variation includes not only the
tem-15
perature and light effect on emissions but also that on productivity and leaf area index. Clearly, the standard deviation ofc. 50 TgC a−1 of published estimates to date could therefore be well accounted for by differences in the climatology used, whether or not the output is for a single year or a several-year period, or whether or not canopy tem-perature is used to drive simulations.
20
3.7 Leaf developmental stage
In newly developing leaves, the capacity to emit isoprene lags behind the capacity to assimilate CO2(Kuzma and Fall, 1993). The length of this lag phase depends on the growth temperature and may exceed ten days (Wiberley et al., 2005). For senescing leaves, a decline in emission capacity has been found (Monson et al., 1994). Some
25
global models account for this effect, either by assigning younger and older leaves lower emission capacities (Guenther et al., 2006; Lathi `ere et al., 2006), or modelling
ACPD
8, 7017–7050, 2008
Why are estimates of global isoprene emissions so similar? A. Arneth et al. Title Page Abstract Introduction Conclusions References Tables Figures ◭ ◮ ◭ ◮ Back Close
Full Screen / Esc
Printer-friendly Version
Interactive Discussion emission capacity in deciduous trees as a function of growing degree day temperature
sums (Arneth et al., 2007b). Both approaches lower emissions somewhat compared to models that do not account for this but the overall global scale effect should be small. The seasonality of emissions as represented in LPJ-GUESS (Arneth et al., 2007b; Schurgers et al., 2008) reduces the estimates on the global scale by little more than 5%
5
but effects on regional scales are much larger. In the current version of LPJ-GUESS, these seasonally varying estimates are restricted to deciduous PFTs.
3.8 Top-down constraints for emission models
A number of previous studies have shown that clear-sky space-borne formaldehyde (HCHO) columns can be used to quantitatively test current understanding of isoprene
10
emissions on regional to continental spatial scales (e.g., Chance et al., 2000; Palmer et al., 2001; Palmer et al., 2003; Shim et al., 2005; Abbot et al., 2003). Most of these studies have used HCHO column data from the Global Ozone Monitoring Experiment (GOME) satellite instrument aboard the European ERS-2 satellite launched in 1995 or – more recently – from the newer Ozone Monitoring Instrument (OMI) space-borne
15
sensor aboard the NASA Aura satellite (Millet et al., 2006). The underlying idea is that because HCHO is generally a product of VOC oxidation, variations in HCHO col-umn can provide information to map emissions of parent VOCs. The efficacy of this top-down approach relies on 1) the parent VOC having a sufficiently short lifetime such that variations in HCHO columns can be related to local VOC emissions and 2) the
par-20
ent VOC having a relatively high yield of HCHO. In the absence of horizontal transport, HCHO columns can be linearly related to VOC emissions, largely reflecting isoprene, the linear regression coefficients of which can be determined using an atmospheric chemistry model (Palmer et al., 2003). Horizontal transport smears the local relation-ship between VOC emissions and HCHO columns, the extent of which is determined
25
by wind speed and the time-dependent yield of HCHO from the VOC oxidation (Palmer et al., 2003). Aside from isoprene, other reactive biogenic VOCs, such as monoter-penes, also have short atmospheric lifetimes but they quickly produce acetone with a
ACPD
8, 7017–7050, 2008
Why are estimates of global isoprene emissions so similar? A. Arneth et al. Title Page Abstract Introduction Conclusions References Tables Figures ◭ ◮ ◭ ◮ Back Close
Full Screen / Esc
Printer-friendly Version
Interactive Discussion high yield that has an atmospheric lifetime of weeks and consequently slows down the
production of HCHO (Palmer et al., 2006). Long-lived VOCs such as methane and methanol are the largest global sources of HCHO but their atmospheric lifetimes are such that they contribute only to its slowly-varying background levels.
Estimation of isoprene emissions from observed HCHO columns using the linear
re-5
gression approach relies on prior assumptions associated with the oxidant chemistry relating isoprene and HCHO, subject to considerable uncertainty particularly in environ-ments with low-nitrogen oxide concentrations (Palmer et al., 2006). Regional studies using this approach generally demonstrate that isoprene emission derived from HCHO are broadly consistent with current understanding of the spatial and temporal
distri-10
butions of isoprene, but also some significant differences. For North America, early work showed that the magnitude and distribution of GOME-derived isoprene emis-sions were more consistent with in situ measurements than either the (G95 based) GEIA or BEIS2 isoprene inventories (Palmer et al., 2003). Later work showed that the seasonal and year-to-year variability was consistent with MEGAN, but GOME isoprene
15
emissions were higher (lower) at the beginning (end) of the growing season (Abbot et al., 2003; Palmer et al., 2006). GOME-derived isoprene emissions over south and east Asia (49±26 TgC a−1) were similar to those from MEGAN (46 TgC a−1), but MEGAN overestimated emissions in the tropics and underestimated emissions in China, with important implications for ozone air quality (Fu et al., 2007). Analysis of GOME HCHO
20
over tropical South America also concluded that MEGAN overestimated tropical iso-prene emissions (25%) and was only broadly consistent with the predicted spatial and temporal variations (Barkley et al., 20083) with better agreement in the dry season.
The study by Shim et al. (2005) currently represents the only global estimation of isoprene emissions using HCHO columns, in which they used an inversion approach
25
to fit model estimates for biogenic and pyrogenic emissions to GOME observations
3
Barkley, M. P., Palmer, P. I., Kuhn, U., Kesselmeier, J., Chance, K., Kurosu, T. P., Martin, R. V., Helmig, D., and Guenther, A.: Net ecosystem fluxes of isoprene over tropical South America inferred from GOME observations of HCHO columns, J. Geophys. Res., in review, 2008.
ACPD
8, 7017–7050, 2008
Why are estimates of global isoprene emissions so similar? A. Arneth et al. Title Page Abstract Introduction Conclusions References Tables Figures ◭ ◮ ◭ ◮ Back Close
Full Screen / Esc
Printer-friendly Version
Interactive Discussion of HCHO. This study used global a priori isoprene emissions of 375 TgC a−1 and
cal-culated global annual a posteriori isoprene emissions of 566 TgC a−1, an increase of 50%. The outcome of this work is sensitive to the balance of uncertainties assumed for the prior emissions and the observed HCHO columns. Without a more rigorous estima-tion of emissions and HCHO column uncertainties, or a sensitivity analysis of assumed
5
uncertainties, it is difficult to determine the robustness of the a posteriori estimate. The inversion estimated emissions over relatively coarse spatial regions, reflecting in part the horizontal resolution of the GOME data (40×320 km2), so that the spatial distri-bution of a posteriori emissions within these regions is insensitive to the data. Most importantly, recent analysis of HCHO columns over South America has shown that
10
fires are the largest source of HCHO across the region, often overlapping in time and space with biogenic sources (Barkley et al., 2008). It is not possible to separate these two sources without using coincident satellite measurements of nitrogen dioxide (large biomass burning source but small biogenic source) and firecounts which are subject to their own uncertainties. These considerations combined suggest not only that the
15
Shim et al. (2005) isoprene estimates may need to be revisited but demonstrate also the difficult challenges facing the modelling community as it tries to reduce uncertain-ties in various components of the models conditioned on a narrow base of previous emission capacity estimates.
4 Illusion or chaos? 20
The above examples clearly identify how a small variation in either the emission model drivers or the process representation can, without difficulty, introduce a variation in the calculated annual isoprene totals that is equal to or larger than the standard deviation around the mean of estimates to date. The single most important parameterisation is the assignment of PFT emission capacities, but variation in model process description
25
and environmental drivers can each also affect global totals easily by 10% or more. Variation caused by each of these factors can move estimates both up or down
com-ACPD
8, 7017–7050, 2008
Why are estimates of global isoprene emissions so similar? A. Arneth et al. Title Page Abstract Introduction Conclusions References Tables Figures ◭ ◮ ◭ ◮ Back Close
Full Screen / Esc
Printer-friendly Version
Interactive Discussion pared to the unknown “true” global total and a pattern of compensation among model
experiments can therefore be expected. We question here, however, why such a com-pensation should always take place, and why it should be present for isoprene but not for monoterpenes. With no observational constraints on global emissions should one not much rather expect some simulations to diverge rather than converge, resulting in
5
an overall much greater difference to the “truth”? Furthermore, what causes the much larger variation of global monoterpene emissions, with estimates varying by a factor of four between minimum and maximum even when effects of different algorithms are not included (Schurgers et al., 2008), rather than by a factor of 1.46 as for isoprene? There is no apparent reason why the spread in monoterpene emission rates should
10
be so much larger compared to isoprene emission rates. Both are based on simi-lar model set experiments and differences in vegetation type, physiological activity or canopy characteristics should have very similar effects for isoprene and monoterpene emissions; the studies listed in Table 1 also do not differ any more in terms of their assigned emission capacities of monoterpenes than they do for isoprene.
15
In a recent publication, Le Qu ´er ´e (2006) identified three chief phases in model devel-opment, “the illusion, the chaos and the relief”. Adopting her views that were developed for carbon cycle and climate modelling we argue that the modelling of BVOC emissions is in the illusion phase, at least in the case of isoprene: lack of observations prevent in-dependent model evaluation and the models have the propensity to not depart greatly
20
from previously published estimates. Whereas in the case of monoterpenes, simula-tions appear to have moved readily into the chaos phase where model results diverge freely, reflecting more candidly the lack of observational constraints and of true pro-cess understanding. One may speculate how the perceived overall lesser importance of monoterpenes in chemistry simulations may support the larger openness towards
25
variation between models since the pressure of confirming previously published esti-mates is lower.
Inversions of remote sensing information can provide only a top-down modelling constraint on BVOC emissions rather than an observation. Therefore, while global constraints on emissions are absent we encourage the modelling community to
ACPD
8, 7017–7050, 2008
Why are estimates of global isoprene emissions so similar? A. Arneth et al. Title Page Abstract Introduction Conclusions References Tables Figures ◭ ◮ ◭ ◮ Back Close
Full Screen / Esc
Printer-friendly Version
Interactive Discussion plore the chaos phase in the simulations more freely. Without doing so the wrong
impression of isoprene modelling entering the phase of “relief” may emerge. The no-tion that today’s process-understanding and representano-tion of basic concepts in models as well as observational support of model output could be sufficient to support a con-sensus on global emission totals and their response to global change is unfounded;
5
this state of affairs is counterproductive: a phase of exploration in models can only be regarded as highly beneficial, for model development but more importantly, for reveal-ing the urgent need of further observations. The “race ahead” of modellers beyond observational evidence (Monson et al., 2007) could therefore be regarded as a fruitful exercise. Critically, however, modellers must resist the temptation to tune their models
10
to perceived “truths” and be ready to explore and publish model sensitivities to a much larger degree, and to explore model-to-model differences more systematically in inter-comparisons. This approach would rapidly lead to the realisation that global terrestrial emissions are an unknown rather than an uncertain number.
Acknowledgements. This work is supported by a European Commissions 6th FP Marie Curie
15
Excellence Team grant, by the Swedish Research Council and by the Human Frontier Science Programme. The authors acknowledge discussions at the VOCBAS science meeting in Mont-pellier, and the Marie Curie iLEAPS conference in Helsingborg to stimulate the development of this manuscript.
References 20
Abbot, D. S., Palmer, P. I., Martin, R. V., Chance, K. V., Jacob, D. J., and Guenther, A.: Seasonal and interannual variability of North American isoprene emissions as deter-mined by formaldehyde column measurements from space, Geophys. Res. Lett., 30, 1886, doi:10.1029/2003GL017336, 2003.
Adams, J. M., Constable, J. V. H., Guenther, A. B., and Zimmerman, P.: An estimate of
nat-25
ural volatile organic compound emissions from vegetation since the last glacial maximum, Chemosphere, 3, 73–91, 2001.
Arneth, A., Miller, P., Scholze, M., Hickler, T., Smith, B., and Prentice, I. C.: CO2 inhibition of global terrestrial isoprene emissions: Potential implications for atmospheric chemistry, Geophys. Res. Lett., 34, L18813, doi:10.1029/12007GL030615, 2007a.
ACPD
8, 7017–7050, 2008
Why are estimates of global isoprene emissions so similar? A. Arneth et al. Title Page Abstract Introduction Conclusions References Tables Figures ◭ ◮ ◭ ◮ Back Close
Full Screen / Esc
Printer-friendly Version
Interactive Discussion Arneth, A., Niinemets, ¨U., Pressley, S., B ¨ack, J., Hari, P., Noe, S., Prentice, I. C., Serc¸a, D.,
Hickler, T., and Wolf, A.: Process-based estimates of terrestrial ecosystem isoprene emis-sions: Incorporating the effects of a direct CO2-isoprene interaction, Atmos. Chem. Phys., 7,
31–53, 2007b,
http://www.atmos-chem-phys.net/7/31/2007/.
5
Arneth, A., Schurgers, G., Miller, P., and Hickler, T.: Effects of species composition, land surface cover, CO2 concentration and climate on isoprene emissions from European forests, Plant Biology, doi:10.1055/s-2007-965247, 2008.
Ashmore, M. R.: Assessing the future global impacts of ozone on vegetation, Plant Cell Envi-ron., 28, 949–964, 2005.
10
Atkinson, R.: Atmospheric chemistry of VOCs and NOx, Atmos. Environ., 34, 2063–2101, 2000.
Atkinson, R. and Arey, J.: Gas-phase tropospheric chemistry of biogenic volatile organic com-pounds: A review, Atmos. Environ., 37, 197–219, 2003.
Bai, J., Baker, B., Liang, B., Greenberg, J., and Guenther, A.: Isoprene and monoterpene
15
emissions from an inner Mongolia grassland, Atmos. Environ., 40, 5753–5758, 2006. Chance, K., Palmer, P. I., Spurr, R. J. D., Martin, R. V., Kurosu, T. P., and Jacob, D. J.: Satellite
observations of formaldehyde over north America from GOME, Geophys. Res. Lett., 27, 3461–3464, 2000.
Claeys, M., Graham, B., Vas, G., Wang, W., Vermeylen, R., Pashynska, V., Cafmeyer, J.,
20
Guyon, P., Andreae, M. O., Artaxo, P., and Maenhaut, W.: Formation of secondary organic aerosols through photooxidation of isoprene, Science, 303, 1173–1176, 2004.
Cramer, W., Kicklighter, D. W., Bondeau, A., Iii, B. M., Churkina, G., Nemry, B., Ruimy, A., Schloss, A. L., and Intercomparison, T. P. O. F. T. P. N. M.: Comparing global models of terrestrial net primary productivity (NPP): Overview and key results, Global Change Biol., 5,
25
1–15, doi:10.1046/j.1365-2486.1999.00009.x, 1999.
Derwent, R. G.: Air chemistry and terrestrial gas emissions: A global perspective, Philos. T. R. Soc. A, 351, 205–217, 1995.
Fu, T. M., Jacob, D. J., Palmer, P. I., Chance, K., Wang, Y. X., Barletta, B., Blake, D. R., Stanton, J. C., and Pilling, M. J.: Space-based formaldehyde measurements as constraints on volatile
30
organic compound emissions in east and south asia and implications for ozone, J. Geophys. Res.-Atmos., 112, D06312, doi:10.1029/2006JD007853, 2007.
ACPD
8, 7017–7050, 2008
Why are estimates of global isoprene emissions so similar? A. Arneth et al. Title Page Abstract Introduction Conclusions References Tables Figures ◭ ◮ ◭ ◮ Back Close
Full Screen / Esc
Printer-friendly Version
Interactive Discussion A. E., and Owen, S. M.: Eddy flux and leaf-level measurements of biogenic voc
emis-sions from Mopane woodland of Botswana, J. Geophys. Res.-Atmos., 108(D13), 8466, doi:10.1029/2002JD002317, 2003.
Guenther, A., Hewitt, C. N., Erickson, D., Fall, R., Geron, C., Graedel, T., Harley, P., Klinger, L., Lerdau, M., McKay, W. A., Pierce, T., Scholes, B., Steinbrecher, R., Tallamraju, R., Taylor,
5
J., and Zimmermann, P.: A global model of natural volatile organic compound emissions, J. Geophys. Res.-Atmos., 100, 8873–8892, 1995.
Guenther, A.: Seasonal and spatial variations in natural volatile organic compound emissions, Ecol. Appl., 7, 34–45, 1997.
Guenther, A., Baugh, B., Brasseur, G., Greenberg, J., Harley, P., Klinger, L., Serc¸a, D., and
10
Vierling, L.: Isoprene emission estimates and uncertainties for the central African Expresso study domain, J. Geophys. Res., 104, 30 635–30 639, 1999.
Guenther, A., Karl, T., Harley, P., Wiedinmyer, C., Palmer, P. I., and Geron, C.: Estimates of global terrestrial isoprene emissions using MEGAN (model of emissions of gases and aerosols from nature), Atmos. Chem. Phys., 6, 3181–3210, 2006,
15
http://www.atmos-chem-phys.net/6/3181/2006/.
Guenther, A. B., Zimmerman, P. R., Harley, P. C., Monson, R. K., and Fall, R.: Isoprene and monoterpene emission rate variability – model evaluations and sensitivity analyses, J. Geo-phys. Res., 98, 12 609–12 617, 1993.
Henze, D. and Seinfeld, J. H.: Global secondary organic aerosol from isoprene oxidation,
Geo-20
phys. Res. Lett., 33, L09812, doi:09810.01029/02006GL025976, 2006.
Hoffmann, T., Odum, J. R., Bowman, F., Collins, D., Klockow, D., Flagan, R. C., and Seinfeld, J. H.: Formation of organic aerosols from the oxidation of biogenic hydrocarbons, J. Atmos. Chem., 26, 189–222, 1997.
IPCC: Climate change 2007: The physical science basis. Summary for policymakers,
Con-25
tribution of working group I to the fourth assessment report of the intergovernmental panel on climate change, available at: http://www.ipcc.ch/pdf/assessment-report/ar4/wg1/
ar4-wg1-spm.pdf, 2007.
Kaplan, J. O., Folberth, G., and Hauglustaine, D. A.: Role of methane and biogenic volatile organic compound sources in late glacial and Holocene fluctuations of atmospheric methane
30
concentrations, Global Biogeochem. Cy., 20, doi: 10.1929/2005GB002590, 2006.
Kesselmeier, J. and Staudt, M.: Biogenic volatile organic compounds (VOC): An overview on emission, physiology and ecology, J. Atmos. Chem., 33, 23–88, 1999.