HAL Id: hal-00301432
https://hal.archives-ouvertes.fr/hal-00301432
Submitted on 21 Sep 2004HAL is a multi-disciplinary open access
archive for the deposit and dissemination of sci-entific research documents, whether they are pub-lished or not. The documents may come from teaching and research institutions in France or abroad, or from public or private research centers.
L’archive ouverte pluridisciplinaire HAL, est destinée au dépôt et à la diffusion de documents scientifiques de niveau recherche, publiés ou non, émanant des établissements d’enseignement et de recherche français ou étrangers, des laboratoires publics ou privés.
Using photochemical models for the validation of NO2
satellite measurements at different solar zenith angles
A. Bracher, M. Sinnhuber, A. Rozanov, J. P. Burrows
To cite this version:
A. Bracher, M. Sinnhuber, A. Rozanov, J. P. Burrows. Using photochemical models for the validation of NO2 satellite measurements at different solar zenith angles. Atmospheric Chemistry and Physics Discussions, European Geosciences Union, 2004, 4 (5), pp.5515-5548. �hal-00301432�
ACPD
4, 5515–5548, 2004
NO2 satellite measurements at different solar zenith
angles A. Bracher et al. Title Page Abstract Introduction Conclusions References Tables Figures J I J I Back Close
Full Screen / Esc
Print Version Interactive Discussion
© EGU 2004
Atmos. Chem. Phys. Discuss., 4, 5515–5548, 2004 www.atmos-chem-phys.org/acpd/4/5515/
SRef-ID: 1680-7375/acpd/2004-4-5515 © European Geosciences Union 2004
Atmospheric Chemistry and Physics Discussions
Using photochemical models for the
validation of NO
2
satellite measurements
at di
fferent solar zenith angles
A. Bracher, M. Sinnhuber, A. Rozanov, and J. P. Burrows
Institute of Environmental Physics and Remote Sensing (IUP/IFE), University of Bremen, 28334 Bremen, Germany
Received: 2 April 2004 – Accepted: 29 August 2004 – Published: 21 September 2004 Correspondence to: A. Bracher ([email protected])
ACPD
4, 5515–5548, 2004
NO2 satellite measurements at different solar zenith
angles A. Bracher et al. Title Page Abstract Introduction Conclusions References Tables Figures J I J I Back Close
Full Screen / Esc
Print Version Interactive Discussion
© EGU 2004
Abstract
SCIAMACHY (Scanning Imaging Spectrometer for Atmospheric Chartography) aboard the recently launched Environmental Satellite (ENVISAT) of ESA is measuring solar radiance upwelling from the atmosphere and the extraterrestrial irradiance. Appropri-ate inversion of the ultraviolet and visible radiance measurements, observed from the
5
atmospheric limb, yields profiles of nitrogen dioxide, NO2, in the stratosphere. In order to assess their accuracy, the resulting NO2profiles have been compared with those re-trieved from the space borne occultation instruments Halogen Occultation Experiment (HALOE, data version v19) and Stratospheric Aerosol and Gas Experiment II (SAGE II, data version 6.20). As the HALOE and SAGE II measurements are performed during
10
local sunrise or sunset and because NO2 has a significant diurnal variability, the NO2 profiles derived from HALOE and SAGE II have been transformed to those predicted for the solar zenith angles of the SCIAMACHY measurement by using a 1-D photochemi-cal model. The model used to facilitate the comparison of the NO2profiles from the dif-ferent satellite sensors is described and an error assessment provided. Comparisons
15
between NO2profiles from SCIAMACHY and those from HALOE NO2but transformed to the SCIAMACHY solar zenith angle, for collocations from July to October 2002, show good agreement (within+/−15%) between the altitude range from 22 to 33 km. The results from the comparison of all collocated NO2profiles from SCIAMACHY and those from SAGE II transformed to the SCIAMACHY solar zenith angle show a systematic
20
negative bias of 10 to 35% between 20 km to 38 km with a small standard deviation between 5 to 14%. These results agree with those of Newchurch and Ayoub (2004), implying that above 20 km NO2 profiles from SAGE II sunset are probably somewhat high.
ACPD
4, 5515–5548, 2004
NO2 satellite measurements at different solar zenith
angles A. Bracher et al. Title Page Abstract Introduction Conclusions References Tables Figures J I J I Back Close
Full Screen / Esc
Print Version Interactive Discussion
© EGU 2004
1. Introduction
Nitrogen dioxide, NO2, plays a number of important roles in the chemistry of the strato-sphere. It is not only involved in catalytic cycles leading to ozone, O3, destruction, but also in processes, buffering chlorine activation and oxides of hydrogen through the formation of the temporary reservoir, such as chlorine nitrate, ClONO2, (Brasseur
5
and Solomon, 1986). Reservoir species like HO2NO2 and N2O5 have the property to remove reactive species like NO2for a certain time from fast reactions.
Gaseous peroxynitric acid (HO2NO2) is produced by the reaction:
NO2+ HO2+ M → HO2NO2+ M . (R1)
While it is destroyed by photolysis and reaction with OH:
10
HO2NO2+ hv → NO2+ HO2. (R2)
HO2NO2+ OH → H2O+ O2+ NO2, (R3)
as well as by collisional decomposition which is the reverse reaction of (R1). Thus the molecule HO2NO2is important in both nitrogen and hydrogen chemistry.
Dinitrogen pentoxide (N2O5) is formed during the night by the following reactions of
15
NO2and NO3:
NO2+ O3→ NO3+ O2 (R4)
NO3+ NO2+ M → N2O5+ M . (R5)
After sunrise, N2O5photolyzes back into NO2and NO3:
N2O5+hv → NO2+ NO3. (R6)
20
It can also be destroyed by collisional decomposition which is the reverse reaction of (R5).
ACPD
4, 5515–5548, 2004
NO2 satellite measurements at different solar zenith
angles A. Bracher et al. Title Page Abstract Introduction Conclusions References Tables Figures J I J I Back Close
Full Screen / Esc
Print Version Interactive Discussion
© EGU 2004
NO2photolyzes to form NO,
NO2+ hv → NO + O (R7)
and NO reacts with ozone to reform NO2
O3+ NO → NO2+ O2. (R8)
The behaviour of NO2 in the stratosphere is largely controlled by the above reactions,
5
which result in a significant diurnal variation in NO2 amount, with a minimum after sunrise and a maximum shortly after sunset (when NO is rapidly converted to NO2). The partitioning of N2O5 also leads to a seasonal variation in NO2 densities. During polar summer, the near-constant sunlight prevents buildup of NO3and hence precludes formation of N2O5. Thus, NO2 densities are higher in the polar summer than in the
10
winter, at which time more NOx is sequestered in the N2O5 reservoir (Solomon and Keys, 1992).
The short-lived radical NO2 has been observed in the atmosphere since the 1970s by means of passive remote sensing in the ultraviolet and visible spectral regions from instrumentation either at the ground, or flown on aircraft, balloons, and spacecraft.
15
Similarly instruments aboard satellite platforms, aimed at retrieving NO2profiles, have also employed solar occultation: examples are the family of instruments known as the Stratospheric Aerosol and Gas Experiment (SAGE I, II, III; Chu and McCormick, 1979; Mauldin et al., 1985; NASA LaRC, 2004), the family of instruments called Polar Ozone and Aerosol Measurements (POAM II, III; Glaccum et al., 1996; Lucke et al., 1999), the
20
two Improved Limb Atmospheric Spectrometers (ILAS I, II; Sasano et al., 1999; Naka-jima et al., 2004) and the Halogen Occultation Experiment (HALOE; Russell III et al., 1993). The sun synchronous orbits of the satellites on which POAM, ILAS and SAGE III instruments are flown, result in solar occultation measurements only being possible at high latitudes. HALOE, SAGE I and SAGE II fly on platforms in asynchronous orbits
25
and thereby achieve global coverage of solar occultation measurements within a year. As explained above, the concentration of NO2 in the stratosphere exhibits a sig-nificant diurnal cycle, measurements at a variety of solar zenith angles are therefore
ACPD
4, 5515–5548, 2004
NO2 satellite measurements at different solar zenith
angles A. Bracher et al. Title Page Abstract Introduction Conclusions References Tables Figures J I J I Back Close
Full Screen / Esc
Print Version Interactive Discussion
© EGU 2004
required to improve our understanding of the chemistry and dynamics of NO2 in the stratosphere. In the study by Payan et al. (1999) the balloon-borne instruments Limb Profile Monitor of the Atmosphere (LPMA) and the Absorption par Minoritaires Ozone et NOx (AMON) have been used to measure NO2, during sunset and also 5 h later during night. In addition, since 1994 balloon flights of the Michelson Interferometer
5
for Passive Atmospheric Sounding (MIPAS-B) have been undertaken for different geo-physical conditions of the stratosphere. Vertical profiles of NO2 are measured among the other major components of the nitrogen family at night, at sunrise and a few hours after sunrise (Stowasser et al., 2003). In addtion to its solar occultation measurements, the SAGE III instrument measures in lunar occulation mode, which enables to retrieve
10
NO2 profiles in the solar zenith angle range of between 95◦ and 115◦ (NASA LaRC, 2004).
SCIAMACHY (Scanning Imaging Absorption Spectrometer for Atmospheric Chartog-raphy, see, e.g. Bovensmann et al., 1999), MIPAS (Michelson Interferometer for Pas-sive Atmospheric Sounding, see, e.g. Stiller et al., 2001) and GOMOS (Global Ozone
15
Monitoring by Occultation of Stars, see, e.g. Bertaux et al., 1991) are space-based at-mospheric instruments launched on board ENVISAT (Environmental Satellite) in March 2002. These three atmospheric ENVISAT instruments provide information about a va-riety of trace gases, including NO2 profiles. ENVISAT orbits the Earth 14 times per day in a polar sun-synchronous orbit with an inclination of 98.7◦in a descending node
20
and having an equator crossing time of 10:00 local solar time. This results in measure-ments being made at a range of solar zenith angles, during the day (MIPAS and solar occultation and limb measurements of SCIAMACHY), and the night (MIPAS, GOMOS and during the time around local full moon SCIAMACHY lunar occultation). Global coverage of the limb sounding measurements is reached within less than six days.
25
In order to exploit fully the retrievals of NO2 from the measurements made aboard ENVISAT, the relevant data products have to be validated. In addition to validation by comparison with balloon measurements, a validation with a collocated data set of a larger seasonal and global coverage is needed. The use of independent satellite
ACPD
4, 5515–5548, 2004
NO2 satellite measurements at different solar zenith
angles A. Bracher et al. Title Page Abstract Introduction Conclusions References Tables Figures J I J I Back Close
Full Screen / Esc
Print Version Interactive Discussion
© EGU 2004
measurements to validate trace gas products of the ENVISAT instruments has the great advantage that pole-to-pole coverage for all seasons is available and that validation activities are not restricted to a limited set of dates and locations. As a result, this study attempts to validate the NO2products retrieved at the Institute of Environmental Physics from SCIAMACHY Level-0 data by comparisons with the established and well
5
validated data products from satellite instruments HALOE (described in Russell III et al., 1993), and SAGE II (described in Mauldin et al., 1985).
As the NO2 measurements from SAGE II and HALOE are performed during local sunrise or sunset, measurements made in space and time close to the ENVISAT mea-surements have to take into account appropriately the difference in the solar zenith
10
angles of the SCIAMACHY and the occultation instrument. In this study a 1-D pho-tochemical model was used in order to transform the NO2 measurement from solar occultation to the solar zenith angle during the SCIAMACHY NO2measurement. This manuscript provides a detailed description on the method used for transforming the solar occultation measurements to the selected solar zenith angle of the limb
mea-15
surements of SCIAMACHY. An error analysis is presented and used in assessing the comparison of the NO2 profiles retrieved from the different satellite sensors. The first results of the comparisons between SCIAMACHY and HALOE, and SCIAMACHY and SAGE II from summer/fall 2002 are shown.
2. Satellite NO2data sets and collocation criteria
20
2.1. SCIAMACHY stratospheric NO2data
SCIAMACHY on the recently launched satellite ENVISAT is a passive remote sens-ing instruments, which measures the back scattered reflected and transmitted electro-magnetic radiation up welling from the atmosphere in different viewing geometries. SCIAMACHY comprises eight spectral channels between 240 and 2380 nm with a
25
channel dependent spectral resolution of between 0.2 and 1.5 nm. SCIAMACHY is 5520
ACPD
4, 5515–5548, 2004
NO2 satellite measurements at different solar zenith
angles A. Bracher et al. Title Page Abstract Introduction Conclusions References Tables Figures J I J I Back Close
Full Screen / Esc
Print Version Interactive Discussion
© EGU 2004
the first satellite instrument, which makes spectroscopic observation of the upwelling radiation at the top of the Earth’s atmosphere in nadir viewing and limb viewing ge-ometries, as well as the solar and lunar occultation modes. For this study only data from SCIAMACHY limb observations have been used. These yield NO2profiles having almost global coverage (within six days) and a reasonably high vertical resolution. In
5
the novel limb scattering method, the line of sight follows a tangential path through the atmosphere and solar radiation is detected that is scattered along the line of sight into SCIAMACHY’s field of view, and transmitted from the scattering point to the instrument. SCIAMACHY scans the tangent height (TH) range between about −3 and 100 km with TH steps of about 3.3 km. SCIAMACHY limb measurements are performed during the
10
day and cover the solar zenith angles between around 20◦and 92◦. Further information on the SCIAMACHY instrument and its mission objectives are provided in Bovensmann et al. (1999).
For this study, the NO2 profiles have been retrieved from the SCIAMACHY level 0 data, which are radiometrically and spectrally uncalibrated signals. The signal counts
15
have been integrated over the entire azimuth scan of 960 km, which yields the optimal signal-to-noise ratio. At a later date retrievals at the four different azimuth angles, measured at each tangent height by SCIAMACHY are planned. The data are divided by the integration times and a dark current correction is performed by substracting the spectrum at 150 km tangent height. SCIAMACHY NO2 profiles are derived from
20
the retrieval method described in detail in Eichmann et al. (2004) and von Savigny et al. (2004). The retrieval is performed in the spectral range 420–455 nm using ratios of limb spectra in a selected tangent height region to a limb measurement at a reference tangent height of around 40 km.
The measurements of the scattered solar radiation in limb viewing geometry as
per-25
formed by the SCIAMACHY instrument are simulated using the CDI radiative transfer model (Rozanov et al., 2001). This model calculates the limb radiance by accounting for the single scattered radiance properly and using an adequate approximation to de-termine the multiple scattering. The optimal estimation method is used for the retrieval
ACPD
4, 5515–5548, 2004
NO2 satellite measurements at different solar zenith
angles A. Bracher et al. Title Page Abstract Introduction Conclusions References Tables Figures J I J I Back Close
Full Screen / Esc
Print Version Interactive Discussion
© EGU 2004
of the Stratospheric NO2profiles for the altitude range from about 15 up to 35–40 km. The accuracy in retrieved number densities is estimated to be about 15–20% between 15 and 30 km. Outside this altitude range, and for meteorological situations with little or no stratospheric NO2larger errors are expected.
2.2. Satellite occultation data used for comparisons of satellite NO2profiles
5
Both instruments used to validate SCIAMACHY NO2data, HALOE and SAGE II, mea-sure trace gas profiles during fifteen spacecraft sunrises and sunsets daily, normally in opposite hemispheres, although at certain times of the year these measurements occur on the same day and almost overlap in space. Both solar occultation modes correspond to a good approximation to a solar zenith angle of 90◦. The latitudes of the
10
NO2profiles, observed by HALOE and SAGE II, change from one day to the next such that sampling of the global atmosphere between about 70◦S and 70◦N results over a 1-year period.
2.2.1. HALOE NO2measurements
The HALOE instrument was launched in September 1991 on board the Upper
Atmo-15
sphere Research Satellite (UARS) and routine observations by HALOE started in Oc-tober 1991. In this study we made comparisons to Version 19 (v19) of the HALOE NO2 data product. After an extensive validation of v17 by Gordley et al. (1996), the quality of Version 18, v18, HAOE NO2data is characterized on the HALOE web page
(http://haloedata.larc.nasa.gov). However, according to J. Russel III (personal
commu-20
nication, PI of HALOE project), no significant changes have been detected between v18 and v19 of the HALOE NO2 data product. V18 data agree with correlative obser-vations from 25 to 45 km within the ±10 to ±15% level, with no obvious bias. The NO2 data are described as excellent from the tropopause to 25 km in clear air conditions, but exhibit a low bias in the presence of aerosols. The aerosol correction in the lower
25
stratosphere below about 20 km is large being more than 100%. However, the data 5522
ACPD
4, 5515–5548, 2004
NO2 satellite measurements at different solar zenith
angles A. Bracher et al. Title Page Abstract Introduction Conclusions References Tables Figures J I J I Back Close
Full Screen / Esc
Print Version Interactive Discussion
© EGU 2004
from the last 5 years should be more accurate because the aerosol loading is at its lowest since 1978, because of the lack of volcanic intrusions into the stratosphere. The vertical resolution of HALOE NO2data is given with 2 km (Gordley et al., 1996). 2.2.2. SAGE II NO2measurements
The longest record of satellite high-resolution NO2 profile measurements have been
5
made by the solar occultation instrument SAGE II which was launched on the Earth Radiation Budget Satellite (ERBS) in October 1984 and is still operational. The in-strument field of view in the direction normal to the line of sight is 0.5 km vertically by 2.5 km horizontally. The NO2 measurements are derived from the difference between the absorptions in narrow bandwidth channels centered at 448 and 453 nm. The
ver-10
tical resolution of SAGE II NO2 data is around 2 km. In the extensive SAGE II NO2 validation study on a much older data version by Cunnold et al. (1991), the precision of the profiles is about 5% and the absolute accuracy of the measurements is esti-mated for sunset measurements to be 15%, based on uncertainties in the absorption cross-section and their temperature dependence. Agreement of approximately 10%
15
was seen in comparisons to balloon-measured profiles over Southern France between 23 and 32 km altitude (the highest altitude of the balloon observations) and to ATMOS profiles obtained four days later between 23 and 37 km altitude. The SAGE II data version 6.1, the forerunner of the version used in this study, is characterized to have achieved a significant improvement in the NO2 retrievals through a minor
modifica-20
tion to the spectroscopy, which cause a concomitant improvement to short wavelength aerosol extinction particularly in the lower stratosphere and during low aerosol loading periods (SAGE II website: http://www-sage2.larc.nasa.gov/data/v6 data/). As stated by L. Thomason (PI of SAGE II project, personal communication, 2004), SAGE II NO2 data version 6.1 and 6.2 are considerably better than version 6.0, but still biased by
25
ACPD
4, 5515–5548, 2004
NO2 satellite measurements at different solar zenith
angles A. Bracher et al. Title Page Abstract Introduction Conclusions References Tables Figures J I J I Back Close
Full Screen / Esc
Print Version Interactive Discussion
© EGU 2004
2.3. Data sets
All available SCIAMACHY, HALOE, and SAGE II data sets from 24 July 2002 and 12 September 2002 to 14 October 2002 were searched for near coincident measure-ments. The time period for the intercomparison was chosen because for the time around the split of the Antarctic ozone hole at 27 September 2002 more level-0/level-1
5
data of SCIAMACHY were available than during other times.
2.4. Spatial and time distance criteria for coincident measurements
SCIAMACHY NO2profiles have been compared with HALOE and or SAGE II measure-ments for the coincidence criteria that measuremeasure-ments took place on the same day and that the tangent point of HALOE or SAGE II is within 500 km of the centre of the nearest
10
SCIAMACHY ground pixel. This ensures that the HALOE or SAGE II tangent point is within or near the SCIAMACHY ground scene which is rather large for SCIAMACHY being about 960 km×400 km.
2.5. Criteria for coincidences within the same air mass
In order to avoid matches where the samples were coming from different air masses,
15
all coincident measurements were checked for their potential vorticity (PV) to identify air masses according to the method described in Bracher et al. (2004). PV values measured at the same geolocation and day of each collocated measurement were taken from the United Kingdom Meteorological Office (UKMO) assimilated meteoro-logical dataset available in a 3.75◦×2.5◦ (longitude-latitude) grid resolution (Swinbank
20
and O’Neill, 1994). As a result of the relatively large ground scene of a SCIAMACHY profile, the corner coordinates of the ground scene for each SCIAMACHY profile were checked for their homogeneity of PV. For samples outside the tropics, the tropopause was assumed to be the 3.5 PVU level, which was shown by Hoerling et al. (1991) to be a good estimate for the dynamical tropopause height. Inside the tropics where
25
ACPD
4, 5515–5548, 2004
NO2 satellite measurements at different solar zenith
angles A. Bracher et al. Title Page Abstract Introduction Conclusions References Tables Figures J I J I Back Close
Full Screen / Esc
Print Version Interactive Discussion
© EGU 2004
the dynamical tropopause is not defined, the 380 K isentropic level was a proxy for the tropopause. To seperate collocations, where the four corners of a SCIAMACHY ground pixel and the collocated HALOE or SAGE II tangent point were inside the polar vortex or outside the vortex, matches where the PV of both measurements at the isentropic level of 475 K were selected having either greater than 40 or less than −40 PVU (i.e.
5
inside the vortex) or between −30 and 30 PVU (i.e. outside the vortex), respectively.
3. Model used for scaling NO2measurements
As pointed out above, NO2 in the stratosphere is relatively short-lived, and has a sig-nificant diurnal variability. The live-cycle of NO2 is determined by a fast exchange between NO and NO2(R7 and R8), and the slow formation of N2O5(R4 and R5).
Dur-10
ing the night, N2O5 is in thermal equilibrium with NO2 and NO3, and also reacts on liquid surfaces to form HNO3. During the day, the partitioning between NO, NO2 and N2O5 depends strongly on solar zenith angle due to the rapid photolysis of NO2 and the slower photolysis of N2O5. This dependency on solar zenith angle makes valida-tion of NO2measurements difficult, as measurements seldom coincide both in location
15
and local time. In order to compare collocated solar occultation NO2measurements at 90◦solar zenith angle to NO2measurements from SCIAMACHY at various solar zenith angles, a 1-D chemical and photolysis model of the stratosphere that extends from the tropopause up to the stratopause has been used.
The model chemistry is similar to the SLIMCAT chemistry scheme. Reaction rates
20
and absorption cross sections are taken from the JPL 2000 recommendation (Sander et al., 2000). The height of the model boxes can be adapted to fit the altitude res-olution and tangent altitudes of either the occultation or SCIAMACHY measurement. The model includes 135 chemical reactions including gas-phase as well as hetero-geneous reactions, and 44 photolysis reactions of the 52 species most important for
25
stratospheric chemistry, and runs with a chemical time-step of 5 min. Model output is every 15 min.
ACPD
4, 5515–5548, 2004
NO2 satellite measurements at different solar zenith
angles A. Bracher et al. Title Page Abstract Introduction Conclusions References Tables Figures J I J I Back Close
Full Screen / Esc
Print Version Interactive Discussion
© EGU 2004
The 1-D model has been used to compare satellite measurements of NO2at different solar zenith angles in the following way. The model is initialised with the output of a global 2-D chemistry, transport and photochemistry model for the geolocation and day of the measurement. The 2-D model is a composite of the SLIMCAT chemistry scheme (Chipperfield, 1999) and the THIN AIR dynamics code (Kinnersley, 1996), and
5
is described in more detail in (Sinnhuber et al., 2003). The chemistry scheme of the 1-D model is derived from the chemistry scheme of the 2-D model, and considers exactly the same photochemical reactions and species. The only difference is that the 1-D model does not use simplifications of the behaviour of very short-lived species assuming photochemical equilibrium. Ozone is initialised based on measurements
10
whenever available. The model is run over a period of 3 days to allow for spin-up, and on the third day, NO2 at sunset or sunrise from the model is compared to the occultation measurement. Then, the NOx species – NO, NO2 and N2O5 – from the model are scaled to fit the validation measurement’s NO2 at sunset or sunrise. The model is run again for three days with the modified NOx.
15
The model result and SCIAMACHY measurement are compared at the solar zenith angle of the SCIAMACHY measurement. In the ideal case of two perfect instruments and a perfect photochemical model, model and measurement would agree. In reality, not only do the measurements suffer from instrument noise and systematic measure-ment errors, but also the model is imperfect and has its own additional errors.
20
3.1. Model errors
The most obvious source of model error are inaccuracies in the photolysis frequencies of the photochemical reactions and reaction rates. The model includes all reactions that are known to play a major role for stratospheric chemistry. The reaction rates, taken from the JPL 2000 recommendation, are based on measurements that themselves
25
have measurement errors. Also, the initialisation of parameters important for the NO2 chemistry and NOx partitioning influences the model output. The most obvious error source, the amount of NOx itself, is initialised using the occultation measurement as
ACPD
4, 5515–5548, 2004
NO2 satellite measurements at different solar zenith
angles A. Bracher et al. Title Page Abstract Introduction Conclusions References Tables Figures J I J I Back Close
Full Screen / Esc
Print Version Interactive Discussion
© EGU 2004
described above. O3is also initialised from a measurement. O3plays a major role for the NOxpartitioning, because O3reacts with NO and NO2, and also impacts photolysis due to its strong UV absorption. Other parameters that influence the outcome of the comparison are temperature, which is important because of the temperature depen-dency of the reaction and photolysis rates, and also for the thermal decomposition of
5
N2O5; the aerosol loading of the atmosphere, represented by the amount of H2SO4, is important for the hydrolysis of N2O5. Another factor that influences the outcome of the comparison is the variation of the solar zenith angle of the validation measurement along the instruments line-of-sight. By definition, the solar zenith angle of the occul-tation measurement is 90◦ at the tangent point, however, before the tangent point, the
10
solar zenith angle is larger, after the tangent point, it is smaller than 90◦. As the vari-ability of NO2 is largest during sunset and sunrise, this affects the initialisation of NOx in the model.
Sensitivity studies were carried out to investigate the impact of the model error on the measurement comparison exemplarily for one SCIAMACHY measurement of 23
Au-15
gust 2002 at 54.2◦ S. This is compared to a SAGE II sunset measurement of the same day at approximately the same location. For the sensitivity studies, model runs were carried out varying the parameters in question to a likely degree, and comparing the model result to the model ‘base’ run where all parameters have their “default” setting. Model altitudes are scaled to the SAGE NO2measurement, and extend from 15.5 km
20
to 42 km for this model run. The comparison to the base run is carried out for the solar zenith angle of the SCIAMACHY measurement, 76.12◦, as well as for 120◦ for a night-time scenario. This later case is also of interest for example for the validation of MIPAS and GOMOS, which measure during nighttime. As the dominating processes during the night are not the same as during daytime, results could be very different.
25
The relative differences between “base” and each test model run are plotted in Fig. 1 for the day and night scenario, respectively.
ACPD
4, 5515–5548, 2004
NO2 satellite measurements at different solar zenith
angles A. Bracher et al. Title Page Abstract Introduction Conclusions References Tables Figures J I J I Back Close
Full Screen / Esc
Print Version Interactive Discussion
© EGU 2004
3.1.1. Ozone
The default model run is initialised with an O3measurement of the SAGE instrument that was taken simultaneously with NO2. To take into account O3absorption above the altitude range of the model, an O3 density of 7e16 cm−2 is initialised above the model range, derived from the SAGE ozone measurement between 42 and 58 km. In one
5
set of model runs, the ozone is scaled by a factor of 1.5. This is a rather conservative estimate for dynamic O3 variability. It leads to about 5% larger NO2 values below 30 km during daytime, and to about 13% smaller NO2values during night-time (Fig. 1). In another set of model runs, the O3column above the model altitudes is set to zero. This affects the NO2 amount mainly above 35 km; there, differences to the “base” run
10
including the O3 column are rather large: being up to 20%. During the day, reducing the O3column above the model altitudes leads to a decrease of NO2, whereas during the night, modelled NO2increases.
3.1.2. Temperature
In the default setting, temperature is initialised by the 2-D model output which calculates
15
temperature itself. Temperature measurements would be preferable of course, but are not always available. For the sensitivity studies, temperature was varied by 10 K compared to the “base” run. This appears a reasonable estimate for the deviations from a temperature climatology – the 2-D model output – to the true temperature, which is unknown. A 10 K increase in temperature decreases NO2 slightly between about 35
20
and 25 km, and increases NO2above and below (see Fig. 1). Again, during night-time, the differences to the “base” run are much larger than during day, reaching a 12% decrease between 20 and 25 km. During day-time, differences are much smaller, with maximal differences of about 5% reached at about 40 km altitude. This is due to the fact that during the night, the thermal equilibrium between N2O5and NO2plays a larger
25
role.
ACPD
4, 5515–5548, 2004
NO2 satellite measurements at different solar zenith
angles A. Bracher et al. Title Page Abstract Introduction Conclusions References Tables Figures J I J I Back Close
Full Screen / Esc
Print Version Interactive Discussion
© EGU 2004
3.1.3. Aerosol loading
The aerosol loading of the atmosphere determines the partitioning between NOx– NO, NO2, and N2O5 – and HNO3 through the hydrolysis of N2O5. As NOx is fixed in the model run, the aerosol loading should not play a large role in determining NO2. Two factors were varied to test this hypothesis: the amount of H2SO4, and the reaction rate
5
of N2O5 hydrolysis on liquid aerosols. The amount of H2SO4 was decreased and in-creased by a factor of 10. Decreasing H2SO4has no significant impact on NO2, while increasing H2SO4 increases NO2 slightly below 25 km during daytime; during night-time, NO2 is hardly affected (see Fig. 1). The gamma coefficient of N2O5 uptake on liquid aerosols is varied by the maximum and minimum values, given in the JPL
rec-10
ommendations, 0.05 and 0.2 (the default value in the model is 0.1). Again, decreasing gamma does not change NO2 significantly, while increasing gamma leads to slightly higher values below 25 km during daytime (Fig. 1). The fact that NO2 seems rather insensitive to the aerosol reactions is probably due to the fact that the aerosol loading of the 2-D model is low, initialised by SAGE measurements from the year 1995. This is
15
realistic for the current post-Pinatubo area, but the situation would be different in situa-tions with higher aerosol loading, i.e., shortly after a large volcanic eruption depositing significant amounts of aerosol in the stratosphere.
3.1.4. Reactions important for NOx partitioning
The impact of uncertainities in the reaction rates of the two reactions most important
20
for the partitioning between NO and NO2, photolysis of NO2, (R7), and reaction of NO with ozone, (R8), were investigated within the sensitivity study. For the NO2absorption cross section, an error of 5–10% is given in the JPL recommendation, while it is stated that “the agreement is poor below room temperature”, i.e., at stratospheric tempera-tures (DeMore et al., 1997). To reflect this, the NO2 photolysis rate was decreased
25
by 20%. This leads to an increase in NO2 of less than 5% between 35 and 25 km increasing to 12% below 20 km during the day. NO2levels during the night are strongly
ACPD
4, 5515–5548, 2004
NO2 satellite measurements at different solar zenith
angles A. Bracher et al. Title Page Abstract Introduction Conclusions References Tables Figures J I J I Back Close
Full Screen / Esc
Print Version Interactive Discussion
© EGU 2004
affected as well, decreasing by about 10% over the whole altitude range (Fig. 2). For reaction (R8), no errors are given; for the sensitivity study, again an error of 20% is assumed, and the reaction rate of R8 was decreased by 20%. This decreased NO2by about 2% during the day, and increased NO2by 2 to 8% during the night (Fig. 1). 3.1.5. Solar zenith angle variations along line-of-sight
5
The solar zenith angle of an occultation measurement is 90◦ at the tangent altitude. However, it varies along the line-of-sight (LOS) of the instrument thus that it is larger before and smaller behind the tangent altitude. This means that the measurement of an occultation instrument is a superposition of different solar zenith angles near 90◦. As NO2is highly variable during sunset and sunrise, even small uncertainty in the solar
10
zenith angle of the occultation measurement can lead to large errors in the initialisation of the model NOx. For the sensitivity study, the solar zenith angle of the validation measurement is varied by 1◦. This leads to differences in modelled NO2of up to 10% (Fig. 1). This means that the variation of the solar zenith angle of the occultation measurement is the single largest error source of the model validation. Variations in
15
O3 result in similarly large errors, but those can easily be avoided as simultaneous retrievals of O3are readily available from SCIAMACHY and the two other atmospheric ENVISAT instruments, MIPAS and GOMOS, and all occultation instruments as well. Variations along the LOS of the ENVISAT limb measurement do not play a similar large role, as the variability of NO2is by far larger during sunrise and sunset.
20
3.1.6. Model drift
Every model drifts, meaning that trace gas concentrations differ slightly from day to day even if all other parameters – temperature, pressure, solar zenith angle variations – are completely the same. One reason for this is numerical drift, but the more important fact is that the atmosphere itself is not an equilibrium system. Model drift can not be
25
avoided, but has to be considered for the overall model error. Here, model drift for 5530
ACPD
4, 5515–5548, 2004
NO2 satellite measurements at different solar zenith
angles A. Bracher et al. Title Page Abstract Introduction Conclusions References Tables Figures J I J I Back Close
Full Screen / Esc
Print Version Interactive Discussion
© EGU 2004
NO2is determined by comparing to the occultation measurement: NO2in the model is initialised to agree with the occultation measurement during sunrise or sunset. If there was no model drift, after three days of model run, model NO2during sunrise or sunset would therefore agree perfectly with the occultation measurement. In fact, between 25 and 40 km, they agree within 2%, but above and below, the model drift of NO2 can
5
reach up to 10% (Fig. 2). 3.1.7. Total model error
From the different error sources considered in the sensitivity studies, a total error of the model calculation is estimated. As the different errors are not correlated, the error is calculated statistically, as the root mean square of the individual error contributions.
10
The total error is also shown in Fig. 1 (black dotted line). During the day, it reaches maximum values of 19% below 20 km, decreasing to about 8% between 35 and 40 km. Above 40 km, it rises sharply to values larger than 20%. The largest contributions to the overall error during the day are the solar zenith angle variations of the occultation measurement, the NO2photolysis rate, and the ozone profile; above 40 km, the ozone
15
column density above the model top altitude dominates, while below 20 km, H2SO4 plays a role as well. During the night, the overall error is about 20% between 15 and 40 km, rising sharply to over 30% above 40 km. During the night, the error again is dominated by the ozone profile, and the solar zenith angle variation of the occultation measurement and NO2photolysis play a large role as well. NO2photolysis is probably
20
important as it defines NO2during sunset, at the beginning of the night. But the second largest error source during the night is temperature, and the reaction of NO and ozone plays a role as well. The overall error is nearly double as large than during the day in the 20 to 40 km range, mainly because the contributions of ozone and temperature are so much larger. It concludes that, as the additional model error is so much larger,
val-25
idation of night-time measurements with occultation measurements are more difficult than validation of day-time measurements. However, two of the larger error sources, due to ozone and due to temperature, can be avoided by using measurements for the
ACPD
4, 5515–5548, 2004
NO2 satellite measurements at different solar zenith
angles A. Bracher et al. Title Page Abstract Introduction Conclusions References Tables Figures J I J I Back Close
Full Screen / Esc
Print Version Interactive Discussion
© EGU 2004
initialisation of the model. For the variability of the solar zenith angle along the LOS of the occultation measurement, radiative transfer calculations might help to determine something like the mean solar zenith angle of the measurement. This would decrease the model error to less than 5% between 20 and 40 km during the day, and to about 14% during the night (see Fig. 1, dash-dotted black line). Finally, the comparison of
5
the SAGE and SCIAMACHY measurements of 23 August 2002 is shown in Fig. 3. Also shown are the model results for sunset and the solar zenith angle of the SCIAMACHY measurement, as well as the total model error. The model error due to model drift is shown separately; it appears that it plays a role only above 40 km. While the agreement between the SCIAMACHY measurement and the model result at the SCIAMACHY
so-10
lar zenith angle is much better than the agreement between SCIAMACHY and SAGE, the overall agreement is still not very good in this case: below 28 km and above 37 km, SCIAMACHY is significantly lower than the modified SAGE measurement, while at 33 km, SCIAMACHY is significantly higher than the modified SAGE.
4. Validation of SCIAMACHY NO2profiles
15
Overall, 52 collocated SCIAMACHY and HALOE, and 60 collocated SCIAMACHY and SAGE II NO2 measurements have been found on the 24 July 2002 and for the pe-riod from the 12 September 2002 to 14 October 2002. The SCIAMACHY and HALOE matches were globally distributed, but most collocations were at the high and mid lat-itudes between 45◦ to 69◦ (31 in the Northern and 9 in the Southern Hemisphere).
20
The SCIAMACHY and SAGE II matches were all in the high latitudes above 60◦, 36 in the Northern and 24 in the Southern Hemisphere. Since the time period of the NO2 satellite validation was chosen during the time of the ozone hole and in this particular year also a major warming event occurred over the Antarctic region (e.g. Weber et al., 2003), checking for homogeneous air masses within the large SCIAMACHY scene and
25
also for collocated HALOE or SAGE measurements was essential.
For the SCIAMACHY and HALOE comparison, only 37 collocation pairs were left 5532
ACPD
4, 5515–5548, 2004
NO2 satellite measurements at different solar zenith
angles A. Bracher et al. Title Page Abstract Introduction Conclusions References Tables Figures J I J I Back Close
Full Screen / Esc
Print Version Interactive Discussion
© EGU 2004
after taking the criteria of the homogeneity of PV values on the 475 K isentrope and tropopause heights into account. For most matches, twelve, excluded from the com-parison, the tropopause height varied strongly within the SCIAMACHY scene or in comparison to the that of the HALOE measurement. In three cases matches from the high southern latitudes were excluded because the measurements were taken partly
5
in, and at the edge or outside the polar vortex. Only one match was found where both measurements were completely within the polar vortex (see Fig. 4 bottom right). Ta-ble 1 shows the distributions of the SCIAMACHY and HALOE collocations in different latitudinal zones, ranges of SCIAMACHY solar zenith angles (SZA) and type of HALOE measurement. Most matches are in the high northern latitudes and at SCIAMACHY
10
SZA above 60◦. Most HALOE NO2values have been measured during sunrise. For the SCIAMACHY and SAGE II comparison, only 25 collocation pairs of measure-ments were considered to be in the same air mass. All matches from the high southern latitudes are inhomogeneous for the polar vortex. From the Northern Hemisphere, 11 matches were excluded because of large differences in the tropopause height. The 25
15
matches included in the NO2comparison were all measured between 12 September 2002 and 26 September 2002.
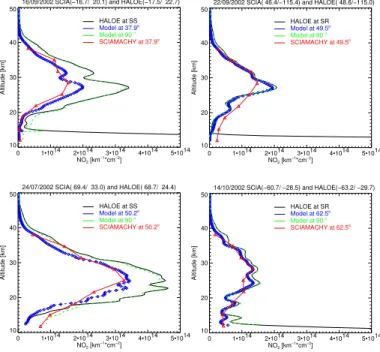
4.1. Examples of NO2profile comparisons from satellite data
Figure 4 presents four examples of the comparison of HALOE and SCIAMACHY NO2 profiles including the results from transforming the HALOE measurement with the in
20
section 3 described model. Two types of modelled NO2profiles are shown. The model at 90◦signifies where the model was scaled in such a way that NO2values correspond to the HALOE NO2 measurement at the HALOE SZA of 90◦ in dependence to the type of twilight (sunrise or sunset) during the measurement. Using this model with the 90◦NO2value, the modelled NO2 profile at SCIAMACHY solar zenith angle (model at
25
SCIAMACHY SZA) was calculated. Comparing the model results at 90◦ to the HALOE (or later to the SAGE II) measurement illustrates the possibility of the model to be applied for scaling NO2 in dependence to solar zenith angle variations at selected
ACPD
4, 5515–5548, 2004
NO2 satellite measurements at different solar zenith
angles A. Bracher et al. Title Page Abstract Introduction Conclusions References Tables Figures J I J I Back Close
Full Screen / Esc
Print Version Interactive Discussion
© EGU 2004
latitude and time. In all comparisons, the NO2 value from the model at 90◦ and the HALOE (seen in Fig. 4) or SAGE II (results not shown) measurement corresponded well above 20 km.
In Fig. 4 examples from different latitudes (tropics, mid and high latitudes) and at different SCIAMACHY SZA (around 40◦, 50◦, 60◦) are shown. Overall, above 20 km
5
the SCIAMACHY NO2values agree well with the HALOE measurement scaled to the SCIAMACHY solar zenith angle. Below 20 km the SCIAMACHY NO2values are much larger than the HALOE measurement scaled to SCIAMACHY SZA for two examples shown (Fig. 4, top right and bottom left), while even at the comparison within the po-lar vortex (Fig. 4, bottom right) and the tropics (Fig. 4, top left) the SCIAMACHY and
10
the scaled HALOE measurement agree well even down to 12 km. Due to the coarser vertical resolution of SCIAMACHY, detailed structures like the double peak in the ex-ample in the tropics (Fig. 4, top left) are not resolved, and in the exex-ample from the mid-latitudes at around 50◦ SZA (Fig. 4, top right) this leads to an underestimation of the NO2maximum.
15
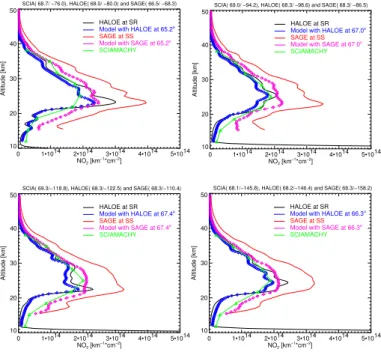
Figure 5 shows four examples of the comparison of SAGE II and SCIAMACHY NO2 profiles in the high northern latitudes at mid September where also collocations of SCIAMACHY with HALOE had been found. Only the model values for the SCIA-MACHY SZA with the input of the HALOE or SAGE NO2 values are given in addition to the SCIAMACHY, SAGE and HALOE NO2 measurements. The SCIAMACHY SZA
20
of the shown examples vary from 65◦ to 67.5◦. Since HALOE measurements were taken during sunrise and SAGE II measurements during sunset, these measurements cannot be directly compared. The shown triple comparisons elucidate differences be-tween the satellite measurements used for SCIAMACHY NO2 validation. In all ex-amples, SAGE II NO2 scaled to the SCIAMACHY SZA are significantly higher than
25
NO2 profiles of SCIAMACHY, and HALOE scaled to SCIAMACHY SZA. Opposed to that, SCIAMACHY NO2profiles show a very good agreement with the scaled HALOE profiles above 20 km. Despite the coarser vertical resolution of SCIAMACHY, in two comparisons (Fig. 5, top and bottom right) the SCIAMACHY retrieval resolves the
ACPD
4, 5515–5548, 2004
NO2 satellite measurements at different solar zenith
angles A. Bracher et al. Title Page Abstract Introduction Conclusions References Tables Figures J I J I Back Close
Full Screen / Esc
Print Version Interactive Discussion
© EGU 2004
file structure comparable to the scaled HALOE profile. But, it underestimates the NO2 maximum in one comparison (Fig. 5, top left). In the fourth comparison (Fig. 5, bottom left) SCIAMACHY measured higher values at the peak than HALOE, getting close to the scaled SAGE II values and reflecting the SAGE II scaled profile structure. Below 20 km, SCIAMACHY NO2values are close to scaled HALOE values in one comparison
5
(Fig. 5, top left), or close to the scaled SAGE II NO2values in two comparisons (Fig. 5, bottom left and right), and in between the two in one comparison (Fig. 5, top right). 4.2. Statistical analysis of collocated measurements
The NO2 profiles of the SCIAMACHY measurement and the HALOE and SAGE II measurements scaled to the SCIAMACHY SZA (Model occul) were interpolated from
10
the ground to an altitude of 50 km at an 1-km interval to enable a statistical analyses between the collocated measurements which have different vertical resolutions. The dataset of all coincident measurements was divided into subsets of solar zenith angle ranges within ten degree steps: <40◦, 40◦−50◦, 50◦−60◦, >60◦. For each colloca-tion pair the relative deviacolloca-tion, RD, between SCIAMACHY and the HALOE or SAGE
15
measurement scaled to the SCIAMACHY SZA (Model occul) NO2 concentration was determined at each altitude level (h) using Eq. 1:
RD(h)=SCIAMACHY [NO2]h−Model occul [NO2]h
Model occul[NO2]h . (1)
For each subset at each altitude level the mean relative deviation (MRD) and root mean square (RMS) of the relative deviation between all SCIAMACHY and HALOE
measure-20
ments scaled to the SCIAMACHY SZA, and SCIAMACHY and SAGE II measurements scaled to the SCIAMACHY SZA were determined. For each subset, mean profiles and standard deviations of the profiles for both instruments were calculated.
Statistical results of the NO2 comparisons from SCIAMACHY with scaled HALOE measurements for the different subsets in dependence to the SCIAMACHY SZA show
25
ACPD
4, 5515–5548, 2004
NO2 satellite measurements at different solar zenith
angles A. Bracher et al. Title Page Abstract Introduction Conclusions References Tables Figures J I J I Back Close
Full Screen / Esc
Print Version Interactive Discussion
© EGU 2004
−15% and at the positive side between 10% to 20% (Table 1). The RMS ranges from 8% to 35% at the SZA between 50◦ to 60◦ and from 15% to 25% at SZA>60◦. At the subset of SCIAMACHY SZA ranging from 40◦ to 50◦ and 50◦ to 60◦, there is a good agreement down to 20 km. Lowest values of mean relative deviation of SCIAMACHY to the scaled HALOE measurements are found around 22 km. From this altitude mean
5
relative deviations continuously increase with increasing altitude. Among all subsets, accordance is best at SZA>60◦where probably also the largest number of collocations contributes to more consistent statistical results. For all collocations SCIAMACHY’s mean relative deviation to the scaled HALOE NO2 measurements varies from −7% to 12% with a standard deviation of 10% to 30% between 21 and 33 km.
10
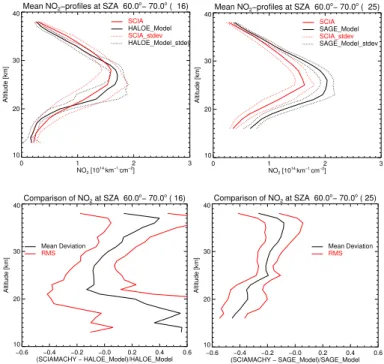
Figure 6 shows the statistical results of the NO2comparisons from SCIAMACHY with HALOE and with SAGE II in the high northern latitudes at solar zenith angles above 60◦. The SCIAMACHY mean profiles are lower at the peak but higher at the upper and lower end of the profile in comparison to scaled HALOE NO2mean values (Fig. 6 top left); between 18 and 33 km differences between the two are within the RMS of the
15
mean profiles. The mean relative deviations vary at 21 to 34 km between ±13% with a standard deviation of 15 to 30%. In contrast, as seen before in the single comparisons, the SCIAMACHY mean profile is systematically lower between 15 and 32 km than the mean of the scaled SAGE II profiles (Fig. 6, top right); at 20 to 38 km SCIAMACHY shows a negative bias of 10 to 35% with a rather low standard deviation of 5 to 14% in
20
comparison to the scaled SAGE II values. The negative bias increases systematically from 35 km with decreasing altitude. The low standard deviation of the mean relative deviation of SCIAMACHY NO2values compared to scaled SAGE values may result from the homogenous sample of matches which were all from a two weeks time period in September, the high northern latitudes, at SCIAMACHY SZA between 60◦ and 70◦
25
and SAGE NO2measurements taken during sunset.
ACPD
4, 5515–5548, 2004
NO2 satellite measurements at different solar zenith
angles A. Bracher et al. Title Page Abstract Introduction Conclusions References Tables Figures J I J I Back Close
Full Screen / Esc
Print Version Interactive Discussion
© EGU 2004
5. Conclusions
Regarding the error analysis of the 1-D photochemical model used for scaling the solar occultation NO2 measurements from HALOE and SAGE II to the SCIAMACHY SZA, this method seems to be an effective and reliable way to make collocated NO2 mea-surements with varying solar zenith angles comparable; at least between 20 and 40 km
5
altitude and for day-time measurements. During the day, the total error of this model reaches maximum values of 19% below 20 km, decreasing to about 8% between 35 and 40 km and rising sharply to values larger than 20% above 40 km. The largest con-tributions to the overall error during the day are the solar zenith angle variations of the occultation measurement, the NO2photolysis rate, and the ozone profile. In our
com-10
parisons one of the larger error sources was avoided by using ozone measurements for the initialisation of the model. If also the variability of the solar zenith angle along the LOS of the occultation measurement could be reduced by determining a mean SZA via radiative transfer calculations, the model error would decrease to less than 5%.
The error analysis showed that during the night, besides the ozone profile, and the
15
solar zenith angle variation of the occultation measurement, also the NO2 photoly-sis and the temperature play a large role as well. The overall error is much larger with about 20% between 15 and 40 km, rising sharply to over 30% above 40 km. Therefore, validation of night-time measurements, like from GOMOS stellar occulta-tion, MIPAS limb and SCIAMACHY lunar occultation measurements, with occultation
20
measurements are more difficult than validation of day-time measurements.
The validation results presented in this study show for the comparison of SCIA-MACHY and HALOE NO2profiles from July to October 2002 a good agreement (within ±15%) between the two instruments in the altitude range between 22 and 33 km. The rather large RMS of the mean relative deviation, up to 30%, of SCIAMACHY to HALOE
25
are understandable regarding a very heterogeneous sample of collocations between the two instruments, covering the latitudes from 69◦N to 65◦S and SCIAMACHY SZA from 35◦to 69◦.
ACPD
4, 5515–5548, 2004
NO2 satellite measurements at different solar zenith
angles A. Bracher et al. Title Page Abstract Introduction Conclusions References Tables Figures J I J I Back Close
Full Screen / Esc
Print Version Interactive Discussion
© EGU 2004
The statistical results from the comparison of all SCIAMACHY and SAGE II collo-cated NO2 profiles show a systematic negative offset at 20 km to 38 km between 10 and 35%, decreasing with increasing altitude. Due to the homogenous sample for the statistical analysis where all collocations are from the same region at the same SCIAMACHY solar zenith angle, the RMS of this offset is quite small (<15%). This
5
negative offset might be caused by too high SAGE II v6.2 NO2 values: the examples of the triple comparison of collocated SCIAMACHY, HALOE, and SAGE II NO2 mea-surements show at all altitudes much larger values for the scaled SAGE II measure-ment than for the scaled HALOE measuremeasure-ment which probably cannot be explained just by deviations in locations of around 12◦ in longitude. Also results of the study by
10
Newchurch and Ayoub (2004) showed that SAGE II sunset measurements from data version 6.0 are much higher values compared to the former versions of SAGE II, v5.931 and v5.96, ATMOS v3.1 and HALOE v19.
Below 22 km, examples of the triple comparison from SCIAMACHY with HALOE and SAGE II measurements scaled to the SCIAMACHY SZA show that SCIAMACHY NO2
15
values are in the range of the values of either one of the two occultation instruments. Regarding the validation results for the HALOE and SAGE II NO2values below 25 km and, as pointed out before, the increased total error of the model below 20 km with 19%, results from SCIAMACHY limb measurements at these altitudes might be more reliable. Further validation to instruments which have a good data quality in altitudes below
20
22 km, like the balloon-borne LPMA-DOAS or the MIPAS-B instruments, is necessary to prove this.
Acknowledgements. We would like to thank ESA/ESRIN for providing SCIAMACHY calibrated
level 1 spectral data. We thank the HALOE group (at Hampton University, especially J. M. Rus-sell III, and at NASA LaRC, especially E. Thompson), and the SAGE II group (at NASA LaRC,
25
especially L. Thomason, and the NASA Langley Radiation and Aerosols Branch) for providing us with data from these instruments and information about data and instruments. This work is funded in part by the DLR-Bonn (contract No. 50 EE0025) and the BMBF (FKZ 01 SF9994).
ACPD
4, 5515–5548, 2004
NO2 satellite measurements at different solar zenith
angles A. Bracher et al. Title Page Abstract Introduction Conclusions References Tables Figures J I J I Back Close
Full Screen / Esc
Print Version Interactive Discussion
© EGU 2004
References
Bertaux, J. L., Megie, G., Widemann, T., Chassefiere, E., Pellinen, R., Korylla, E., Korpela, S., and Simon, P.: Monitoring of Ozone Trend by Stellar Occultations: The Gomos Instrument, Adv. Space Res., 11, 237–242, 1991.
Bovensmann, H., Burrows, J. P., Buchwitz, M., Frerick, J., No ¨el, S., Rozanov, V. V., Chance,
5
K. V., and Goede, A. H. P.: SCIAMACHY – Mission Objectives and Measurement Modes, J. Atmos Sci., 56, 125–150, 1999.
Bracher, A., Weber, M., Bramstedt, K., and Burrows, J. P.: Long-term global measurements of ozone profiles by GOME validated with SAGE II considering atmospheric dynamics. J. Geophys. Res., in press, 2004.
10
Brasseur, G., and Solomon, S.: Aeronomy of the Middle Atmosphere, Atmos. Sci. Lib., D. Reidel, Norwell, Mass., 1986.
Chipperfield, M.: Multiannual Simulations with a three-dimensional Chemical Transport Model, J. Geophys. Res., 104, 1781–2805, 1999.
Chu, W. P. and McCormick M. P.: Inversion of stratospheric aerosol and gaseous constituents
15
from spacecraft solar extinction data in the 0.38–1.0 micrometer wavelegth region, Appl. Op-tics, 18, 1404–1413, 1979.
Cunnold, D. M., Zawodny, J. M., Chu, W. P., Pommereau, J. P., Goutail, F., Lenoble, J., Mc-Cormick, M. P., Veiga, R. E., Murcray, D., Iwagami, N., Shibasaki, K., Simon, P. C., and Peetermans, W.: Validation Of SAGE II NO2Measurements, J. Geophys. Res., 96, 12 913–
20
12 925, 1991.
DeMore, W. B., Sander, S. P., Golden, D. M., et al.: Chemical kinetics and photochemical data for use in stratospheric modelling, Evaluation Number 12, JPL, Publication 97-4, 1997. Eichmann, K.-U., Kaiser, J. W., von Savigny, C., Rozanov, A., Rozanov, V. V., Bovensmann,
H., Sinnhuber, M., and Burrows, J. P.: The SCIAMACHY limb measurements in the UV/VIS
25
spectral region: first results, Adv. Space Res., 34, 775–779, 2004.
Glaccum, W., Lucke, R., Bevilacqua, R. M., et al.: The Second Polar Ozone and Aerosol Measurement (POAM II) Instrument, J. Geophys. Res., 101, 14 479–14 487, 1996.
Gordley, L. L., Russell III, J. M., Mickley, L. J., Frederick, J. E., Park, J. H., Stone, K. A., Beaver, G. M., McInerney, J. M., Deaver, L. E., Toon, G. C., Murcray, F. J., Blatherwick, R.
30
D., Gunson, M. R., Abbatt, J. P. D., Mauldin III, R. L., Mount, G. H., Sen, B., and Blavier, J. F.: Validation of nitric oxide and nitrogen dioxide measurements made by the Halogen
ACPD
4, 5515–5548, 2004
NO2 satellite measurements at different solar zenith
angles A. Bracher et al. Title Page Abstract Introduction Conclusions References Tables Figures J I J I Back Close
Full Screen / Esc
Print Version Interactive Discussion
© EGU 2004
Occultation Experiment for UARS plaform, J. Geophys. Res. 101, 10 241–10 266, 1996. Hoerling, M. P., Schaak, T. K., and Lenzen, A. J.: Global objective tropopause analyses, Mon.
Weather Rev., 119, 1816–1831, 1991.
Kinnersley, J. S.: The meteorology of the stratospheric “THIN AIR” model, Q. J. R. Meteorol. Soc., 122, 219–252, 1996.
5
Lucke, R. L., Korwan, D., Bevilacqua, R. M., Hornstein, J. S., Shettle, E. P., Chen, D. T. Daehler, M., Lumpe, J. D., Fromm, M. D., Debrestian, D., Neff, B., Squire, M., K¨onig-Langlo, G., and Davies, J.: The Polar Ozone and Aerosol Measurement (POAM III) Instrument and Early Validation Results, J. Geophys. Res., 104, 18 785–18 799, 1999.
Mauldin, L. E., Zaun, N. H., McCormick, M. P., Guy, J. J., and Vaughn, W. R.: Stratospheric
10
Aerosol and Gas Experiment II Instrument: A Functional Description, Optical Engineering. 24, 307, 1985.
Nakajima, H., Sugita, T., Yokota, T., and Sasano, Y.: Current status and early result of the ILAS-II onboard the ADEOS-II satellite, Proceedings of SPIE, Vol. 5234, edited by Meynart, R., Neeck, S. P., Shimoda, H., Lurie, J. B., and Aten, M. L., 36–45, 2004.
15
NASA Langley Research Center: SAGE III – The Stratospheric Aerosol and Gas Experiment III, SAGE III instrument,http://www-sage3.larc.nasa.gov/instrument/, 2004.
Newchurch, M. and Ayoub, M.: Comparison of the SAGE II version 6.0 measuremetns of NO2
with ATMOS 3.1 and HALOE v19, http://www.nsstc.uah.edu/atmchem/strat no2/strat no2.
html, 2004.
20
Payan, S., Camy-Peyret, C., Jeseck, P., Hawat, T., Pirre, M., Renard, J.-B., Robert, C., Lev-evre F., Kanzawa, H., and Sasano, Y. S.: Diurnal and nocturnal distribution of stratospheric NO2from solar and stellar occultation measurements in th Arctic vortex: comparison with models and ILAS satellite measurements, J. Geophys. Res., 104, 21 585–21 593, 1999. Rozanov, A., Rozanov, V., and Burrows, J. P.: A numerical radiative transfer model for a
spher-25
ical planetary atmosphere: Combined differential-integral approach involving the Picard iter-ative approximation, J. Quant. Spectrosc. Rad. Transfer 69, 451–512, 2001.
Russell III, J. M., Gordley, L. L., Gordley, J. H., Park, J. H., Drayson, S. R., Hesketh, W. D., Cicerone, R. J., Tuck, A. F., Frederick, J. E., Harries, J. E., and Crutzen, P. J.: The Halogen Occultation Experiment, J. Geophys. Res., 98, 10 777–10 797, 1993.
30
Sander S., Golden, D. M., Hampson, R. F., et al. : Chemical kinetics and photochemical data for use in stratospheric modeling, Evaluation Number 13, JPL, Publication 00-3, 2000. Sasano, Y., Suzuki, M., and Yokota, T.: Improved Limb Atmospheric Spectrometer (ILAS) for
ACPD
4, 5515–5548, 2004
NO2 satellite measurements at different solar zenith
angles A. Bracher et al. Title Page Abstract Introduction Conclusions References Tables Figures J I J I Back Close
Full Screen / Esc
Print Version Interactive Discussion
© EGU 2004
stratospheric ozone layer measurements by solar occultation technique, Geophys. Res. Lett., 26, 197–200, 1999.
von Savigny, C., Rozanov, A., Bovensmann, H., Eichmann, K.-U., Kaiser, J. W., No ¨el, S., Rozanov, V. V., Sinnhuber, B.-M., Weber, M., and Burrows, J. P.: The Ozone hole break-up in September 2002 as seen by SCIAMACHY on ENVISAT. J. Atmosph. Sci., in press,
5
2004.
Sinnhuber M., Burrows, J. P., Chipperfield, M. P., Jackman, C. H., Kallenrode, M.-B., K ¨unzi, K., and Quack, M.: A model study of the impact of magnetic field structure on atmospheric composition during solar proton events, Geophys. Res. Lett., doi:10.1029/2003GL017265, 2003.
10
Solomon, S. and Keys, J. G.: Seasonal variations in Antarctic NOxchemistry, J. Geophys. Res., 88, 5229–5239, 1992.
Stiller, G. P., Glatthor, N., Kellmann, S., Kimmich, E., Linden, A., Milz, M., and Fischer, H.: MIPAS on ENVISAT as an UT/LS Sounder, in: IRS 2000, edited by Smith, W. L. and Timo-feyev, Yu. M., Current Problems in Atmospheric Radiation, A. Deepak Publishing, Hampton,
15
Virginia, 839–842, 2001.
Stowasser, M., Oelhaf, H., Ruhnke, R., Kleinert, A., Wetzel, G., Friedl-Vallon, F., Kouker, W., Lengel, A., Maucher, G., Nordmeyer, H., Reddmann, T., and Fischer, H.: The variation of short-lived NOy species around sunrise at mid-latitudes as measured by MIPAS-B and
calculated by KASIMA, Geophys. Res. Lett., 30, 1432, doi:10.1029/2002GL016272, 2003.
20
Swinbank, R. and O’Neill, A.: A Stratosphere-Troposhere Data Assimilation System, Mon. Weather Rev., 122, 686–702, 1994.
Weber, M., Dhomse, S., Wittrock, F., Richter, A., Sinnhuber, B.-M., and Burrows, J. P.: Dynam-ical control of NH and SH winter/spring total ozone from GOME observations in 1995–2002, Geophys. Res. Lett., 30, 1853, doi:10.1029/2002GL016799, 2003.
ACPD
4, 5515–5548, 2004
NO2 satellite measurements at different solar zenith
angles A. Bracher et al. Title Page Abstract Introduction Conclusions References Tables Figures J I J I Back Close
Full Screen / Esc
Print Version Interactive Discussion
© EGU 2004
Table 1. Statistical results of the comparison of SCIAMACHY NO2 profiles at a certain solar zenith angle (SZA) to HALOE NO2profiles measured during sunset (SS) or sunrise (SR) and scaled with the in Sect. 3 described model to the SCIAMACHY SZA. Statistical results are given for different SCIAMACHY SZA ranges and only matches within the same air mass are included: number of collocations within the SZA range (N), latitudinal range (latitude), HALOE occultation type (type), mean relative deviation (MRD), the altitude range for which MRD is given (altitude) and the root mean square of the MRD at these altitudes (RMS).
SZA range N latitude MRD altitude RMS type
30◦to 40◦ 3 tropics and subtropics −7% to 20% 22 to 34 km 10%–30% 2 SS, 1 SR
40◦to 50◦ 5 5 at 40◦N–68◦N −8% to 15% 20 to 33 km 10%–30% 2 SS, 3 SR
50◦to 60◦ 8 5 at 40◦–50◦N, 3 at 40◦–60◦S −15% to 10% 20 to 33 km 8%–35% 5 SS, 3 SR 60◦to <70◦ 21 15 at >55◦N, 6 at >60◦S −10% to 12% 22 to 33 km 15%–25% 5 SS, 16 SR
all matches 37 from 69◦N to 66◦S −7% to 12% 21 to 33 km 10%–30% 14 SS, 23 SR
ACPD
4, 5515–5548, 2004
NO2 satellite measurements at different solar zenith
angles A. Bracher et al. Title Page Abstract Introduction Conclusions References Tables Figures J I J I Back Close
Full Screen / Esc
Print Version Interactive Discussion © EGU 2004 -0.1 0.0 0.1 0.2 0.3 NO2(Base - run)/Base 15 20 25 30 35 40 45 Altitude [km] B, no O3 column C, O3*1.5 D, T+10K E, SZA 91 F, SZA 89 G, H2SO4*10 H, H2SO4*0.1 I, G150=0.05 K, G150=0.2 M, JNO2->80% N, K8->80% -0.1 0.0 0.1 0.2 0.3 NO2(Base - run)/Base 15 20 25 30 35 40 45 Altitude [km] B, no O3 column C, O3*1.5 D, T+10K E, SZA 91 F, SZA 89 G, H2SO4*10 H, H2SO4*0.1 I, G150=0.05 K, G150=0.2 M, JNO2->80% N, K8->80%
Fig. 1. Relative difference of “base” model run to the test model runs for a solar zenith angle of 76.1◦ corresponding to the SCIAMACHY measurement (left), and for a solar zenith angle (SZA) of 120◦(right). Black dashed line: total statistical error, black dash-dotted line: total error without the contribution of ozone (B and C) and sza (E and F). The calculation of the individual error contributions and the total error are described in Sect. 3.2.