HAL Id: hal-00295776
https://hal.archives-ouvertes.fr/hal-00295776
Submitted on 7 Nov 2005
HAL is a multi-disciplinary open access
archive for the deposit and dissemination of
sci-entific research documents, whether they are
pub-lished or not. The documents may come from
teaching and research institutions in France or
abroad, or from public or private research centers.
L’archive ouverte pluridisciplinaire HAL, est
destinée au dépôt et à la diffusion de documents
scientifiques de niveau recherche, publiés ou non,
émanant des établissements d’enseignement et de
recherche français ou étrangers, des laboratoires
publics ou privés.
Refining temperature measures in thermal/optical
carbon analysis
J. C. Chow, J. G. Watson, L.-W. A. Chen, G. Paredes-Miranda, M.-C. O.
Chang, D. Trimble, K. K. Fung, H. Zhang, J. Zhen Yu
To cite this version:
J. C. Chow, J. G. Watson, L.-W. A. Chen, G. Paredes-Miranda, M.-C. O. Chang, et al.. Refining
tem-perature measures in thermal/optical carbon analysis. Atmospheric Chemistry and Physics, European
Geosciences Union, 2005, 5 (11), pp.2961-2972. �hal-00295776�
www.atmos-chem-phys.org/acp/5/2961/ SRef-ID: 1680-7324/acp/2005-5-2961 European Geosciences Union
Chemistry
and Physics
Refining temperature measures in thermal/optical carbon analysis
J. C. Chow1, J. G. Watson1, L.-W. A. Chen1, G. Paredes-Miranda1, M.-C. O. Chang1, D. Trimble1, K. K. Fung2, H. Zhang3, and J. Zhen Yu31Division of Atmospheric Sciences, Desert Research Institute, 2215 Raggio Parkway, Reno, NV 89512, USA 2Atmoslytic Inc., 24801 Alexandra Ct., Calabasas, CA 91302, USA
3Department of Chemistry, Hong Kong University of Science and Technology, Clear Water Bay, Hong Kong, China Received: 2 May 2005 – Published in Atmos. Chem. Phys. Discuss.: 6 July 2005
Revised: 8 September 2005 – Accepted: 13 October 2005 – Published: 7 November 2005
Abstract. Thermal/optical methods have been widely used
for quantifying total carbon (TC), organic carbon (OC), and elemental carbon (EC) in ambient and source particulate samples. Thermally defined carbon fractions have been used for source identification. Temperature precision in thermal carbon analysis is critical to the allocation of carbon frac-tions. The sample temperature is determined by a thermo-couple, which is usually located in the oven near the sam-ple. Sample and thermocouple temperature may differ ow-ing to different thermal properties between the sample filter punch and the thermocouple, or inhomogeneities in the heat-ing zone. Quick-dryheat-ing temperature-indicatheat-ing liquids (Tem-pil Inc., South Plainfield, NJ) of different liquefying points are used as temperature calibration standards. These consist of chemicals that change their appearance at specific tem-peratures and can be optically monitored to determine the sample temperature. Temperature measures were evaluated for three different models of carbon analyzers. Sample tem-peratures were found to differ from sensor temtem-peratures by 10 to 50◦C. Temperature biases of 14 to 22◦C during ther-mal analysis were found to change carbon fraction measure-ments. The temperature indicators allow calibration curves to be constructed that relate the sample temperature to the temperature measured by a thermocouple.
1 Introduction
Carbonaceous aerosol plays a major role in air pollution, vis-ibility, health, and climate effects (e.g., Chow et al., 2005; Watson, 2002; Vedal, 1997; Jacobson, 2001). Atmospheric carbon consists of: organic carbon (OC, including various Correspondence to: J. C. Chow
organic compounds), elemental carbon (EC, or black car-bon [BC]/soot, a non-volatile/light-absorbing carcar-bon), and a small quantity of carbonate carbon (e.g., CaCO3; Chow and Watson, 2002; Cao et al., 2005)
Heating of liquid and solid materials with detection of the evolved gases has been used since the time of Lavoisier (1789) to determine their composition. Differential and evolved gas analyses were staples of the analytical chemist (MacKenzie, 1970) until the latter part of the 20th century when other instrumentation became available. Thermal evo-lution methods are still in widespread use today (e.g., Ca-dle and Groblicki, 1982; Huntzicker et al., 1982; Novakov, 1982; Cachier et al., 1989a, 1989b; Hitzenberger et al., 1999; Watson et al., 2005) to measure total carbon (TC=OC+EC) and fractions in suspended particles collected on filters. OC, EC, and other carbon fractions are defined by the tempera-tures at which they evolve, sometimes in conjunction with optical detection of BC. Precise measures of the sample tem-perature are difficult to obtain owing to different locations and heating characteristics of the sample and the tempera-ture sensor. This difference between sample and temperatempera-ture sensors could be one of the causes of differences between OC and EC measurements by different laboratories applying similar thermal evolution methods (e.g., Currie et al., 2002; Schmid et al., 2001; Watson et al., 2005). These tempera-ture differences may be especially important when data are compared from different networks such as the non-urban In-teragency Monitoring of Protected Visual Environments net-work (IMPROVE, Chow et al., 1993, 2001, 2004a) and urban Speciation Trends Network (STN, Peterson and Richards, 2002) in the United States. Hundreds of thousands of car-bon measurements have been acquired in these networks that are used for air quality planning and research purposes. Thermally-derived carbon fractions that are quite sensitive to
2962 J. C. Chow et al.: Refining temperature measures in thermal/optical carbon analysis
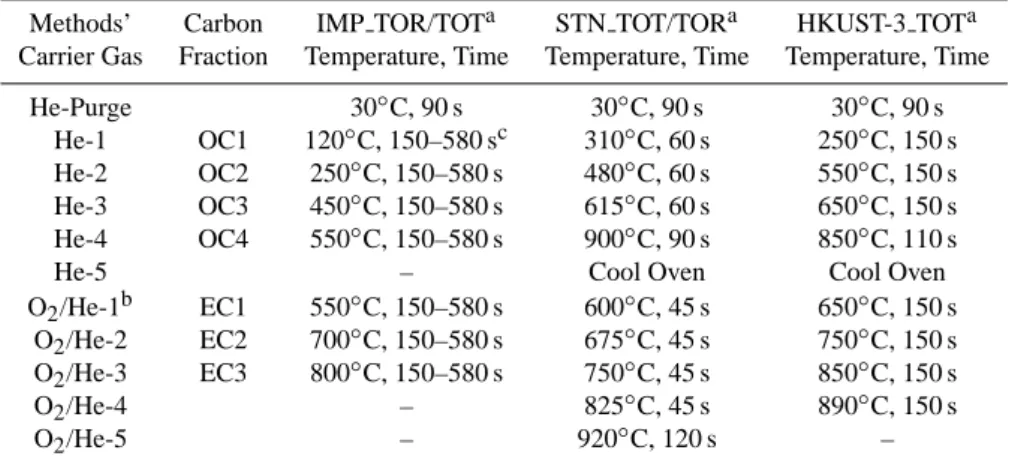
Table 1. Comparison of the IMPROVE, STN, and HKUST-3 thermal/optical analysis protocols.
Methods’ Carbon IMP TOR/TOTa STN TOT/TORa HKUST-3 TOTa Carrier Gas Fraction Temperature, Time Temperature, Time Temperature, Time
He-Purge 30◦C, 90 s 30◦C, 90 s 30◦C, 90 s He-1 OC1 120◦C, 150–580 sc 310◦C, 60 s 250◦C, 150 s He-2 OC2 250◦C, 150–580 s 480◦C, 60 s 550◦C, 150 s He-3 OC3 450◦C, 150–580 s 615◦C, 60 s 650◦C, 150 s He-4 OC4 550◦C, 150–580 s 900◦C, 90 s 850◦C, 110 s
He-5 – Cool Oven Cool Oven
O2/He-1b EC1 550◦C, 150–580 s 600◦C, 45 s 650◦C, 150 s
O2/He-2 EC2 700◦C, 150–580 s 675◦C, 45 s 750◦C, 150 s
O2/He-3 EC3 800◦C, 150–580 s 750◦C, 45 s 850◦C, 150 s
O2/He-4 – 825◦C, 45 s 890◦C, 150 s
O2/He-5 – 920◦C, 120 s –
aIMPROVE TOR: Thermal/optical reflectance analysis following the IMPROVE (Interagency Monitoring of Protected Visual
Environ-ments) protocol using DRI/OGC analyzers (Desert Research Institute, Reno, NV). IMPROVE TOR does not advance from one temperature to the next until a well-defined carbon peak has evolved (Chow et al., 1993, 2001, 2004a). Filter reflectance is monitored throughout the analysis; pyrolyzed OC (OP) is defined as the carbon evolving between the introduction of oxygen (O2)in the helium (He) atmosphere and
the return of reflectance to its initial value (the OC/EC split). OP is reported as a positive value if the reflection achieves its original value after the introduction of O2, and as a negative value if the reflection achieves its original value before O2is introduced. In either case, OC equals OC1+OC2+OC3+OC4+OP and EC equals EC1+EC2+EC3-OP. Eight well-defined fractions of carbon, including four OC fractions (OC1, OC2, OC3, and OC4), three EC fractions (EC1, EC2, and EC3), and OP are reported as part of the IMPROVE TOR protocol. IMPROVE TOR/TOT: Same as the IMPROVE TOR protocol but using a DRI Model 2001 thermal/optical carbon analyzer (Atmoslytic, Inc., Calabasas, CA). The DRI Model 2001 performs charring correction through both reflectance and transmittance, reported as OPR and OPT, respectively. Subsequently, OC and EC calculated from OPR (OPT) are referred to as OCR and ECR (OCT and ECT), respectively. STN TOR/TOT: Thermal/optical transmission/reflectance analysis following the Speciation Trends Network (STN) protocol. Filter transmittance is monitored to split OC and EC (STN TOT). With the DRI Model 2001 thermal/optical carbon analyzer, reflectance can also be recorded during the STN analyses. The protocol that uses STN temperature plateaus with a reflectance measurement is referred to as STN TOR. The STN protocol has a short and fixed residence time per temperature plateau and cannot report distinguishable carbon fractions. The STN protocol is currently applied to the United States PM2.5Speciation Trends Network.
HKUST-3 TOT: Thermal/optical transmission analysis following the HKUST-3 (Hong Kong University of Science and Technology, Clear Water Bay, Hong Kong, China) protocol using a Sunset Laboratory Carbon Aerosol Analysis Lab Instrument (Sunset Laboratory, Tigard, OR). The HKUST-3 transmittance protocol has a short and fixed residence time per temperature plateau and does not usually report distinguishable carbon fractions.
b2% O
2in He for IMPROVE and STN protocols, and 1% O2in He for HKUST-3 protocol.
c The residence time at each temperature in the IMPROVE protocol depends on when the flame ionization detector (FID) signal
returns to the baseline to achieve well-defined carbon fractions.
the evolution temperature have recently been found useful for estimating the source contributions to suspended particulate matter (PM) (Chow et al., 2004b; Kim and Hopke, 2004a, b, c; Kim et al., 2004; Lee et al., 2003; Maykutt et al., 2003; Strezov et al., 2003; Zhao and Hopke et al., 2004).
This paper describes a method applicable to thermal anal-ysis with optical detection that allows temperature sensors to be calibrated against actual sample temperatures. The method is applied to estimate the deviation of “target” (i.e., protocol or sample) from “measured” (i.e., thermocou-ple) temperatures for the Desert Research Institute/Oregon Graduate Center thermal/optical carbon analyzer (DRI/OGC, Desert Research Institute, Reno, NV); DRI Model 2001 thermal/optical carbon analyzer (Atmoslytic Inc., Calabasas,
CA); and the Sunset Laboratory Carbon Aerosol Analysis Lab Instrument (Sunset Laboratory, Tigard, OR) to quantify the temperature biases in the current experimental configu-rations. The effects of these deviations from target tempera-tures on OC, EC, and thermally-derived carbon fractions are examined. An algorithm is developed using the calibrations to reconcile the target and measured temperatures. Use of this calibration method is expected to allow deviations be-tween laboratories to be better understood, permit study of thermally-derived carbon fractions that might better repre-sent source contributions, and obtain better precision on OC, EC, and carbon fraction measurements.
2 Experimental apparatus and procedure
2.1 Thermal analysis methods
OC and EC are removed from sampling substrates (e.g., quartz-fiber filter) by volatilization, and/or combustion at se-lected temperatures, and by conversion of the released gases to carbon dioxide (CO2)or methane (CH4), followed by in-frared absorption (CO2) or flame ionization (CH4) detec-tion (Novakov, 1982; Huntzicker et al., 1982; Chow et al., 1993; Turpin et al., 1994; Birch and Cary, 1996). EC is not volatile and is only released by oxidation, typically in an oxygen-containing atmosphere at a temperature above 340◦C (Cachier et al., 1989a). Most of the atmospheric OC tends to evolve at a lower temperature (e.g., <550◦C) in an oxygen-free atmosphere; therefore, it can be separated from EC. Heating in an inert atmosphere, however, causes certain OC compounds to pyrolyze or char, thereby inflating the atmo-spheric EC in the sample. In thermal/optical carbon analysis (e.g., Chow et al., 1993, 2001), a red light laser monitors the darkening of the particle deposit on the filter due to OC charring. When the reflected or transmitted light attains its original intensity, the pyrolyzed OC (i.e., OP) is considered to have been removed and the remaining carbon is assumed to be the EC that was originally on the filter. Although the principles of thermal methods appear to be similar, they con-tain subtle variations with respect to: location of the tem-perature monitor (i.e., thermocouple) relative to the sample; analysis atmospheres; temperature ramping rates; tempera-ture plateaus; residence time at each plateau; optical pyrol-ysis monitoring configuration; carrier gas flow through or across the sample; and oven flushing conditions. These dif-ferences are not always well-characterized or reported with the analysis results.
The rate of OC volatilization or EC oxidation reaction ki-netics can be described by the Arrhenius (1889) equation:
− 1 [C] X i d[C] dt i =X i ki = X i Ai×exp( −Ea,i RT ) (1) where:
[C] = total carbon compound concentration
i= reaction of mechanism dependent chemical species
ki= rate constant for reaction i
Ai= dynamic constant for reaction i
Ea,i = activation energy for reaction i
R= universal gas constant (8.314×10⁻³kJ mol−1K−1) T = temperature (◦K)
where the reaction rate ki (volatilization, pyrolysis, oxida-tion, etc.) increases nonlinearly with temperature. A signif-icant change in reaction rate occurs as the temperature ap-proaches that of the activation energy (i.e, Ea,i/R), which differs for different chemical compounds. The temperature program influences the evolution of OC and EC, and possibly the OC/EC split (Chow et al., 2001, 2004a). The rates and
quantities of carbon leaving the sample at different tempera-tures reflect the composition of carbonaceous material in the sample (Chow et al., 2005; Currie et al., 2002). In addition to OC and EC, temperature-resolved carbon fractions have been reported from major ambient networks. For example, the IMPROVE network that monitors United States national parks, wilderness areas, and wildlife preserves reports eight carbon fractions between 120◦C and 800◦C (Table 1). The STN operates in urban areas of the United States and reports four thermally-derived sub-fractions of OC resolved by the analysis temperature program (Table 1).
2.2 Carbon analyzers
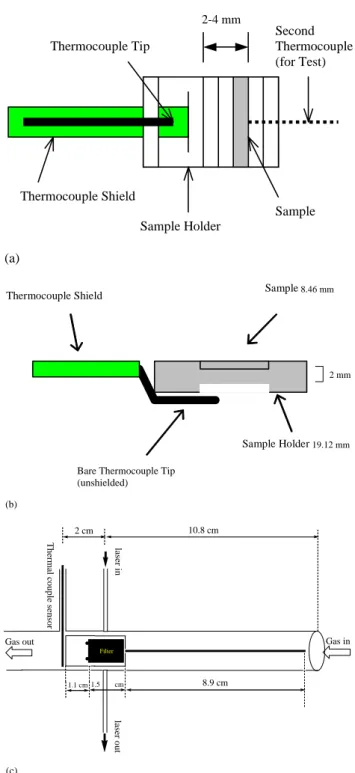
The DRI/OGC analyzers have been used for thermal/optical reflectance (TOR) analysis of quartz-fiber filter samples ac-quired from the IMPROVE network and other ambient and source characterization studies since 1986 following the IMPROVE TOR charring correction protocol (Chow et al., 1993). The Sunset analyzer implements thermal/optical transmission (TOT) charring corrections for the NIOSH (1999), STN (Peterson and Richards, 2002), and the Hong Kong University of Science and Technology (HKUST-3) (Yang and Yu, 2002) thermal protocols. The Model 2001 analyzer implements both the TOR and TOT charring cor-rections for all temperature protocols. The IMPROVE, STN, and HKUST-3 temperature protocols are documented in Ta-ble 1 and instrument configurations are compared in TaTa-ble 2. Figure 1 illustrates the location of the temperature sensor rel-ative to the sample for each analyzer. Thermocouples do not contact the sample punch in any of the instruments. Sam-ple temperatures may differ from the thermocouSam-ple tempera-ture due to: 1) different thermal properties of the sample and thermocouple; 2) temperature gradients in the sample oven; and/or 3) temperature gradients between the sample oven and the oxidation oven.
The DRI/OGC analyzer uses a Nichrome heating coil (Marchi Associates, SDH 175, Redwood City, CA) that is partially exposed to the ambient air without insulation. The temperature gradient in the sample heating zone varies from
∼20◦C/cm at 1% power output to ∼50◦C/cm at 75% power output (>600◦C). A shielded Omega Type-K thermocouple (Stamford, CT) serves as both a temperature sensor and a pushrod to which the sample holder is attached. Sample punches are loaded and manually inserted into the heating zone. The thermocouple tip is separated from the sample punch by 2 to 4 mm (Fig. 1a). The ungrounded Type-K ther-mocouple requires approximately 18 s to equilibrate its re-sponse at a given temperature plateau.
In the Model 2001 analyzer, the sample punch is placed in a quartz holder oriented parallel to the direction of the car-rier gas flow. Sample insertion is controlled by an electric stepper motor that ensures a repeatable sample position in the oven by a pushrod containing the thermocouple. The external shield for this grounded Type-K thermocouple is
2964 J. C. Chow et al.: Refining temperature measures in thermal/optical carbon analysis
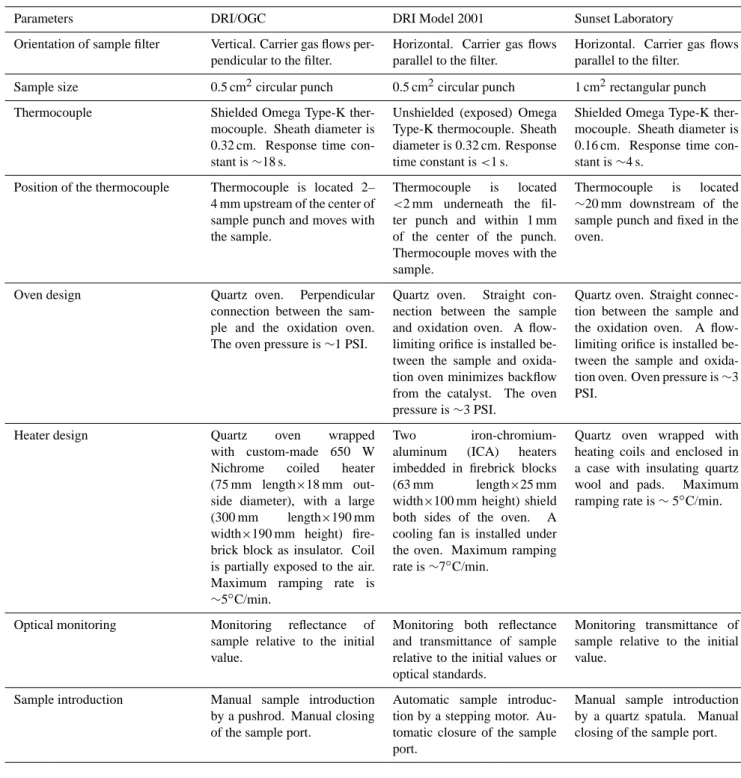
Table 2. Intercomparisons between DRI/OGC, DRI Model 2001, and Sunset Laboratory thermal/optical carbon analyzers.
Parameters DRI/OGC DRI Model 2001 Sunset Laboratory Orientation of sample filter Vertical. Carrier gas flows
per-pendicular to the filter.
Horizontal. Carrier gas flows parallel to the filter.
Horizontal. Carrier gas flows parallel to the filter.
Sample size 0.5 cm2circular punch 0.5 cm2circular punch 1 cm2rectangular punch Thermocouple Shielded Omega Type-K
ther-mocouple. Sheath diameter is 0.32 cm. Response time con-stant is ∼18 s.
Unshielded (exposed) Omega Type-K thermocouple. Sheath diameter is 0.32 cm. Response time constant is <1 s.
Shielded Omega Type-K ther-mocouple. Sheath diameter is 0.16 cm. Response time con-stant is ∼4 s.
Position of the thermocouple Thermocouple is located 2– 4 mm upstream of the center of sample punch and moves with the sample.
Thermocouple is located <2 mm underneath the fil-ter punch and within 1 mm of the center of the punch. Thermocouple moves with the sample.
Thermocouple is located ∼20 mm downstream of the sample punch and fixed in the oven.
Oven design Quartz oven. Perpendicular connection between the sam-ple and the oxidation oven. The oven pressure is ∼1 PSI.
Quartz oven. Straight con-nection between the sample and oxidation oven. A flow-limiting orifice is installed be-tween the sample and oxida-tion oven minimizes backflow from the catalyst. The oven pressure is ∼3 PSI.
Quartz oven. Straight connec-tion between the sample and the oxidation oven. A flow-limiting orifice is installed be-tween the sample and oxida-tion oven. Oven pressure is ∼3 PSI.
Heater design Quartz oven wrapped with custom-made 650 W Nichrome coiled heater (75 mm length×18 mm out-side diameter), with a large (300 mm length×190 mm width×190 mm height) fire-brick block as insulator. Coil is partially exposed to the air. Maximum ramping rate is ∼5◦C/min.
Two iron-chromium-aluminum (ICA) heaters imbedded in firebrick blocks (63 mm length×25 mm width×100 mm height) shield both sides of the oven. A cooling fan is installed under the oven. Maximum ramping rate is ∼7◦C/min.
Quartz oven wrapped with heating coils and enclosed in a case with insulating quartz wool and pads. Maximum ramping rate is ∼ 5◦C/min.
Optical monitoring Monitoring reflectance of sample relative to the initial value.
Monitoring both reflectance and transmittance of sample relative to the initial values or optical standards.
Monitoring transmittance of sample relative to the initial value.
Sample introduction Manual sample introduction by a pushrod. Manual closing of the sample port.
Automatic sample introduc-tion by a stepping motor. Au-tomatic closure of the sample port.
Manual sample introduction by a quartz spatula. Manual closing of the sample port.
removed to reduce the response time to less than one second, and the sensor tip is located <2 mm under the edge of the fil-ter punch to minimize infil-terference with the reflectance and transmittance measurements (Fig. 1b). Two iron-chromium-aluminum (ICA) heaters are insulated by firebrick blocks to avoid heat dissipation. The temperature sensor is always in the same position relative to the sample, and the sample is in the same part of the oven, until the thermocouple is replaced.
The Sunset Laboratory analyzer locates the sample punch on a transparent quartz spatula that is placed at the same loca-tion in the oven. The sample holder has a flat (2 cm2)surface at one end to hold a filter sample and a long stem to facil-itate the manual loading of the filter sample into the oven. The quartz oven, which is enclosed in a case insulated with quartz wool and pads, is wrapped by a Nichrome heating coil (Sciare et al., 2003). As shown in Fig. 1c, the thermocouple
is in a fixed location ∼20 mm downstream of the filter punch center. The sample is placed between two stops on the flat end of the sample holder to ensure its precise position.
In each instrument, the evolved carbon is first converted to CO2through an oxidizer (manganese dioxide [MnO2] at
∼900◦C). The CO
2 is then reduced to CH4 as the carrier gas passes through a granulated firebrick impregnated with nickel catalyst at ∼400◦C. The CH4 is then quantified by a flame ionization detector (FID). The FID is operated at a time resolution of one second. The same type of red light (632.8 nm) helium-neon laser is used for charring correction among the three different models of carbon analyzers. 2.3 Temperature indicators
Since it is not possible to sense the temperature of the sam-ple directly, materials were sought that: 1) could be placed where the sample would normally be located and 2) would yield a rapid signal when a known temperature was achieved. Metallic melting point standards (e.g., tin at 232◦C and zinc at 420◦C) exhibit sharp changes in heat capacity, conduc-tivity, and/or viscosity at their phase transition points; how-ever, these properties are not detected by the FID or optics. Organic melting point standards rely on the change in va-por pressure at the phase transition point, and this change can be detected by the FID; however, these compounds often evaporate or sublimate prior to boiling, thereby smearing the FID response. The FID response is further diffused as vapor passes through the oxidation and reduction ovens.
Quick-drying temperature-indicating liquids of different melting points, Tempilaq◦G (Tempil Inc., South Plainfield, NJ, USA), are used as temperature indicators in muffle fur-naces. A Tempilaq◦G liquid contains long-chain hydrocar-bons suspended in an organic solvent. Currently, Tempilaq◦ G liquids are manufactured for indicating 44 specific tem-peratures spanning from 80 to 1100◦C. The accuracy of Tempilaq◦G is certified within ±1% of its designated tem-perature and is traceable to the National Institute of Stan-dards and Technology (NIST). Tempilaq◦G is bottled in liq-uid form and dries quickly to a dull film when applied to a surface. As the surface is heated to the designated tem-perature, the film liquefies and is accompanied by a change of appearance that can be optically monitored to determine sample temperature.
2.4 Standard preparation
Temperature calibration requires a pre-fired quartz-fiber filter (#2500 QAT-UP, Pall Life Sciences, Ann Arbor, MI) punch (0.5 cm2 for DRI analyzers and 1.0 cm2 for the Sunset an-alyzer) and a clean matching-sized quartz glass disk (Con-tinental Glass Engineering, Burbank, CA). Quartz-fiber fil-ter punches are sliced in half with a filfil-ter-sectioning device (Fung et al., 2004). A thin layer of Tempilaq◦ G (25 µL) is uniformly applied to the quartz disk surface with a 0.1 ml
20 Thermocouple Shield Thermocouple Tip Sample Sample Holder 3 - 8mm Second Thermocouple (for Test) (a) Thermocouple Shield
Bear Thermocouple Tip unshielded) Sample Sample Holder (b) 2-4 mm 19.12 mm 8.46 mm 2 mm
Bare Thermocouple Tip (unshielded) 20 Thermocouple Shield Thermocouple Tip Sample Sample Holder 3 - 8mm Second Thermocouple (for Test) (a) Thermocouple Shield
Bear Thermocouple Tip unshielded) Sample Sample Holder (b) 2-4 mm 19.12 mm 8.46 mm 2 mm
Bare Thermocouple Tip (unshielded) 21
.
.
2 cm 1.1 cm 10.8 cm 1.5 cm 8.9 cm las er in la se r o u t Gas in Gas out Th ermal co up le se nsor Filter (c) Figure 1.Fig. 1. Schematic diagram of sample holders for the: (a)
Desert Research Institute/Oregon Graduate Center (DRI/OGC) thermal/optical carbon analyzer; (b) DRI Model 2001
ther-mal/optical carbon analyzer; and (c) Sunset Laboratory Carbon Aerosol Analysis Lab Instrument.
Eppendorf graduated Combitip (Brinkman Instruments Inc., Westbury, NY), and it is immediately (before drying) covered with a sliced filter punch. For cost savings, a glass – instead of quartz – disk can be used for Temiplaq◦G at temperatures
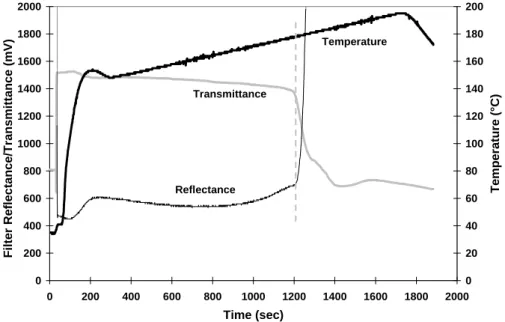
2966 J. C. Chow et al.: Refining temperature measures in thermal/optical carbon analysis 20 0 200 400 600 800 1000 1200 1400 1600 1800 2000 0 200 400 600 800 1000 1200 1400 1600 1800 2000 Time (sec) F ilter Reflec tance/Tr ansmittance (mV) 0 20 40 60 80 100 120 140 160 180 200 Temp er atur e (°C) Transmittance Reflectance Temperature Figure 2.
Fig. 2. Temperature ramping with a Tempilaq◦G temperature indicator rated at 184◦C for the DRI Model 2001 carbon analyzer. The vertical dashed line shows where the appearance of the temperature indicator changed, as detected by both reflected and transmitted light.
less than 520◦C. The disk sandwich (i.e., temperature stan-dard) is loaded into the analyzer sample holder for analysis. The coating must be sufficiently heavy to color the filter, but not so heavy as to render the sample opaque to transmitted light.
2.5 Temperature program
After insertion of the temperature standard into the analyzer, the temperature is slowly (2◦C/min) ramped across a 50◦C range containing the specified Tempilaq◦ G melting point. This slow ramping creates a quasi-equilibrium condition that allows the phase transition point to be resolved. When the specified temperature is reached, the Tempilaq◦G liquefies, causing a sharp change in reflectance and transmittance.
Figure 2 demonstrates the thermocouple temperature, re-flectance, and transmittance as a function of analysis time for the calibration temperature program. The reflectance and transmittance remain relatively flat until the temperature ap-proaches its specified value of 184◦C. Figure 3 compares the time series of reflectance, transmittance, and their respective first- and second- order derivatives. The second-order deriva-tive (change in the slope) records the inflection point of re-flectance or transmittance that provides the best indication of the attainment of the designated temperature. Thermocouple temperature at this critical point is recorded as “measured” temperature. The temperature deviation (1T ) between the sample and the thermocouple temperatures is determined by comparing the rated Tempilaq◦G temperature with this mea-sured value.
In the Model 2001, the reflectance-based method generally gives a lower liquefying temperature than the
transmittance-based method, within ±2◦C. Given the uncertainty in the Tempilaq◦G temperature rating of ±1%, calibrations based on the two optical methods are considered to be equivalent; therefore, their means are used. Among temperature indi-cators that achieve an adequate signal/noise ratio, the 121, 184, 253, 510, 649, 704, and 816◦C mixtures were chosen for IMPROVE protocol temperature calibration, whereas the 121, 184, 253, 510, 649, and 927◦C mixtures were used for the HKUST-3 protocol. Replicate analyses were performed to evaluate the precision of temperature deviations.
3 Analysis results and instrument variations
Five DRI/OGC (CA #1–#5), five DRI Model 2001 (CA #6– #11), and one Sunset analyzers were tested. Tables 3 to 5 summarize the average temperature deviations at each test temperature for the 11 analyzers. A positive temperature deviation indicates that the thermocouple sensor underesti-mates the sample temperature and vice-versa.
For the Model 2001 analyzers, the sample temperature was
<10◦C hotter than the sensor reading at the lowest two tem-peratures (<200◦C), and increased to 20 to 30◦C hotter at the higher temperatures (Table 3). The precision of tempera-ture deviations (i.e., σ1T), determined from the standard de-viation of multiple replicate analyses, was generally within
±4◦C. This reflects the consistency of analytical conditions among the five analyzers. Table 3 shows nearly linear rela-tionships between the target and measured temperatures with high correlations. Thus, a constant temperature offset of 3 to 12◦C can be adjusted in the carbon analyzer software to reflect sample temperatures.
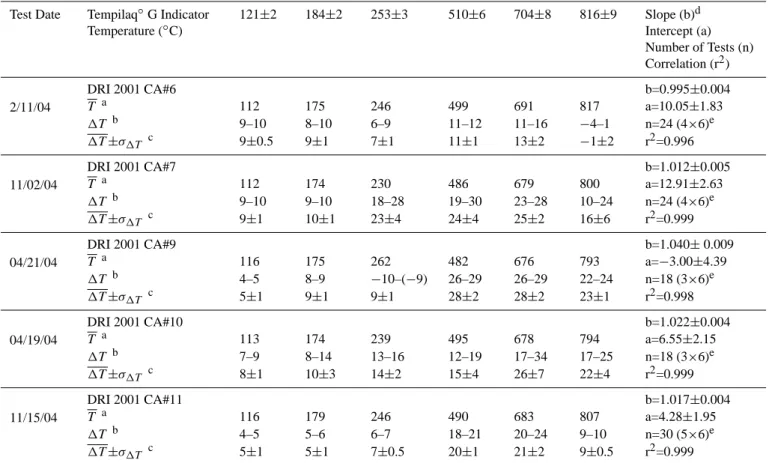
Table 3. Summary of temperature calibration for five DRI Model 2001 thermal/optical carbon analyzers (CA #6–11).
Test Date Tempilaq◦G Indicator Temperature (◦C) 121±2 184±2 253±3 510±6 704±8 816±9 Slope (b)d Intercept (a) Number of Tests (n) Correlation (r2) 2/11/04 DRI 2001 CA#6 b=0.995±0.004 T a 112 175 246 499 691 817 a=10.05±1.83 1T b 9–10 8–10 6–9 11–12 11–16 −4–1 n=24 (4×6)e 1T ±σ1T c 9±0.5 9±1 7±1 11±1 13±2 −1±2 r2=0.996 11/02/04 DRI 2001 CA#7 b=1.012±0.005 T a 112 174 230 486 679 800 a=12.91±2.63 1T b 9–10 9–10 18–28 19–30 23–28 10–24 n=24 (4×6)e 1T ±σ1T c 9±1 10±1 23±4 24±4 25±2 16±6 r2=0.999 04/21/04 DRI 2001 CA#9 b=1.040± 0.009 T a 116 175 262 482 676 793 a=−3.00±4.39 1T b 4–5 8–9 −10–(−9) 26–29 26–29 22–24 n=18 (3×6)e 1T ±σ1T c 5±1 9±1 9±1 28±2 28±2 23±1 r2=0.998 04/19/04 DRI 2001 CA#10 b=1.022±0.004 T a 113 174 239 495 678 794 a=6.55±2.15 1T b 7–9 8–14 13–16 12–19 17–34 17–25 n=18 (3×6)e 1T ±σ1T c 8±1 10±3 14±2 15±4 26±7 22±4 r2=0.999 11/15/04 DRI 2001 CA#11 b=1.017±0.004 T a 116 179 246 490 683 807 a=4.28±1.95 1T b 4–5 5–6 6–7 18–21 20–24 9–10 n=30 (5×6)e 1T ±σ1T c 5±1 5±1 7±0.5 20±1 21±2 9±0.5 r2=0.999 aT is the average measured temperature.
b1T is the difference between the rated Tempilaq◦
G (target) and thermocouple (measured) temperatures.
c1T ±σ
1T indicates the average and standard deviation of 1T . dRated Tempilaq◦
G temperature (Y) versus thermocouple temperature (X).
eNumber of replicates times the number of temperature plateaus.
Temperature tests for DRI/OGC analyzers contain two analyses in which 1T for both the maximum and minimum sample-to-thermocouple distances were determined. Table 4 shows that the sample temperature was 10 to 50◦C hotter than the sensor readings at all temperature ranges, except for CA #1, where a 1T of 57–77◦C was found for the highest temperature (704◦C). Besides inter-analyzer differ-ences, temperatures varied by more than 20◦C in replicate tests for a given analyzer. This variability exceeds the uncer-tainty of Tempilaq◦G (±1%). The linear regression of this rated Tempilaq◦G (target) temperature against thermocouple (measured) temperature yields slopes and intercepts that are associated with larger standard deviations (Table 4). Accord-ing to Eq. (1), the effect of temperature bias may be more pronounced at lower temperatures.
For the Sunset analyzer, the sample temperature was 12 to 33◦C hotter than the sensor reading for the two lowest and highest temperatures, and 2 to 11◦C cooler for the two
mid-dle temperatures. The good reproducibility (∼±1%) for the Sunset and Model 2001 analyzers is sufficient to confirm dif-ferences between the target and measured temperatures.
4 Temperature calibration
Temperature bias during thermal carbon analysis can vary among different designs of instruments, within the same model of analyzer, and among replicate analyses. Periodic temperature calibration and performance testing is needed to achieve good reproducibility of carbon fraction measure-ments. Linear calibration curves can be generated, as illus-trated in Fig. 4.
Tsample(target)=b × Tthermocouple(measured)+a (2) where Tsample(target)is the set point temperature specified by the analytical protocols and Tthermocouple(measured)is the sen-sor reading of a thermocouple. Variables a and b are the
2968 J. C. Chow et al.: Refining temperature measures in thermal/optical carbon analysis
Table 4. Summary of temperature calibration for five DRI/OGC thermal/optical carbon analyzers (CA #1–5).
Test Date Tempilaq◦ G Indicator Temperature (◦C) 121±2 184±2 253±3 510±6 704±8 816±9 Slope (b)d Intercept (a) Number of Tests (n) Correlation (r2) 03/17/04 DRI/OGC CA#1 b=1.03±0.028 T a 84 147 209 469 637 N/Ac a=32.99±10.52 1T b 36–37 33–41 37–51 40–43 57–77 N/A n=10 (2×5)e r2=0.994 03/18/04 DRI/OGC CA#2 b=1.02±0.005 T a 103 162 230 480 676 N/A a=18.99±2.11 1T b 14–22 22–23 23–25 30–32 26–30 N/A n=10 (2×5)e r2=0.999 03/22/04 DRI/OGC CA#3 b=1.04±0.009 T a 110 170 237 482 672 N/A a=8.13±3.44 1T b 9–14 11–18 11–22 22–34 26–38 N/A n=10 (2×5)e r2=0.999 03/23/04 DRI/OGC CA#4 b=1.01±0.007 T a 107 166 244 493 682 N/A a=13.17±2.92 1T b 11–17 16–20 8–20 15–20 18–28 N/A n=10 (2×5)e r2=0.999 03/24/04 DRI/OGC CA#5 b=1.04±0.010 T a 98 155 219 473 656 N/A a=23.21±4.02 1T b 21–26 27–33 33–36 27–48 43–53 N/A n=10 (2×5)e r2=0.999
aT is the average measured temperature.
b1T is the difference between the rated Tempilaq◦
G (target) and thermocouple (measured) temperatures.
cThe DRI/OGC analyzer has a maximum temperature of 800◦C. dRated Tempilaq◦
G temperature (Y) versus thermocouple temperature (X).
eNumber of replicates times the number of temperature plateaus.
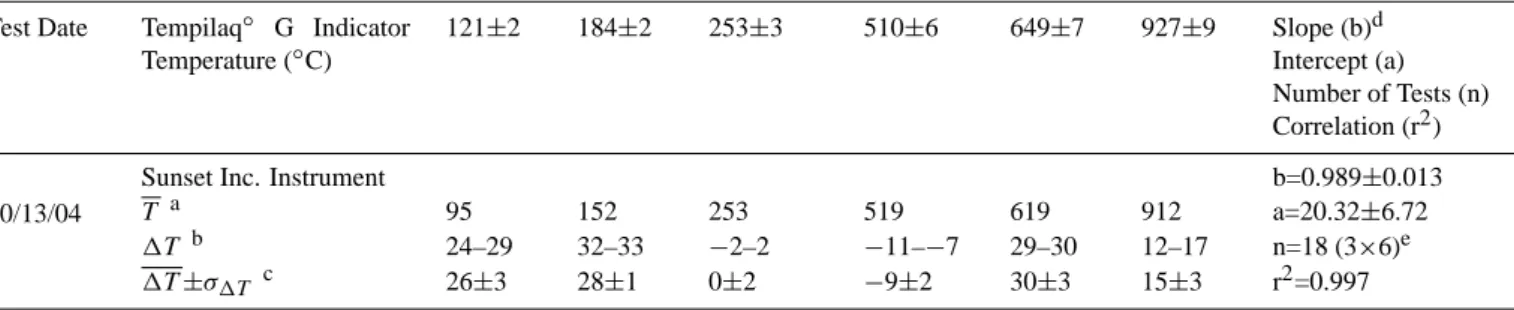
Table 5. Summary of temperature calibration for the Sunset Laboratory Carbon Aerosol Analysis Lab Instrument.
Test Date Tempilaq◦ G Indicator Temperature (◦C) 121±2 184±2 253±3 510±6 649±7 927±9 Slope (b)d Intercept (a) Number of Tests (n) Correlation (r2) 10/13/04
Sunset Inc. Instrument b=0.989±0.013
T a 95 152 253 519 619 912 a=20.32±6.72
1T b 24–29 32–33 −2–2 −11–−7 29–30 12–17 n=18 (3×6)e 1T ±σ1T c 26±3 28±1 0±2 −9±2 30±3 15±3 r2=0.997 aT is the average measured temperature.
b1T is the difference between the rated Tempilaq◦G (target) and thermocouple (measured) temperatures. cIndicates the average and standard deviation of 1T .
dRated Tempilaq◦G temperature (Y) versus thermocouple temperature (X). eThe 927◦
C standard was used in place of the 816◦C standard to better represent the larger temperature range spanned by the HKUST-3 temperature protocol.
J. C. Chow et al.: Refining temperature measures in thermal/optical carbon analysis 2969 21 0 400 800 1200 1600 2000 2400 2800 0 200 400 600 800 1000 1200 1400 1600 1800 2000 Time (sec) -35 -25 -15 -5 5 15 25 35 First/Sec o nd Deriv a tive L a s e r Refl ec tance/T ransmi tta n c e (mV)
(Tempilaq’s melting point 184 ± 2 ºC)
Transmittance Reflectance 1stReflectance Derivative 1stTransmittance Derivative 2ndReflectance Derivative 2ndTransmittance Derivative Figure 3.
Tempilaq° G’s melting point 184 ± 2 °C
Fig. 3. Reflectance and transmittance measurements and their first and second derivatives over time with a Tempilaq◦G temperature indicator rated at 184◦C (Fig. 2). The vertical dashed line indicates the achievement of the rated target temperature.
(a) 20 . y = 1.012x + 12.908 R2 = 0.999 0 100 200 300 400 500 600 700 800 900 0 100 200 300 400 500 600 700 800 900
Thermocouple (measured) Temperature (°C)
Sa mp le (targe t) T e mperatu re (°C ) Model 2001 (CA#7) (a) (b) 21 y = 0.989x + 20.322 R2 = 0.997 0 100 200 300 400 500 600 700 800 900 1000 0 100 200 300 400 500 600 700 800 900 1000 Thermocouple (measured) Temperature (oC)
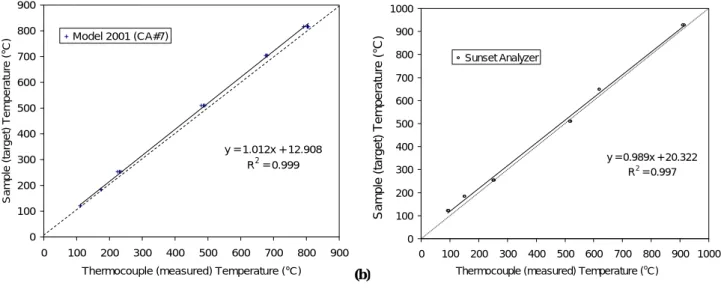
S a m p le ( tar g e t) T e m per at u re ( oC) Sunset Analyzer (b) Figure 4. S a mple (target ) Temperature (°C)
Fig. 4. Linear regression of sample (target) temperature against thermocouple (measured) temperature for the: (a) DRI Model 2001 (CA #7);
and (b) Sunset Laboratory carbon analyzers.
intercept and slope, respectively, and are determined from the least-square linear regression between the target and mea-sured temperatures from the tests. Set-point temperatures can be adjusted so that Tsample=Tthermocouple, or the software can be modified to accommodate the calibration. In either case, the temperature reported should reflect the sample tempera-ture, not the thermocouple temperature.
Five ambient samples acquired from the Fresno Su-persite (Watson et al., 2000) were analyzed by a Model 2001 analyzer with and without the adjustment after the
temperature calibration. These samples represent an ur-ban environment where contributions from vegetative burn-ing, cookburn-ing, gasoline- and diesel-vehicle exhaust, and sec-ondary organic aerosol vary throughout the year (Poore, 2002; Schauer and Cass, 2000; Watson and Chow, 2002a, b; Watson et al., 2000, 2002). TC concentrations of the five samples ranged from 3.5 to 15 µg m−3. Figure 4 shows that
Tthermocouple underestimates Tsample; deviations from linear-ity suggest temperature inhomogenelinear-ity in the heating zone. Based on the temperature calibration results, the samples
2970 J. C. Chow et al.: Refining temperature measures in thermal/optical carbon analysis 22 -100% -80% -60% -40% -20% 0% 20% 40% 60% 80% 100% OC1 OC 2 OC 3 OC 4 EC 1 EC 2 EC 3 OP R OP T
OCR ECR OCT ECT TC
Percent D if ference of Carb on Fractions after Tempe rat u re Calib rat io n -25 -20 -15 -10 -5 0 5 10 15 20 25 Estima
ted Sample Temperature Diff
ere n c e after Te mperature Calibration
IMPROVE Protocol Carbon Fractions Sample Temperature Difference
Figure 5.
Fig. 5. Changes in carbon fractions after adjustment for
tempera-ture calibration (Fig.4) with the DRI Model 2001 carbon analyzer (CA#7). Statistics are based on average and standard deviation of analysis results of five ambient samples from the Fresno Supersite (TC: 3.5–15 µg m−3). Sample (target) temperature is lowered by 14 to 22◦C after the calibration. Carbon fractions are defined in Table 1.
were re-analyzed using a modified IMPROVE protocol in which the temperature was lowered by 14 to 22◦C. Figure 5 shows that while these temperature deviations did not change the OC/EC split for TOR or TOT, cooler temperatures re-duced the low temperature OC fractions (OC1–OC3) and increased the high temperature OC4 and EC fractions. Af-ter the adjustment based on temperature calibration, the av-erage changes in OC1 (120◦C) and EC2 (700◦C) exceeded 30%, partially due to low carbon concentrations in these car-bon fractions. OC1 represents semi-volatile organics, which are possibly adsorbed organic vapors. Charred OC (by re-flectance or transmittance) increased by ∼20% when the sample temperature was lowered by 14 to 22◦C.
Lower analysis temperatures (after calibration) did not change the OC/EC split for these examples, and the reduced OC1 and OC3 fractions were compensated by the inflated pyrolysis fraction. While carbon fraction measurements may vary between different analyzers due to uncertain analysis temperatures, this study shows that the OC/EC split through optical charring correction is less perturbed, at least for the IMPROVE TOR protocol. The transmittance-based charring correction may be more dependent on analysis temperatures owing to charring of adsorbed organic vapors within the fil-ter that affect transmittance more than reflectance from the surface deposit (Chow et al., 2004a; Chen et al., 2004)
5 Summary and conclusions
A method has been presented that can relate the sample tem-perature to the sensor temtem-perature in thermal/optical car-bon analyzers. It uses temperature-sensitive compounds that
change their appearance when they reach a target tempera-ture.
Five to six temperature indicators, covering a range of 120 to 930◦C, were used to evaluate the temperature measures in three different carbon analyzer models: the DRI/OGC, DRI Model 2001, and Sunset analyzers. Thermocouple sen-sors often underestimated the sample temperature; however, the bias in the DRI Model 2001 tended to be smaller and more consistent (<10◦C for temperatures <200◦C and <20 to 30◦C for higher temperatures). There was a linear rela-tionship between target and measured temperatures with high correlation. The DRI/OGC analyzer reported temperatures that were 10 to 50◦C lower than the target sample tempera-tures, and that varied by as much as 20◦C for replicate analy-sis. The temperature bias in the Sunset analyzer used in this test was less than 30◦C, but it did not appear to be as linearly related to the target temperatures as the other analyzers.
Even though temperature variations of up to 50◦C do not appear to alter the OC and EC concentrations with the IM-PROVE thermal protocol, they do change the abundances of different carbon fractions from thermal/optical analysis. When applied to ambient samples from the urban Fresno Su-persite, a calibration that corrected for a 14 to 22◦C posi-tive bias resulted in changes greater than 30% in the IM-PROVE protocol for low temperature OC (OC1 at 120◦C) and high temperature EC (EC2 at 700◦C) fractions. Refining temperature measures in thermal/optical analysis for trends networks is necessary to ensure the consistency of carbon fraction measurements. This will reduce the degree of mis-interpretation of the data in the future. The techniques devel-oped in this study can reduce variability in thermal/optical analysis and be systematized into procedures that are appli-cable to a wide variety of instruments.
Acknowledgements. This work was sponsored in part by the
National Park Service IMPROVE Carbon Analysis Contract No. C2350000894, the U.S. Environmental Protection Agency STAR Grant No. RD-83108601-0, and the Fresno Supersite U.S. EPA Cooperative Agreement No. R-82805701. The conclusions are those of the authors and do not necessarily reflect the views of the sponsoring agencies. Any mention of commercially available products and supplies does not constitute an endorsement of these products and supplies. The authors wish to thank T. Bohannan of the Desert Research Institute (DRI) for assisting with the temperature calibration and J. Gerrard, E. Dieterle, and P. T. Richard of DRI for assembling and editing the manuscript. Edited by: R. Hitzenberger
References
Arrhenius, S.: ¨Uber die Reaktionsgeschwindigkeit bei der Inversion von Rohzucker durch S¨auren, Z. Phys. Chem., 4 (26), 226–248, 1889.
Birch, M. E. and Cary, R. A.: Elemental carbon-based method for monitoring occupational exposures to particulate diesel exhaust, Aerosol Sci. Technol., 25 (3), 221–241, 1996.
Cachier, H., Bremond, M. P., and Buat-M´enard, P.: Thermal sep-aration of soot carbon, Aerosol Sci. Technol., 10 (2), 358–364, 1989a.
Cachier, H., Bremond, M. P., and Buat-M´enard, P.:. Determination of atmospheric soot carbon with a simple thermal method, Tellus, 41B (3), 379–390, 1989b.
Cadle, S. H. and Groblicki, P. J.: An evaluation of methods for the determination of organic and elemental carbon in particu-late samples, in: Particuparticu-late Carbon: Atmospheric Life Cycles, edited by: Wolff, G. T. and Klimisch, R. L., Plenum Press, New York, NY, 89–109, 1982.
Cao, J. J., Lee, S. C., Zhang, X. Y., Chow, J. C., An, Z. S., Ho, K. F., Watson, J. G., Fung, K. K., Wang, Y. Q., and Shen, Z. X.: Characterization of airborne carbonate over a site near Asian dust source regions during spring 2002 and its climatic and en-vironmental significance, J. Geophys. Res., 110 (D03203), 1–8, 2005.
Chen, L.-W. A., Chow, J. C., Watson, J. G., Moosm¨uller, H., and Arnott, W. P.: Modeling reflectance and transmittance of quartz-fiber filter samples containing elemental carbon particles: Im-plications for thermal/optical analysis, J. Aerosol Sci., 35 (6), 765–780, 2004.
Chow, J. C., Watson, J. G., Pritchett, L. C., Pierson, W. R., Frazier, C. A., and Purcell, R. G.: The DRI Thermal/Optical Reflectance carbon analysis system: Description, evaluation and applications in U.S. air quality studies, Atmos. Environ., 27A (8), 1185–1201, 1993.
Chow, J. C., Watson, J. G., Crow, D., Lowenthal, D. H., and Mer-rifield, T.: Comparison of IMPROVE and NIOSH carbon mea-surements, Aerosol Sci. Technol., 34 (1), 23–34, 2001.
Chow, J. C. and Watson, J. G.: PM2.5 carbonate concentrations
at regionally representative Interagency Monitoring of Protected Visual Environment sites, J. Geophys. Res., 107 (D21), ICC 6-1–ICC 6-9, 2002.
Chow, J. C., Watson, J. G., Chen, L.-W. A., Arnott, W. P., Moosm¨uller, H., and Fung, K. K.: Equivalence of elemental carbon by Thermal/Optical Reflectance and Transmittance with different temperature protocols, Environ. Sci. Technol., 38(16), 4414–4422, 2004a.
Chow, J. C., Watson, J. G., Kuhns, H. D., Etyemezian, V., Lowen-thal, D. H., Crow, D. J., Kohl, S. D., Engelbrecht, J. P., and Green, M.C.: Source profiles for industrial, mobile, and area sources in the Big Bend Regional Aerosol Visibility and Obser-vational (BRAVO) Study, Chemosphere, 54 (2), 185–208, 2004b. Chow, J. C., Watson, J. G., Louie, P. K. K., Chen, L.-W. A., and Sin, D.: Comparison of PM2.5carbon measurement methods in
Hong Kong, China, Environ. Poll., 137, 334–344, 2005. Currie, L. A., Benner Jr., B. A., Cachier, H., Cary, R., Chow, J. C.,
Druffel, E. R. M., Eglinton, T. I., Gustafsson, ¨O., Hartmann, P. C., Hedges, J. I., Kessler, J. D., Kirchstetter, T. W., Klinedinst, D. B., Klouda, G. A., Marolf, J. V., Masiello, C. A., Novakov, T., Pearson, A., Prentice, K. M., Puxbaum, H., Quinn, J. G., Reddy,
C. M., Schmid, H., Slater, J. F., Watson, J. G., and Wise, S. A.: A critical evaluation of interlaboratory data on total, elemental, and isotopic carbon in the carbonaceous particle reference material, NIST SRM 1649a, J. Res. National Bureau Standards, 107 (3), 279–298, 2002.
Fung, K., Chow, J. C., Watson, J. G., and Chen, L. Y. A.: Determin-ing organic carbon adsorption on quartz fiber filters by sample splitting and thermal/optical analysis, Proceedings, 13th World Clean Air and Environmental Protection Congress and Exhibi-tion, London, UK, 26 August 2004.
Hitzenberger, R., Jennings, S. G., Larson, S. M., Dillner, A., Cachier, H., Galambos, Z., Rouc, A., and Spain, T. G.: Inter-comparison of measurement methods for black carbon aerosols, Atmos. Environ., 33 (17), 2823–2833, 1999.
Huntzicker, J. J., Johnson, R. L., Shah, J. J., and Cary, R. A.: Anal-ysis of organic and elemental carbon in ambient aerosols by a thermal-optical method, in: Particulate Carbon: Atmospheric Life Cycle, edited by: Wolff, G. T. and Klimisch, R. L., Plenum Press, New York, NY, 79–88, 1982.
Jacobson, M. Z.: Strong radiative heating due to the mixing state of black carbon in atmospheric aerosols, Nature, 409, 695–697, 2001.
Kim, E. and Hopke, P. K.: Comparison between conditional prob-ability function and nonparametric regression for fine particle source directions, Atmos. Environ., 38 (28), 4667–4673, 2004a. Kim, E. and Hopke, P. K.: Source apportionment of fine particles
at Washington, DC, utilizing temperature-resolved carbon frac-tions, JAWMA, 54 (7), 773–785, 2004b.
Kim, E. and Hopke, P. K.: Improving source identification of fine particles in a rural northeastern US area utilizing temperature-resolved carbon fractions, J. Geophys. Res., 109 (D9), D09204, 2004c.
Kim, E., Hopke, P. K., and Edgerton, E. S.: Improving source iden-tification of Atlanta aerosol using temperature resolved carbon fractions in positive matrix factorization, Atmos. Environ., 38 (20), 3349–3362, 2004.
Lavoisier, A.: Chapter 7. In Traite Elementaire de Chimie, Volume 2, Paris, France, 493–501, 1789.
Lee, P. K. H., Brook, J. R., Dabek-Zlotorzynska, E., and Mabury, S. A.: Identification of the major sources contributing to PM2.5
observed in Toronto, Environ. Sci. Technol., 37 (21), 4831–4840, 2003.
MacKenzie, R. C.: Differential Thermal Analysis, Vol. 1, Funda-mental Aspects, Academic Press, New York, NY, 1970. Maykut, N. N., Lewtas, J., Kim, E., and Larson, T. V.: Source
apportionment of PM2.5 at an urban IMPROVE site in Seattle,
Washington, Environ. Sci. Technol., 37 (22), 5135–5142, 2003. NIOSH: Method 5040 Issue 3 (Interim): Elemental carbon (diesel
exhaust), in: NIOSH Manual of Analytical Methods; National Institute of Occupational Safety and Health: Cincinnati, OH, 1999.
Novakov, T.: Soot in the atmosphere, in: Particulate Carbon: At-mospheric Life Cycle, edited by: Wolff, G. T. and Klimisch, R. L., Plenum Press, New York, NY, 19–41, 1982.
Peterson, M. R. and Richards, M. H.: Thermal-optical-transmittance analysis for organic, elemental, carbonate, total carbon, and OCX2 in PM2.5 by the EPA/NIOSH method, in:
Proceedings, Symposium on Air Quality Measurement Methods and Technology-2002, edited by: Winegar, E. D. and Tropp, R.
2972 J. C. Chow et al.: Refining temperature measures in thermal/optical carbon analysis
J., Air & Waste Management Association, Pittsburgh, PA, 83-1– 83-19, 2002.
Poore, M. W.: Levoglucosan in PM2.5 at the Fresno Supersite, JAWMA, 52 (1), 3–4, 2002.
Schauer, J. J. and Cass, G. R.: Source apportionment of wintertime gas-phase and particle-phase air pollutants using organic com-pounds as tracers, Environ. Sci. Technol., 34 (9), 1821–1832, 2002.
Schmid, H. P., Laskus, L., Abraham, H. J., Baltensperger, U., La-vanchy, V. M. H., Bizjak, M., Burba, P., Cachier, H., Crow, D., Chow, J. C., Gnauk, T., Even, A., ten Brink, H. M., Giesen, K. P., Hitzenberger, R., Hueglin, C., Maenhaut, W., Pio, C. A., Puttock, J., Putaud, J. P., Toom-Sauntry, D., and Puxbaum, H.: Results of the “Carbon Conference” international aerosol carbon round robin test: Stage 1, Atmos. Environ., 35 (12), 2111–2121, 2001. Sciare, J., Cachier, H., Oikonomou, K., Ausset, P., Sarda-Esteve, R., and Mihalopoulos, N.: Characterization of carbonaceous aerosols during the MINOS campaign in Crete, July–August 2001: A multi-analytical approach, Atmos. Chem. Phys., 3, 1743–1757, 2003,
SRef-ID: 1680-7324/acp/2003-3-1743.
Strezov, V., Moghtaderi, B., and Lucas, J. A.: Thermal study of decomposition of selected biomass samples, J. Thermal Anal. & Calorimetry, 72 (3), 1041–1048, 2003.
Turpin, B. J., Huntzicker, J. J., and Hering, S. V.: Investigation of organic aerosol sampling artifacts in the Los Angeles Basin, At-mos. Environ., 28 (19), 3061–3071, Research & Development, 1994.
Vedal, S.: Critical review – Ambient particles and health: Lines that divide, JAWMA, 47 (5), 551–581, 1997.
Watson, J. G., Chow, J. C., Bowen, J. L., Lowenthal, D. H., Hering, S., Ouchida, P., and Oslund, W.: Air quality measurements from the Fresno Supersite, JAWMA, 50 (8), 1321–1334, 2000. Watson, J. G.: Visibility: Science and regulation, JAWMA, 52 (6),
628–713, 2002.
Watson, J. G. and Chow, J. C.: A wintertime PM2.5episode at the
Fresno, CA, Supersite, Atmos. Environ., 36 (3), 465–475, 2002a. Watson, J. G. and Chow, J. C.: Comparison and evaluation of in-situ and filter carbon measurements at the Fresno Supersite, J. Geophys. Res., 107 (D21), ICC 3-1–ICC 3-15, 2002b.
Watson, J. G., Chow, J. C., Lowenthal, D. H., Stolzenburg, M. R., Kreisberg, N. M., and Hering, S. V.: Particle size relationships at the Fresno supersite; JAWMA, 52 (7), 822–827, 2002.
Watson, J. G., Chow, J. C., and Chen, L.-W. A.: Summary of or-ganic and elemental/black carbon analysis methods and inter-comparisons, Aerosol and Air Quality Research, 5 (10), 69–109, 2005.
Yang, H. and Yu, J. Z.: Uncertainties in charring correction in the analysis of elemental and organic carbon in atmospheric parti-cles by thermal/optical methods, Environ. Sci. Technol., 36 (23), 5199–5204, 2002.
Zhao, W. X. and Hopke, P. K.: Source apportionment for ambient particles in the San Gorgonio wilderness, Atmos. Environ., 38 (35), 5901–5910, 2004.