Abstract Cell attachment and spreading on solid surfaces was investigated with a home-made quartz crystal micro-balance (QCM), which measures the frequency, the tran-sient decay time constant and the maximal oscillation am-plitude. Initial interactions of the adsorbing cells with the QCM mainly induced a decrease of the frequency, coinci-dent with mass adsorption. After about 80 min, the fre-quency increased continuously and after several hours ex-ceeded the initial frequency measured before cell adsorp-tion. Phase contrast and fluorescence microscopy indi-cated that the cells were firmly attached to the quartz sur-face during the frequency increase. The measurements of the maximal oscillation amplitude and the transient decay time constant revealed changes of viscoelastic properties at the QCM surface. An important fraction of these changes was likely due to alterations of cytosolic viscosity, as sug-gested by treatments of the attached cells with agents af-fecting the actin and microtubule cytoskeleton. Our re-sults show that viscosity variations of cells can affect the resonance frequency of QCM in the absence of apparent cell desorption. The simultaneous measurements of the maximal oscillation amplitude, the transient decay time constant and the resonance frequency allow an analysis of cell adsorption to solid substratum in real time and com-plement cell biological methods.
Keywords Cell · QCM · Adsorption · Cytoskeleton · Amplitude · Decay time constant
Introduction
The shape and the mechanical properties of a cell are largely controlled by the cytoskeleton and the underlying regulatory circuits (reviewed in [1, 2, 3]). The cytoskele-ton and associated proteins critically influence basic cell functions, including growth, motility, apoptosis, and dif-ferentiation [4, 5], and also resistance towards deforma-tion [6, 7]. A variety of methods are available to study the mechanical properties of the cytoskeleton. Light micros-copy provides images of the dynamic shape of both, liv-ing and chemically fixed cells in time and space [8, 9]. Magnetic twisting cytometry measures the rotation of magnetic particles in contact with the cell membrane and serves to determine the cytoplasmic viscosity and consis-tency [10, 11, 12, 13]. Magnetic bead microrheometry gives similar information by measuring the position of the par-ticles [14, 15, 16]. Additional methods to measure con-tractile forces include pulling of adsorbed cells with a needle [17], micropipette aspiration of cells [18, 19, 20, 21], or directly poking cells [22, 23]. A major disadvan-tage of these methods is that they are invasive. In contrast, the quartz crystal microbalance (QCM) allows non-inva-sive measurements of mass adsorption and biophysical changes on defined substrata [24].
The QCM has been developed to measure molecular adsorption under vacuum [25, 26]. In this case the mea-sured resonance frequency shift of an oscillating quartz is linearly proportional to the adsorbed mass according to the Sauerbrey equation [27]. The QCM was further devel-oped to study adsorption in liquids [28]. This required to determine the mass-induced frequency shift and addi-tional physical properties, such as the density and viscos-ity of liquid [29]. When the quartz vibrates at its reso-nance frequency and is immersed into a fluid, an expo-nentially damped wave is coupled into the liquid. With 10-MHz quartz crystals under water loading at 37 °C the Carine Galli Marxer · Martine Collaud Coen ·
Thomas Greber · Urs F. Greber · Louis Schlapbach
Cell spreading on quartz crystal microbalance
elicits positive frequency shifts indicative of viscosity changes
DOI 10.1007/s00216-003-2080-1Received: 11 March 2003 / Revised: 1 May 2003 / Accepted: 20 May 2003 / Published online: 19 July 2003 O R I G I N A L PA P E R
C. Galli Marxer (✉) · M. Collaud Coen · L. Schlapbach Solid State Physics Research Group, University of Fribourg, Pérolles, 1700 Fribourg, Switzerland
e-mail: [email protected] T. Greber
Institute of Physics, University of Zürich, Winterthurerstrasse 190, 8057 Zürich, Switzerland U. F. Greber
Institute of Zoology, University of Zürich, Winterthurerstrasse 190, 8057 Zürich, Switzerland L. Schlapbach
Swiss Federal Laboratories for Materials Testing and Research, Ueberlandstr. 129, 8600 Dübendorf, Switzerland
coelasticity changes in real time by periodically interrupt-ing the quartz excitation and measurinterrupt-ing the resonance fre-quency (f), the transient decay time constant (τ), and the maximal oscillation amplitude (A0) [37].
Here we report that the resonance frequency decreased during 60–80 min of cell attachment to the QCM surface. Thereafter, positive frequency shifts were measured. The maximal amplitude A0 and the transient decay time
con-stantτindicated that cell desorption did not occur during this phase and this was independently confirmed by light microscopy. The readout of f, A0, and τ indicated an
in-creased rigidification of cells during the spreading pro-cess, and this was verified by changing cell viscosity us-ing microtubule- and actin-directed drugs.
Materials and methods Cells
TC7 African Green Monkey kidney epithelial cells and HeLa cells (American Type Culture Collection) were grown on plastic dishes in a humidified 5% CO2air atmosphere at 37 °C in Dulbecco’s Modified Eagle’s Medium (DMEM) (Gibco) containing 10% Fetal Calf Serum (FCS) (Hyclone) and 2 mM L-glutamine as described earlier [38]. A549 (lung carcinoma) cells were grown in similar conditions in DMEM (Gibco) containing 7% Clone III (Hyclone) and 2 mM glutamine. Near confluency cells were detached from the substrate by short treatment with trypsin (0.5 mg mL–1) at 37 °C and immediately resuspended in RPMI medium (Gibco) supple-mented with 20 mM Hepes and 10% FBS (TC7 and HeLa) or 7% Clone III (A549), 2 mM glutamine, 1% nonessential amino acids, 100 U mL–1penicillin/0.1 mg mL–1 streptomycin. The cells were then immediately transferred to the QCM.
Drugs
Different drugs were used to disturb the polymerization state of actin filaments and microtubules of spread out cells on the quartz crystal. The drugs were dissolved in dimethylsulfoxide (DMSO) and diluted in the media lacking cells at 1:1000. Jasplakinolide (Jas) (a gift from Phil Crews, Santa Cruz, California) induces actin polymerization and competes with phalloidin for actin binding [39, 40, 41]. It was used at a concentration of 500 nM [42]. Latrunculin B (LatB) (Calbiochem, Juro Supply), which was used at a concen-tration of 1µM, forms 1:1 complexes with actin monomers and in-hibits actin polymerization [43, 44]. Cytochalasin D (CD) (Cal-biochem, Juro Supply) binds to the faster-growing end of actin [45] and disrupts the filaments [46]. The concentration of CD was 2µM. Microtubule polymerization was induced by Paclitaxel (Taxol) (Sigma) 2µM [47] and microtubule depolymerization was induced by Nocodazole (Noc) (Sigma) 20µM.
and viscosityηl(Kanazawa’s equation) [29]:
1 f = − f3/2 0
s ρlnl
πµqρq
where f0is the unloaded resonance frequency,µqthe shear modu-lus, andρqthe density of the quartz crystal. Furthermore, effects due to viscoelasticity of the adsorbed mass may occur, for exam-ple, during cell spreading. It is therefore essential to measure addi-tional parameters, such as the maximal oscillation amplitude A0 and the transient decay time constant τ. The maximal oscillation amplitude is the quartz amplitude that is reached after a 3-ms exci-tation with an oscillation frequency at the quartz resonance fre-quency. It reflects energy losses arising during excitation of the quartz crystal. It decreases with an increase of the viscosity–elas-ticity ratio of the adsorbed mass. The decay time constantτ, which corresponds to the ratio of mass over the energy losses, decreases with a more viscous adlayer. Finally a frequency decrease corre-sponds either to an increase of adsorbed mass in the case of a thin and rigid adlayer, and/or to a softening of the adlayer, since it has been shown that the sensitivity in frequency increases for softer adlayers [48]. The QCM used here including the measured param-eters, the physical properties, and the equivalent circuit model have been described in more detail elsewhere [37]. Briefly, under water loading a resolution of f±2 Hz, A0±50 a.u. (arbitrary units), and τ±1.4×10⁻⁶s is obtained with 10-MHz crystals at 25±0.1 °C. Under vacuum the resolution is much better with f±0.03 Hz, A0±3 a.u., andτ±1.5×10⁻⁸s. Using the Sauerbrey relation, this corresponds to changes in surface mass density of m±9 ng cm–2 in liquid and
m±0.135 ng cm–2under vacuum.
Before each experiment the crystals were sterilized with ethanol and passed briefly over a flame. Experiments were per-formed at a constant temperature of 37±0.1 °C in order to obtain long-term stability and reproducibility of results. Moreover each solution was adjusted to 37 °C before introduction to the liquid cell to avoid changes in liquid density and viscosity. Before drug addi-tion, the quartz surface was rinsed with a mixture of RPMI+x% DMSO, where x represents the drug dilution factor.
The evaporated Au electrodes were smooth. The small one had a diameter of 5 mm and the other one was in contact with liquid and covered completely the quartz surface [49]. The quartz crystal was entrapped between two plexiglas pieces sealed with VITON O-rings with inner diameter of 8 mm. The volume of the reaction chamber with the quartz crystal was 80µL. Solutions were injected with a sy-ringe via a closed tubing system, which prevented evaporation. The injection process lasted less than 5 s, and after injection no flow was maintained in the reaction chamber. Considering that the sensitive area corresponded to the smaller electrode, 3.12% of the total given
cell concentration attached and spread out in this region.
Results and discussion
Cell attachment and spreading
We first studied the attachment of cultured human lung epithelial A549 cells to the Au electrode of QCM. The
thickness sensitivity of our QCM under water loading at 37 °C was about 180 nm above the electrode surface [27]. All observed frequency variations were much smaller than the frequency shifts measured between the quartz ex-posed to air and solution, which was about 2 kHz. Before each experiment the quartz was equilibrated with growth medium lacking cells. Freshly trypsinized cells were in-jected onto the QCM in growth medium. Since the solu-tions had similar viscosities, frequency shifts were as-signed to the response of cells attached on the crystal.
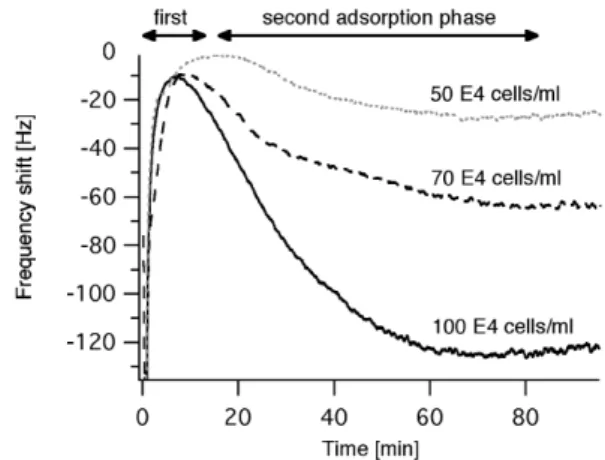
Figure 1 represents the frequency shifts measured dur-ing the attachment and spreaddur-ing of A549 cells up to 80 min after injection. The frequency decreased dramatically dur-ing the first 40 s reachdur-ing levels between –187 Hz and –284 Hz. We attributed the first frequency changes to the injection process, that is, to the pressure difference during injection (see also Fig. 4, and ref. [37]). During the next 10–16 min, pressure on the quartz surface progressively decreased and accordingly, the frequency increased to lev-els between ∆f=–2 Hz and ∆f=–10 Hz (Fig. 1). Similar
ob-servations occur with protein adsorption, where the subse-quent equilibration time is, however, much shorter (less than 1 min) [50]. It is not clear whether the quartz re-sponse in this first phase contained other signatures than that of the injection induced disturbance and the onset of cell adsorption. In the subsequent so-called second ad-sorption phase, the resonance frequency decreased. This was assigned to cells adhering to the solid substratum, as concluded from independent experiments performed on glass coverslips mounted on an inverted microscope equipped with phase contrast optics (data not shown). The maximal frequency shifts were roughly proportional to the cell concentration and typically lasted until about 80 min post-injection. Similar results have been obtained with other cell lines [30, 51]. At the end of the second adsorp-tion phase, A549 cells induced larger frequency shifts at higher concentrations (∆f2=–64 Hz with 70×104cells mL–1
compared to ∆f2=–33 Hz with 30×104HeLa cells mL–1;
see Fig. 2). The duration of the second adsorption phase was also cell type dependent, lasting 80 min for A549 and 50 min for HeLa and TC7 cells.
Surprisingly, we found that the frequency steadily in-creased afterwards (Fig. 2). This was observed with three different cell lines, the human epithelial HeLa and A549 cells and the African Green Monkey epithelial cells TC7. In all cases, the frequency passed the initial frequency measured before cell injection and at the beginning of the second adsorption phase. The magnitude and the kinetics of frequency shifts were concentration and cell type de-pendent, as similar frequency shifts were measured with HeLa and TC7 cells, albeit at different cell concentrations (30×104cells mL–1and 10.2×10⁴cells mL–1, respectively).
Positive frequency shifts ∆ffinal=+14 Hz were measured
af-ter 378 min for HeLa and TC7 and ∆ffinal=+43 Hz after
896 min for A549 cells. Similar frequency increases had previously been measured with neutrophils deposited on HSA-coated polystyrene [35] and with various cultured cells, but the nature of the increase is unknown [30, 51]. From our measurements it appeared that ∆ffinalwas roughly
proportional to ∆f2 (i.e., the number of adhered cells).
Rinsing of the surface with growth medium at 175 min (see arrow in Fig. 2) did not disturb the frequency in-crease. Likewise, stopping the quartz excitation for sev-eral hours had no effect on the rate of frequency shift, in-dicating that the quartz oscillation per se was not respon-sible for the increase of frequency (data not shown).
To test whether cell desorption occurred during the fre-quency upshift we analyzed the QCM surface by light mi-croscopy (see Fig. 3). Inspection by phase contrast micros-copy indicated that 50% of the quartz surface was covered with A549 cells at 896 min post-injection (Fig. 3A). Fluo-rescence microscopy of HeLa or TC7 cells on the quartz electrode at 378 min or 429 min post injection identified actin filaments including focal contacts (arrows in Fig. 3B and C) at the cell periphery and across the cytoplasm in-dicative of cell spreading. In these cases the surface cov-erage was about 70% for HeLa and 60% for TC7 cells. It Fig 1 Adsorption of A549 cells at different concentrations. Larger
frequency shifts were measured at larger cell concentrations
Fig. 2 Attachment and spreading of different cells at different concentrations. For long times (t>400 min) the frequency saturates above the frequency before cell injection. This frequency shift is observed for all investigated cell lines and is roughly proportional to the frequency shift at the end of the adsorption phase. After 180 min, the QCM surface containing A549 was rinsed (arrow) and the frequency continued to increase, indicating that the fre-quency increase was independent of media components that may be released during the adsorption phases
is known that during adsorption, adherent cells establish tight focal contacts linking the actin cytoskeleton through receptors to the substratum [52]. The rest of the ventral cell surface is often distantly located from the substratum [53]. It is thus likely that only a fraction of the adsorbed cell mass is detected with the QCM measurements. How-ever, since the frequency shifts depended not only on the
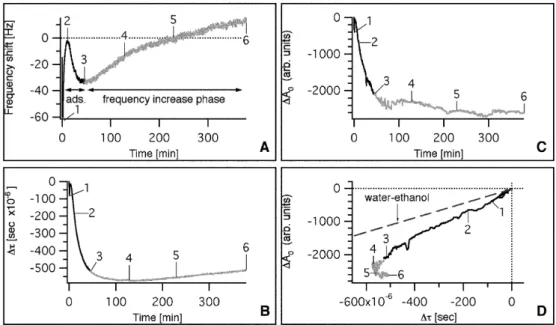
To investigate the underlying nature of the frequency up-shifts after cell adsorption we have also measured the de-cay time constant τ and the maximum oscillation ampli-tude A0;τand A0relate the stiffness of the adsorbed mass
to energy losses [37]. A decrease ofτcorresponds to a de-crease of mass density and/or an inde-crease of viscosity and a decrease of amplitude is induced by an increase of the viscosity–elasticity ratio of the adlayer as suggested ear-lier [37]. Kanazawa’s equation indicates that frequency shifts can occur by modifying the liquid properties, such as the viscosity and density, in the absence of cell desorp-tion [29]. In our experiments, the properties of the extra-cellular fluids remained largely constant during and after the introduction of the cells and we assumed that the ex-tracellular matrix properties did not change drastically during our observations. Upon cell injectionτand A0
de-creased drastically from A0≈6,000 a.u. andτ≈3,000×10–6s
during the first and second initial “adsorption phases” (Fig. 4). This corresponded to an increase of dissipated energy per adsorbed mass and to energy loss. Energy loss can, for example, arise due to slipping of cells over the surface. Accordingly, the formation of the focal points linking the cells to the substratum is a highly dynamic pro-cess [54]. In addition the cytoplasm may not act as a stan-dard solution in contact with the electrode surface because it is limited by the plasma membrane with dynamic bio-physical and mechanical properties. During the “fre-quency increase phase” after about 60 min (brighter color in Fig. 4) the maximal amplitude decreased gently and stabilized at ∆A0=–2,590 a.u. at about 200 min. In contrast,
the decay time constant presented a minimum at 140 min post-injection and then slightly increased to –510×10–6s
at 378 min, similar to the value at the end of the second adsorption phase.
We then plotted ∆A0as a function of ∆τand compared
the data to mixtures of ethanol and water (Fig. 4D). The water–ethanol line represents changes in amplitude and decay time constant due to modifications of solution prop-erties. In this case both parameters are inversely propor-tional to the product of the liquid viscosity and density [37]. Clearly, the ratio of ∆A0/∆τfor HeLa cells was not
constant, unlike the water–ethanol line. A similar behav-ior was observed with TC7 and A549 (see Fig. 5). Since all the ∆A0versus ∆τplots were below the water–ethanol
line, energy dissipation by adsorbed cells was measured. During the first 50–80 min after introduction of the cell suspension to the QCM, ∆A0was a linear function of ∆τ
Fig 3A–C Microscopy analyses of the quartz surface after cell spreading when positive frequency shifts were measured. For each cell type the surface was covered with living cells indicating that no cell desorption during frequency upshifts were monitored: A phase contrast measurement directly above the QCM surface covered with spread out A549 cells seeded at 70×104cells mL–1, 896 min post-injection. B Phalloidin-FITC staining HeLa actin filaments (30×104cells mL–1), 378 min post-injection. Arrows point on actin complexes, suggestive of focal complexes or focal con-tacts linking the actin cytoskeleton to the extracellular substra-tum [52]. C Phalloidin-TR staining of TC7 (10.2×10⁴cells mL–1), 429 min post-injection
and the curve nearly followed the water–ethanol line. The slope remained constant, independent of the cell type and the concentration in the range of 50–100×104cells mL–1
(data not shown). Similar to ∆τ, ∆A0decreased during the
first 40 s due to the injection process and increased there-after following a similar slope. After this, ∆A0and ∆τ
de-creased linearly for all cell types following the same slope as during the first 40 s. Nevertheless, the slopes were dif-ferent for each cell type, that is, the largest slope was found with A549 and the smallest one with TC7 cells. Since A0decreases with an increase of energy loss, andτ
decreases with a decrease of the ratio of adsorbed mass over energy loss, the A549 cells dissipated less energy per adsorbed mass than HeLa, which dissipated less energy than TC7 cells. Most likely the A549 cells were the stiffest cells followed by the HeLa and the TC7 cells. In accor-dance with this interpretation, the frequency kinetics were similar for HeLa and TC7 cells, albeit the concentration
and surface coverage of TC7 cells were smaller than those of HeLa cells (Fig. 2). This was most likely due to the de-creased QCM sensitivity in frequency with inde-creased stiffness of adsorbed material [48].
During the phase of frequency increase after about 80 min (brighter color in Fig. 5) the behavior of the ∆A0versus ∆τ
curves was no longer linear. In the case of HeLa and TC7 cells, τ reached a minimal value and slightly increased thereafter. In this last phase A0 remained constant. This
phenomenon was particularly obvious when the quartz sur-face was rinsed (in the case of A459 cells). Then A0
re-mained constant andτincreased (turning point, dashed ar-row in Fig. 5), which suggested stiffening of the attached cells.
In summary the decrease of frequency in the second adsorption phase correlated with the attachment of cells. During this phase, the maximum oscillation amplitude de-creased linearly as a function of the decay time constant. Thereafter the frequency increased mainly due to stiffen-ing of the attached cells.
Effects of cytoskeleton targeted drugs on f,τ, and A0
During cell attachment and spreading focal contacts are developed, and filamentous actin is established in the cell cortex [53, 55]. In addition, actin and microtubule fila-ments are present in the cell periphery and across the cy-toplasm yielding a cell-type-specific shape. The third type of cytoskeletal element, the intermediate filaments, are thought to be passively regulated subsequent to changes of the actin and microtubule filaments. To test if the vari-ations of f,τ, and A0were due to cell alterations of the
cy-toskeleton inducing viscosity changes, we treated the at-tached cells with actin and microtubule inhibitors. As in-dicated by confocal laser scanning microscopy of chemi-cally fixed A549 cells, the F-actin stabilizing drug jas-plakinolide (Jas) prevented F-actin staining with the inter-calating drug phalloidin indicative of F-actin stabilization Fig 4A–D Frequency (A)
(data taken from Fig. 2 for comparison), decay time con-stant (B) and amplitude (C) ki-netics during HeLa attachment and spreading. D Maximal os-cillation amplitude shift versus decay time constant shift in-cluding the water–ethanol line. The “frequency increase phase” is represented with a brighter color and reference time points are indicated by numbers (1–6)
Fig 5 Maximal amplitude shift versus decay time constant shift during attachment of TC7 (10.2×10⁴cells mL–1), HeLa (30×104 cells mL–1, Fig. 4) and A549 cells (70×104cells mL–1) with wa-ter–ethanol curve as a reference. The “frequency increase phase” is represented with a brighter color for each cell type
[39] (Fig. 6). The F-actin depolymerizing drugs cytocha-lasin D (CD) [46] and latrunculin B (LatB) led to F-actin fragmentation and cell contraction [44] (Fig. 6). The treat-ment of cells with the microtubule stabilizing drug pacli-taxel (Taxol) resulted in microtubule aggregation [47], and nocodazole (Noc) promoted the depolymerization of microtubules, as expected [56]. Observation of drug effect on cytoskeleton was limited to 30 min, since their action at larger timescale and at high concentration is not well known.
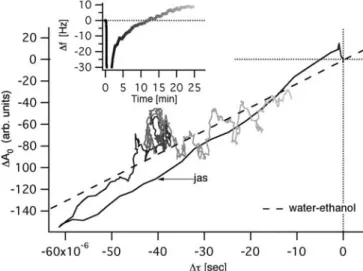
We recorded the changes of f, A0, and τ for attached
A549 cells treated with Jas. Figure 7 presents a complete experiment including the two first “adsorption phases” and the “frequency increase phase”. Before the introduction of Jas at 208 min, the quartz surface was rinsed with growth medium containing a similar concentration of the solvent dimethylsulfoxide (DMSO). This induced a small fre-quency decrease due to altered liquid properties. Impor-tantly, however, DMSO-containing medium had a similar viscosity as the drug-containing medium. The addition of Jas induced a rapid frequency increase compared to non-treated cells or cells non-treated with medium+DMSO alone (see Fig. 7). At 25 min after the application of Jas, the ∆f
was at +9 Hz (Fig. 8, inset). Parallel experiments per-formed on coverslips showed no signs of cell desorption after 30 min of Jas treatment (Fig. 6B,b). We next plotted ∆A0versus ∆τfor Jas-treated cells (Fig. 8). During the first
40 s the maximal amplitude A0and the decay time constant
τdecreased and thereafter increased, similar to what was measured after the introduction of the cell suspension to neat quartz in the absence of drugs. Cells were probably slightly disturbed by the solution exchange process.
During the next 15 min, the maximal amplitude and the decay time constant remained constant under Jas
treat-ment, ∆A0=–70 a.u. and ∆τ=–40×10–6s. It has been shown
that for viscoelastic systems, such as cells, an increase of viscosity and viscosity–elasticity ratio can induce an in-crease of frequency [48]. The cell viscosity–elasticity ra-Fig 6Aa–Ff Confocal images of A549 cells treated with actin and
microtubule inhibitors on glass coverslips stained for filamentous actin with phalloidin-FITC (top) and for microtubules using spe-cific antibodies (bottom). The cytoskeleton of untreated A549 cells (A and a) was disturbed with Jas (B and b), CD (C and c), LatB (D and d), Taxol (E and e), or Noc (F and f). The scale in f is the same for all images. Projections of the confocal sections across the entire cells are shown
Fig 7 Frequency changes of attached A549 cells treated with Jas. The QCM surface was first rinsed with medium+DMSO, and then with medium plus Jas in DMSO (arrows)
Fig 8 Increase of filamentous actin of Jas-treated A549 cells cor-relates with positive frequency shifts and ∆A0versus ∆τcurve is indicative of cell stiffening. Inset∆f versus time upon Jas addition at 0 min
tio had therefore to increase, inducing a positive fre-quency shift ∆f=+4 Hz. Thereafter, the frequency
contin-ued to increase to about ∆f=+9 Hz. Similarly ∆τincreased to about –10×10–6s and ∆A
0versus ∆τslightly increased
following the water–ethanol line. This phase indicated a stiffening of the cells that is consistent with the known cell biological action of Jas, which increases the F-actin stability and lowers the turnover of monomers [41].
We next treated the A549 cells attached to the QCM surface with the actin-depolymerizing drugs CD or LatB. The effects of CD and LatB on A0 and τwere different
from those observed with Jas. The decay time constant and the maximal amplitude increased to about ∆τ=+150× 10–6s and ∆A
0=+400 a.u. in 25 min, indicative of a
viscos-ity decrease or cell desorption. The latter was confirmed by confocal light microscopy indicating that CD led to cell retractions due to the loss of filamentous actin (Fig. 6C, c). This suggested that QCM detected mainly cell detach-ment rather than viscosity/elasticity changes upon actin depolymerization, consistent with direct viscosity mea-surements [57, 58, 59]. Accordingly, the frequency in-creased by ∆f=+11 Hz upon CD treatment (inset Fig. 9).
Similar results have been obtained by others with Ma-dine–Darby–Canine Kidney cells, using a steady state technique, measuring a decrease of resistance and induc-tance corresponding to a decrease of energy loss and mass desorption [32]. In contrast to CD-treated cells, the fre-quency decreased continuously under LatB treatment, reaching∆f=–32 Hz after 25 min (inset Fig. 9), in
compar-ison to ∆f2=–23 Hz at the end of the second adsorption
phase. Parallel experiments showed no signs of cell des-orption (Fig. 6D, d). Therefore, the cell stiffness decreased under LatB treatment, increasing the quartz sensitivity in frequency.
We next treated attached A549 cells with Taxol and Noc. Taxol promotes microtubule stabilization by binding to the taxane binding site on beta tubulin [60], and Noc
leads to microtubule depolymerization due to inhibition of tubulin incorporation [61]. As indicated in Fig. 10, Taxol induced no additional change in frequency (∆f=–2 Hz) in
comparison to the maximal frequency shift ∆f2=–30 Hz at
the end of the second adsorption phase. The ∆A0 versus
∆τcurves in Fig. 10 did not follow the water–ethanol line but remained below it, corresponding to mass adsorption with modification of the viscoelastic properties of the at-tached cells. The small ∆A0=–40 a.u. and ∆τ=–8×10⁻⁶s
decreases corresponded to an insignificant increase of the cell viscosity, which was in accordance to measurements performed by others [57]. Parallel experiments showed no significant changes of the actin state, but microtubules were aggregated and the cell area seen in projection ap-peared to be increased (Fig. 6E, e). Therefore the small decrease of frequency might be due to increased cell spread-ing.
Depolymerization of microtubules was achieved by Noc treatment. After the successive decrease and increase of the maximal amplitude and of the decay time constant during the first 6 min (see Fig. 10), ∆τremained constant at –18×10–6s and the maximal amplitude shift decreased
from –80 a.u. to –210 a.u. in 30 min. During this period the frequency remained constant at ∆f=–14 Hz and the
parallel microscopy measurements showed that cell spread-ing somewhat increased in the presence of Noc (Fig. 6F, f), similar to Taxol. Therefore cell spreading and stiffness decrease of the attached cells most likely contributed to the frequency decrease. This in turn increased the sensi-tivity of frequency measurements. These results were con-sistent with an earlier report showing that Noc decreased the cell viscosity [57]. Another study also measured an initial decrease of frequency, which then increased during attachment and spreading [30], similar to our results. This study measured a frequency decrease upon treating at-tached endothelial cells with Noc. However the results Fig 9 Depolymerization of actin filaments of A549 cells with CD
and LatB drugs. Inset frequency shift versus time under CD and LatB treatment
Fig 10 Polymerization of microtubules with Taxol and depoly-merization with Noc. Inset frequency shift versus time under Taxol and Noc treatment
key prerequisite to determine viscoelastic properties of the interface between the cells and the substratum is to si-multaneously determine complementary parameters such as the frequency f, the maximal oscillation amplitude A0,
and the decay time constantτ. Our results show that the frequency measured during the initial 15 min of cell at-tachment reflects effects of the cell injection process. The effects are unspecific and largely due to pressure differ-ences due to injection. During the second adsorption phase up to 80 min post-injection, the frequency decreased mainly due to cell attachment and spreading, firmly at-taching to the QCM surface. After 80 min, the frequency increased for several hours and even passed the initial value, so that positive frequency shifts were measured. Optical measurements confirmed that the surface of the quartz crystal was covered with cells and that no obvious cell desorption occurred during this phase. ∆A0 and ∆τ
measurements indicated that the frequency increase was mainly due to increased cell stiffness, which in turn af-fected the sensitivity of the frequency measurement. This was confirmed by treating the attached cells with agents affecting the polymerization state of actin and micro-tubule filaments. Positive frequency shifts were measured when the stiffness of the attached cells increased and/or when cell desorption occurred. Negative frequency shifts arose when cells became softer and/or the projection area of attached cells increased. It is, however, possible that additional factors influence the quartz response. For ex-ample, the contacts between the quartz electrode and the ventral side of the cells are not continuous but separated by cavities filled with extracellular medium. It is currently unknown if the QCM responds to local changes of the ex-tracellular medium present in these cavities. To the best of our knowledge, no theoretical models have been devel-oped for such nonhomogeneous cases. Nevertheless, it is obvious that any modification of the liquid between the cell and the solid surface likely contributes to the quartz response. The penetration depth of the damped wave cou-pled to the quartz can be influenced by the viscosity, stiff-ness, and shape of attached cells, which in turn affects the QCM frequency. Further experiments with systems pre-senting phase transitions have to address the influence of these different parameters.
Acknowledgments We gratefully acknowledge Laurent Spicher and Francis Bourqui for their work in the building of the QCM. We also thank Bianca Saam and Karin Boucke for the cell culture and Dr Robert Stidwill for the confocal images. This work was
171
7. PouratiJ, Maniotis A, Spiegel D, Schaffer JL, Butler JP, Fred-berg JJ, Ingber DE, Stamenovic D, Wang N (1998) Am J Phys-iol 274:C1283–C1289
8. Allen RD (1985) Ann Rev Biophys Biophys Chem 14:265 9. Chamberlain C, Hahn KM (2000) Traffic 1(10):755–762 10. Wang N, Tolic-Norrelykke IM, Chen J, Mijailovich SM,
But-ler JP, Fredberg JJ, Stamenovic D (2002) Am J Physiol Cell Physiol 282(3):C606–C616
11. Puig-De-Morales M, Grabulosa M, Alcaraz J, Mullol J, Maksym GN, Fredberg JJ, Navajas D (2001) J Appl Physiol 91(3):1152–1159
12. Berrios JC, Schroeder MA, Hubmayr RD (2001) J Appl Phys-iol 91(1):65–73
13. Wang Q, Chiang ET, Lim M, Lai J, Rogers R, Janmey PA, Shwpro D, Doerschuk CM (2001) Blood 97(3):660–668 14. Bausch AR, Hellerer U, Essler M, Aepfelbacher M, Sackmann
E (2001) Biophys J 80(6):2649–2657
15. Bausch AR, Ziemann F, Boulbitch AA, Jacobson K, Sackmann E (1998) Biophys J 75:2038–2049
16. Ziemann F, Rädler J, Sackmann E (1994) Biophys J 66:2210– 2216
17. Kolega J (1986) J Cell Biol 102:1400–1411
18. Hochmuth RM, Waugh RE (1987) Annu Rev Physiol 49:209– 219
19. Evans E, Yeung A (1989) Biophys J 56:151–160 20. Evans E, Berk D, Leung A (1991) Biophys J 59:838–848 21. Sung KLP, Kwan MK, Maldonado F, Akeson WH (1994)
J Biomech Eng 116:237–242
22. Petermon NO, McConnaughey WB, Elson EL (1982) Proc Natl Acad Sci USA 79:5327–5331
23. Pastermank C, Wong S, Elson EL (1995) C Cell Biol 128: 355–361
24. Janshoff A, Galla H-J, Steinem C (2000) Angew Chem Int Ed 39:4004–4032
25. Jones JL, Meiure JP (1969) Anal Chem 41:484 26. Meiure JP, Jones JL (1969) Talanta 16:149–150 27. Sauerbrey G (1959) Z Phys 155:206–222
28. Nomura T, Iijima M (1981) Anal Chim Acta 131:97–102 29. Kanazawa KK, Gordon JG (1985) Anal Chem 57:1770–1771 30. Marx KA, Zhou T, Montrone A, Schulze H, Braunhut SJ
(2001) Biosens Bioelectron 16:773–782
31. Zhou T, Marx KA, Warren M, Schulze H, Braunhut SJ (2000) Biotechnol Prog 16:268–277
32. Wegener J, Seebach J, Janshoff A, Galla H-J (2000) Biophys J 78:821–2833
33. Janshoff A, Wegener J, Sieber M, Galla H-J (1996) Eur Bio-phys J 25:93–103
34. Otto K, Elwing H, Hermansson M (1999) J Bacteriol 181(17): 5210–5218
35. Nimeri G, Fredriksson C, Elwing H, Liu L, Rodahl M, Kasemo B (1998) Coll Surf B Biointerfaces 11:255–264
36. Fredriksson C, Khilman S, Kasemo B (1998) J Mater Sci Mater Med 9:785–788
37. Galli Marxer C, Collaud Coen M, Bissig H, Greber UF, Schlapbach L (2003) Anal Bioanal Chem (in press) DOI 10.1007/s00216-003-2081-0
38. Suomalainen M, Nakano MY, Keller S, Boucke K, Stidwill RP, Greber UF (1999) J Cell Biol 144:657–672
39. Holzinger A (2001) Methods Mol Biol 161:109–120
40. Bubb MR, Spector I, Beyer BB, Fosen KM (2000) J Biol Chem 275:5163–5170
41. Bubb MR, Senderwicz AM, Sausville EA, Duncan KL, Korn ED (1994) J Biol Chem 269:14869–14871
42. Nakano MY, Boucke K, Suomalainen M, Stidwill RP, Greber UF (2000) J Virol 74(15):7085–7095
43. Coue M, Brenner SL, Spector I, Korn ED (1987) FEBS Lett 213:316–318
44. Spector I, Shochet NR, Blasberger D, Kashman Y (1989) Cell Motil Cytoskel 13:127–144
45. Urbanik E, Ware BR (1989) Arch Biochem Biophys 269:181– 187
46. Cooper JA (1987) J Cell Biol 105:1473–1478
47. Schiff PB, Fant J, Horwitz SB (1979) Nature 277:665–667 48. Kanazawa KK (1997) Faraday Discuss 107:77–90
49. Rodahl M, Höök F, Kasemo B (1996) Anal Chem 68:2219– 2227
50. Galli Marxer C, Collaud Coen M, Schlapbach L (2003) J Col-loid Interface Sci 261(2):291–298
51. Wegener J, Janshoff A, Galla H-J (1998) Eur Biophys J 28: 26–37
52. Geiger B, Bershadsky A (2001) Curr Opin Cell Biol 13(5): 584–592
53. Burridge K, Fath K, Kelly T, Nuckolls G, Turner C (1988) Annu Rev Cell Biol 4:487–525
54. Petit V, Thiery JP (2000) Biol Cell 92:477–494
55. Bereiter-Hahn J, Luck M, Miebach T, Stelzer HK, Voth M (1990) J Cell Sci 96(1):171–188
56. Hoebeke J, Van Nijen G, DeBrabender M (1976) Biochem Biophys Res Commun 69:319–324
57. Wang N (1998) Hypertension 32:162–165
58. Thoumine O, Cardoso O, Meister J-J (1999) Eur Biophys J 28:222–234
59. Wakatsuki T, Schwab B, Thompson NC, Elson EL (2001) J Cell Sci 114(5):1025–1036
60. Nogales E, Wolf SG, Downing KH (1998) Nature 391:199– 203
61. Wilson L, Jordan MA (1994) Microtubules. Hyams and Lloyd, Wiley-Liss, pp 59–83