ORIGINAL PAPER
Clinical presentation of celiac disease and the diagnostic
accuracy of serologic markers in children
Eberhard Lurz&Ursina Scheidegger&
Johannes Spalinger&Martin Schöni&Susanne Schibli
Received: 5 April 2008 / Accepted: 22 September 2008 / Published online: 16 October 2008 # Springer-Verlag 2008
Abstract There has been growing recognition of a changing clinical presentation of celiac disease (CD), with the manifestation of milder symptoms. Serologic testing is widely used to screen patients with suspected CD and populations at risk. The aim of this retrospective analysis was to evaluate the clinical presentation of CD in childhood, assess the diagnostic value of serologic tests, and investigate the impact of IgA deficiency on diagnostic accuracy. We evaluated 206 consecutive children with suspected CD on the basis of clinical symptoms and positive serology results. Ninety-four (46%) had biopsy-proven CD. The median age at diagnosis of CD was 6.8 years; 15% of the children were <2 years of age. There was a higher incidence of CD in girls (p=0.003). Iron deficiency and intestinal complaints were more frequent in children with CD than those without CD (61% vs. 33%, p=0.0001 and 71% vs. 55%, p=0.02, respectively), while failure to thrive was less common (35% vs. 53%, p=0.02). The sensitivity of IgA tissue transglutaminase (IgA-tTG) was 0.98 when including all children and 1.00 after excluding children with selective IgA deficiency. The specificity of IgA-tTG was 0.73 using the recommended cut-off value of 20 IU, and this improved to 0.94 when using a higher cut-off value of 100 IU. All
children with CD and relative IgA deficiency (IgA levels that are measurable but below the age reference [n=8]) had elevated IgA-tTG. In conclusion, CD is frequently diagnosed in school-age children with relatively mild symptoms. The absence of intestinal symptoms does not preclude the diagnosis of CD; many children with CD do not report intestinal symptoms. While the sensitivity of IgA-tTG is excellent, its specificity is insufficient for the diagnostic confirmation of a disease requiring life-long dietary restric-tions. Children with negative IgA-tTG and decreased but measurable IgA values are unlikely to have CD.
Keywords Celiac disease . Clinical presentation . Screening . IgA deficiency . Tissue transglutaminase (tTG)
Abbreviations
tTG Tissue transglutaminase AGA Antigliadin antibodies EMA Endomysium antibodies CD Celiac disease
T1DM Type 1 diabetes mellitus FTT Failure to thrive
Introduction
Celiac disease (CD) is an immune-mediated enteropathy triggered by the ingestion of gluten, which affects geneti-cally predisposed individuals [6,14]. It is one of the most common life-long disorders, with an estimated prevalence ranging from 3 to 13 per 1,000 children in the general population in Europe and North America [14,15,19,28]. A recent study in asymptomatic adolescents in eastern Switzer-land revealed a prevalence rate of 1 in 230 adolescents [25].
E. Lurz
:
U. Scheidegger:
J. Spalinger:
M. Schöni:
S. Schibli University Children’s Hospital Berne,Bern, Switzerland J. Spalinger
Children’s Hospital Lucerne, Lucerne, Switzerland S. Schibli (*)
Paediatric Gastroenterology and Hepatology, University Children’s Hospital Berne, 3010 Bern, Switzerland
There is strong evidence for a higher occurrence of CD in children with type 1 diabetes mellitus (T1DM), autoimmune thyroid disease, selective IgA deficiency, Down’ syndrome, Turner syndrome, and first-degree relatives of patients with CD [1, 14, 21]. The clinical presentation of CD is very variable, ranging from the typical syndrome of intestinal malabsorption starting between the age of 6 and 24 months to atypical symptoms of other organ systems [10, 14]. Classic symptoms include impaired growth, chronic diar-rhea, abdominal distention, muscle wasting, hypotonia, poor appetite, and unhappy behavior.
More recently, a trend towards less symptomatic mani-festations of CD has been observed. Atypical symptoms include unusual intestinal complaints, such as recurrent abdominal pain, vomiting, bloating, and constipation, as well as extraintestinal manifestations, such as short stature, pubertal delay, iron deficiency, and abnormal liver function tests [12–14,23,26]. Thus, serologic screening is essential in the diagnostic approach of this variable disease. IgA endomysium antibodies (IgA-EMA) and, more recently, IgA antibodies against tissue transglutaminase (IgA-tTG) offer better sensitivity and specificity than IgA and IgG antigliadin (AGA) antibodies [24]. IgA-tTG is recommended for initial testing for CD by the North American Society for Pediatric Gastroenterology, Hepatology and Nutrition (NASPGHAN) [14], because the tTG enzyme-linked immunosorbent assay (ELISA) test is less interobserver-dependent and less laborious than the EMA immunofluorescence test. It is generally accepted that a small-bowel biopsy is required for diagnostic confirmation [14, 30]. However, due to the invasiveness of the endoscopic procedure, there is growing interest in developing diagnostic rules which are sufficiently reliable to diagnose CD without the need for biopsies, at least in subsets of patients. In this regard, Barker et al. [3] and Diamanti et al. [11] have suggested that markedly elevated IgA-tTG are highly specific and, therefore, small-bowel biopsies may not be necessary in patients with markedly elevated IgA-tTG values.
We conducted a retrospective analysis of all children undergoing an upper endoscopy for suspected CD at the Children’s Hospitals in Berne and Lucerne to examine the clinical presentation of CD in central Switzerland. We also evaluated the diagnostic value of serologic markers consid-ering different cut-off values and assessed the impact of selective IgA deficiency on the diagnostic accuracy.
Methods Study design
We performed a retrospective analysis of all children (<16 years of age) who underwent upper endoscopy and
small-bowel biopsies for suspected CD between January 2001 and August 2006 at the Children’s Hospitals of Berne and Lucerne (serving approximately 1.5 million inhab-itants). For patient identification, endoscopy reports were retrieved from a computerized database, which prospec-tively recorded all children undergoing an upper endoscopy. Database records were checked against filed paper records of endoscopy reports for completeness. Chart reviews were performed when there was any note of suspected CD in the endoscopy reports. Patients were included when serologic testing was performed because of the presence of sugges-tive symptoms or to screen patients with conditions associated with an increased risk for CD or first-degree relatives. Patients were excluded from the study when gluten had not been introduced for at least one month prior to serologic testing. The study was approved by the Institutional Human Ethics Review Boards.
Using a standardized form, charts were reviewed for signs and symptoms of CD, first-degree relatives with CD, conditions associated with CD, as well as the results of serologic markers and histology reports. All patients were assessed for intestinal manifestations, including abdominal pain, diarrhea, constipation, flatulence, weight loss, and failure to thrive (FTT), and the extraintestinal symptoms, short stature, anemia and microcytosis, or hypochromasia as surrogates for latent iron deficiency. Extraintestinal manifestations without strong evidence for an association with CD (e.g., epilepsy with occipital calcifications) [14] or rare occurrence in childhood (e.g., dermatitis herpetiformis) were not included in our assessment. T1DM, thyroid disease, Addison disease, Turner syndrome, Down syn-drome, and juvenile arthritis were considered as conditions with an increased risk for CD.
Serologic tests and total IgA
Serologic testing (IgA-tTG, IgA-EMA, IgA-AGA, and IgG-AGA) and total IgA levels were performed in different laboratories using various assays during the study period. IgA-tTG was measured by human recombinant or purified erythrocytes assays, manufactured by INOVA Diagnostics Inc. (San Diego, USA), Pharmacia Diagnostics GmbH (Freiburg, Germany), Phadia Diagnostics GmbH (Freiburg, Germany), and Vita-Diagnostika GmbH (Merzhausen, Germany). The results from each serologic marker were classified as either normal or elevated using the respective cut-off level for each test and assay. As suggested by Barker et al. [3], we considered IgA-tTG values >100 IU as markedly elevated for human recombinant or purified erythrocyte IgA-tTG tests. IgA levels within or above the normal range for age were classified as normal, IgA levels <0.05 g/L as absolute IgA deficiency, and IgA levels below the normal range for age as relative IgA deficiency [18].
IgA-tTG was only sporadically performed before 2002, therefore, only patients investigated in 2002 and onwards were included in the analysis of the serologic tests.
Biopsy
All biopsies were reviewed by experienced pathologists using Marsh criteria modified by Oberhuber et al. [20,22]. According to NASPGHAN guidelines [14], children with Marsh Grade II and III were diagnosed with CD. Children with normal biopsies were considered as disease controls (non-CD children); they did not have CD on the basis of the NASPGHAN criteria [14]. Children with non-specific changes on biopsy, such as raised intraepithelial lympho-cytosis (Marsh Grade I), were excluded from the analysis.
Statistical analysis
GraphPad Prism 4 (GraphPad Software Inc., San Diego, USA) and SigmaPlot Version 11 (Systat Software Inc., San Jose, USA) were used for the statistical analysis. The results of descriptive statistics are presented as median, minimum, and maximum value for data with a skewed distribution. For the comparison of study groups, the Mann-Whitney U-test was used for ordinal data and Fischer’s exact test for categorical data. Significance was established at p-values<0.05.
Results
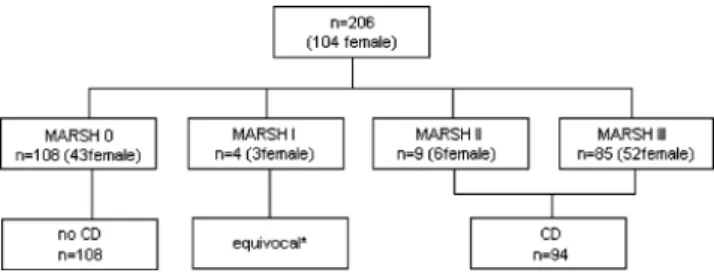
In total, 206 children (104 girls) underwent small-bowel biopsies for suspected CD on the basis of suggestive clinical symptoms and/or elevated serologic markers in Berne and Lucerne between January 2001 and August 2006. Normal biopsies were seen in 112 children (54%). Ninety-four children (46%) met the diagnostic criteria for CD, of whom 91% had changes consistent with Marsh Grade III and 9% with Grade II. Four children showed equivocal results with unspecific changes consistent with Marsh Grade I and were excluded from the analyses (Fig.1).
The number of newly diagnosed children varied between 11 and 22 per year, with fewer cases in 2001 and 2006 (Fig. 2). The median age at diagnosis and the number of young children (<2 years of age) were similar in each year. Compared to children in whom CD was excluded (non-CD group), celiac patients were, on average, older at diagnosis (6.8 years and 4.9 years, respectively, p=0.03) (Table 1). There was a smaller percentage of young children (<2 years of age) in the celiac group (15% compared to 25% without CD). Significantly more girls were diagnosed with CD (62% compared to 40%, p=0.003). Patients with CD had a
higher weight than those without CD (weight z-scores = –1.0 and –1.6, respectively), while their height was similar (height z-scores = –1.2 and –1.4, respectively). Predispos-ing factors such as a positive family history or T1DM were seen in similar proportions in both groups.
Clinical presentation
There was a broad spectrum of clinical symptoms in children with CD (Table2). Gastrointestinal symptoms occurred more often among celiac patients compared to patients without CD (71% versus 55%; p=0.02). In celiac patients, abdominal pain and diarrhea were frequent complaints (37% and 39%, respectively), while abdominal distension, flatulence, and constipation were less common (20%, 3%, and 7%, respectively). FTT was less common in celiac patients (35% versus 53%; p=0.0157). Anemia or microcytosis and hypochromasia as surrogates for iron deficiency occurred significantly more often in celiac patients (61% and 33%; p= 0.0001). Overall, the specificity of a single clinical symptom
Fig. 1 Histology results according to Marsh criteria and final diagnosis for all children (n=206). *Unspecific changes (Marsh Grade I) were seen in four children; one girl with Addison disease, one girl with the subsequent diagnosis of a Helicobacter pylori-associated gastritis, one girl with cystic fibrosis, and one boy with total IgA deficiency and constipation
Fig. 2 Annual number of newly diagnosed celiac patients and median age at diagnosis between 2001 and 2006. The boxes represent the number of newly diagnosed celiac patients per year; the lower dark part displays the number of new cases under the age of 2 years per year. The dots represent the median age at diagnosis for each year
was poor. However, the specificity improved when various combinations of clinical symptoms were examined. For example, children presenting with abdominal symptoms and anemia were more likely to have CD (39% with CD and 17% without CD, p=0.0001).
Serologic tests
IgA-tTG was measured in 167 children, of whom 80 were diagnosed with CD. IgA-tTG was elevated in all celiac patients, with the exception of a 4-year-old boy with typical
symptoms, absolute IgA deficiency, and elevated IgG-AGA. On the other hand, 22 children with normal biopsies had elevated IgA-tTG using the recommended cut-off values for the respective assays. In order to assess the impact of markedly elevated test results, we restricted the analysis to 132 children (63 with CD and 69 without CD), in whom IgA-tTG was measured by human recombinant or purified erythrocyte assays using a cut-off value of 20 IU. The majority of children with CD (n=48, 76%) had markedly elevated IgA-tTG values (>100 IU). However, there were four patients without CD who also had markedly elevated IgA-tTG values. Among these patients, there was a 14-year-old boy with T1DM who had repeatedly elevated IgA-tTG and IgA-EMA without clinical symptoms sugges-tive of CD, and three girls with anemia due to iron deficiency and no other clinical symptoms of CD.
Overall, the sensitivity and specificity for IgA-tTG was 0.99 and 0.75, respectively (Table 3). When the diagnostic value of IgA-tTG was examined in groups of patients with defined clinical presentations, the specificity of IgA-tTG improved in children who reported symptoms involving more than one organ system (Table 2). For example, the specificity of IgA-tTG was 0.93 in children with anemia, 0.98 in children with anemia and gastrointestinal symp-toms, and 1.00 when anemia, gastrointestinal sympsymp-toms, and FTT or short stature were reported.
IgA-EMA was measured in a smaller number of patients (n=89), revealing a sensitivity of 0.98 and sa pecificity of 0.86 (Table 3). There was one child with CD who had elevated IgA-tTG, but normal IgA-EMA. In the majority of
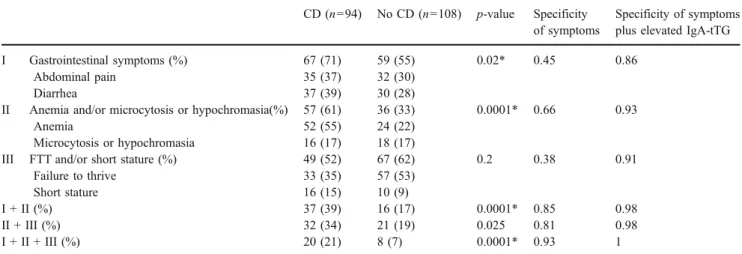
Table 2 Clinical symptoms of children with CD and controls (no CD) and the specificity of clinical symptoms alone or in combination with elevated IgA-tTG
CD (n=94) No CD (n=108) p-value Specificity of symptoms
Specificity of symptoms plus elevated IgA-tTG
I Gastrointestinal symptoms (%) 67 (71) 59 (55) 0.02* 0.45 0.86
Abdominal pain 35 (37) 32 (30)
Diarrhea 37 (39) 30 (28)
II Anemia and/or microcytosis or hypochromasia(%) 57 (61) 36 (33) 0.0001* 0.66 0.93
Anemia 52 (55) 24 (22)
Microcytosis or hypochromasia 16 (17) 18 (17)
III FTT and/or short stature (%) 49 (52) 67 (62) 0.2 0.38 0.91
Failure to thrive 33 (35) 57 (53)
Short stature 16 (15) 10 (9)
I + II (%) 37 (39) 16 (17) 0.0001* 0.85 0.98
II + III (%) 32 (34) 21 (19) 0.025 0.81 0.98
I + II + III (%) 20 (21) 8 (7) 0.0001* 0.93 1
Clinical symptoms are summarized for patients with CD (CD) and controls (no CD). Percentages are given in parentheses (%). Gastrointestinal symptoms are grouped as I, anemia/iron deficiency as II, and FTT/short stature as III
The specificity is displayed for single clinical symptoms and combinations of various symptoms, as well as for the combination of symptoms plus elevated IgA-tTG
*p<0.05
Table 1 Characteristics of the study groups CD (n=94) No CD (n=108) p-value Gender, female (%) 58 (62) 43 (40) 0.003* Age in years, median (range) 6.8 (0.8–15.1) 4.9 (0.4–15.9) 0.030* Height z-score, median (range) −1.2 (-3.9–3.6) −1.4 (-4.0–4.3) 0.483 Weight z-score, median (range) −1.0 (-4.1–2.7) −1.6 (-3.7–3.8) 0.021* Family history (first-degree relatives) 16 12 Associated conditions T1DM 6 3
Juvenile rheumatoid arthritis 1 1
Down syndrome 1 1
Addison disease 1 0
patients, IgG-AGA and IgA-AGA were measured. While IgG-AGA showed a relatively good sensitivity of 0.82 and a poor specificity of 0.37, the sensitivity of IgA-AGA was only 0.65 and the specificity was 0.79.
Selective IgA deficiency
Total serum IgA was measured in all children. In seven patients, absolute IgA deficiency was found, of whom two were diagnosed with CD. Interestingly, one of these two children had slightly elevated IgA-tTG (26 IU) using the human recombinant tTG assay. In addition, there were eight celiac patients with relative IgA deficiency (low values for age), all having elevated IgA-tTG and IgA-EMA, while IgA-AGA was elevated in only one child. In total, 26 children with low IgA for age and normal tTG or IgA-EMA underwent a small-bowel biopsy, with normal biopsy results in all children. Excluding patients with absolute IgA deficiency, the overall sensitivity of IgA-tTG was 1.00 and the specificity was 0.73.
Discussion
Our retrospective analysis shows that the classic presenta-tion of CD [10,14] is not a very common feature of the disease; a rather small number of children (15%) was diagnosed under the age of 2 years with the classic triad of symptoms. A larger number of children presented at an older age with milder symptoms. During the observation period of our study, the number of new cases per year and the median age at diagnosis remained unchanged. As described in previous reports from several populations, we found an increased risk for CD in girls compared to boys [8, 15, 16]. This gender difference may be explained by genetic factors and, possibly, environmental exposures. It has been postulated that genetic factors influence immune
responses and, thereby, make girls more susceptible to environmental exposures that have been associated with an increased risk for CD, such as the early introduction of gluten [2,8,17].
We revealed that symptoms of intestinal malabsorption and abdominal pain were frequent complaints. However, almost one third of celiac patients did not report any intestinal symptoms. This underlines the importance of a high suspicion for CD in children presenting with extra-intestinal symptoms, such as iron deficiency or short stature [9]. In our cohort, the likelihood of disease increased with the presence of anemia or microcytosis and hypochromasia as surrogates for iron deficiency in conjunction with abdominal symptoms or short stature, or both. Not surprisingly, the more symptoms the children had, the more likely they were to have the disease. When children with CD were compared to our disease control group with normal intestinal biopsies, the children without CD were, on average, younger and had more pronounced FTT. In our view, this rather surprising difference may be explained by the fact that serologic testing is generally thought to be less reliable in young toddlers than in older children. Therefore, young children with normal or mildly elevated serologic markers (especially IgG-AGA) and/or decreased levels of total IgA are more likely to undergo intestinal biopsies to rule out CD. Also, children with more pronounced FTT are often more aggressively investigated than those with milder symptoms.
Regarding the diagnostic accuracy of serologic markers, our analysis confirms excellent sensitivity for both IgA-tTG and IgA-EMA antibodies (1.00 and 0.98, respectively, in children without absolute IgA deficiency). In the literature, sensitivity rates vary between 0.85–0.98, depending of the prevalence of CD in the respective cohorts and the study design [12, 27, 29, 31]. In a recent systematic review, Rostom et al. [24] calculated pooled sensitivity rates for IgA-tTG and IgA-EMA of 0.90. Although it has been suggested in previous studies that normal IgA-tTG and IgA-EMA may occur more often in celiac patients under the age of 2 years [4, 5], we could not detect any differences between age groups. The specificity for IgA-tTG and IgA-EMA, on the other hand, was limited in our cohort compared to the results from other studies. Rostom et al. [24] described a pooled specificity of 0.96–0.99 for
IgA-tTG and 0.95–0.97 for IgA-EMA, while in our study, the specificity was only 0.75 for tTG and 0.86 for IgA-EMA, resulting in a considerable number of children with elevated IgA-tTG and IgA-EMA and normal biopsies. In order to define subgroups of patients in whom serologic testing is highly reliable, Barker et al. [3] and Diamanti et al. [11] suggested distinguishing patients with markedly elevated IgA-tTG (>100 IU, using human recombinant or purified erythrocyte assays). However, in our group, we
Table 3 Sensitivity and specificity of celiac antibodies
CD (%) No CD (%) Sensitivity Specificity IgA-tTG (n=167) 79 (99) 22 (25) 0.99 0.75 IgA-EMA (n=89) 45 (98) 6 (14) 0.98 0.86 IgA-AGA (n=166) 51 (65) 18 (21) 0.65 0.79 IgG-AGA (n=164) 63 (82) 55 (63) 0.82 0.37
The number of patients with positive results for IgA-tTG, IgA-EMA, IgA-AGA, and IgG-AGA are displayed for patients with celiac disease (CD) and controls (no CD). Percentages are given in parentheses. The sensitivity and specificity were calculated for each test.
observed four oligosymptomatic children with markedly elevated IgA-tTG and normal biopsies. Although some of these patients may develop histological changes over time, they do not have CD based on the current diagnostic criteria and, thus, a gluten-free diet is not recommended. When the diagnostic accuracy of IgA-tTG was evaluated in subgroups of children with defined clinical symptoms, the specificity of IgA-tTG was 1.00 in children presenting with the classic triad of symptoms of intestinal malabsorption, growth retardation, and iron deficiency. This observation raises the question as to whether small-bowel biopsies for diagnostic confirmation are required for all children with the classic triad of symptoms and highly elevated tTG or IgA-EMA. In our view, this diagnostic approach should be tested in larger cohorts. In patients with borderline elevations of IgA-tTG, the measurement of IgA-EMA may be useful, as suggested by Hill et al. [14]. In our cohort, 13 of 22 children with falsely elevated IgA-tTG had negative IgA-EMA.
IgA-AGA and IgG-AGA did not add diagnostic value to the screening process in patients without IgA deficiency. Contrarily, elevated IgA-AGA or IgG-AGA may raise the suspicion of CD in cases with normal tTG or IgA-EMA and, thus, prompt further unnecessary testing.
Absolute IgA deficiency, defined as IgA < 0.05 g/L [18], and relative IgA deficiency, defined as low for age values, were relatively common in our cohort. Interestingly, all children with CD and low IgA for age had elevated IgA-tTG or IgA-EMA. This observation suggests that children with decreased, but measurable total IgA levels, are producing sufficient amounts of IgA antibodies to reliably rule out CD on the basis of normal IgA-tTG or IgA-EMA values. In children with absolute IgA deficiency and normal IgA-tTG or IgA-EMA, the measurement of IgG antibodies is recommended to improve the sensitivity of the screening strategy [7]. Due to the lack of measurements of IgG-tTG in our study, we could not compare the diagnostic accuracy of different IgG antibodies. According to Rostom et al. [24], the sensitivity of IgG-AGA was better than IgG-tTG (0.80 compared to 0.40), while the specificity was weaker for IgG-AGA (0.80–0.90 and 0.98, respectively).
Based on our study results and a review of the literature, we recommend the routine measurement of either IgA-tTG or IgA-EMA and total IgA levels as the primary screening strategy. In patients with absolute IgA deficiency, the additional measurement of IgG-AGA or IgG-tTG is recommended.
The validity of our study may be somewhat limited by biases in the measurement of serologic markers and patient selection. During the study period from 2001 to 2006, different assays for IgA-tTG were used by various laborato-ries. Due to the retrospective study design, we were not able to determine in all cases which IgA-tTG assay was used. In a limited analysis comparing IgA-tTG assays using purified
erythrocyte tTG and human recombinant tTG, we could not detect any difference (data not shown). However, due to the limited availability and also the reliability of data, the groups were too small to draw conclusions. In terms of patient selection, we included all patients who underwent intestinal biopsies for suspected CD, in whom serologic testing was done prior to endoscopy, regardless of which serologic tests had been performed. The vast majority of patients were investigated because of clinical symptoms of CD. Only a small subset of patients was screened for CD because of associated diseases, such as T1DM or a positive family history. Since many of these patients also reported clinical symptoms, they were all included in our study.
In summary, CD is frequently diagnosed in school age children with mild clinical manifestations. Signs and symptoms suggestive of CD, such as anemia, short stature, or persistent abdominal complaints, should raise suspicion and prompt screening, consisting of IgA-tTG or IgA-EMA and total IgA. In our view, the specificity of IgA-tTG is insufficient to confidently diagnose a condition requiring a life-long gluten-free diet. Therefore, a small-bowel biopsy is generally required for diagnostic confirmation. Further studies in larger cohorts are needed in order to evaluate whether histological confirmation is needed in all children, including those with typical symptoms involving more than one organ system and markedly elevated IgA-tTG.
References
1. Agency for Healthcare Research and Quality (2005) National Institutes of Health Consensus Development Conference State-ment on Celiac Disease, June 28–30, 2004. Gastroenterology 128 (4 Suppl 1):S1–S9
2. Ascher H, Krantz I, Rydberg L et al (1997) Influence of infant feeding and gluten intake on coeliac disease. Arch Dis Child 76 (2):113–117
3. Barker CC, Mitton C, Jevon G et al (2005) Can tissue trans-glutaminase antibody titers replace small-bowel biopsy to diag-nose celiac disease in select pediatric populations? Pediatrics 115 (5):1341–1346
4. Bürgin-Wolff A, Gaze H, Hadziselimovic F et al (1991) Antigliadin and antiendomysium antibody determination for coeliac disease. Arch Dis Child 66(8):941–947
5. Bürgin-Wolff A, Dahlbom I, Hadziselimovic F et al (2002) Antibodies against human tissue transglutaminase and endomy-sium in diagnosing and monitoring coeliac disease. Scand J Gastroenterol 37(6):685–691
6. Carlsson AK, Axelsson IE, Borulf SK et al (2001) Serological screening for celiac disease in healthy 2.5-year-old children in Sweden. Pediatrics 107(1):42–45
7. Cataldo F, Lio D, Marino V et al (2000) IgG(1) antiendomysium and IgG antitissue transglutaminase (anti-tTG) antibodies in coeliac patients with selective IgA deficiency. Working Groups on Celiac Disease of SIGEP and Club del Tenue. Gut 47(3):366–369 8. Ciacci C, Cirillo M, Sollazzo R et al (1995) Gender and clinical
presentation in adult celiac disease. Scand J Gastroenterol 30 (11):1077–1081
9. Corazza GR, Valentini RA, Andreani ML et al (1995) Subclinical coeliac disease is a frequent cause of iron-deficiency anaemia. Scand J Gastroenterol 30(2):153–156
10. Dewar DH, Ciclitira PJ (2005) Clinical features and diagnosis of celiac disease. Gastroenterology 128(4 Suppl 1):S19–S24 11. Diamanti A, Colistro F, Calce A et al (2006) Clinical value of
immunoglobulin A antitransglutaminase assay in the diagnosis of celiac disease. Pediatrics 118(6):e1696–e1700
12. Farrell RJ, Kelly CP (2002) Celiac sprue. N Engl J Med 346 (3):180–188
13. Fasano A (2005) Clinical presentation of celiac disease in the pediatric population. Gastroenterology 128(4 Suppl 1):S68–S73 14. Hill ID, Dirks MH, Liptak GS et al (2005) Guideline for the
diagnosis and treatment of celiac disease in children: recommen-dations of the North American Society for Pediatric Gastroenter-ology, Hepatology and Nutrition. J Pediatr Gastroenterol Nutr 40 (1):1–19
15. Hoffenberg EJ, MacKenzie T, Barriga KJ et al (2003) A prospective study of the incidence of childhood celiac disease. J Pediatr 143(3):308–314
16. Ivarsson A, Persson LA, Nyström L et al (2003) The Swedish coeliac disease epidemic with a prevailing twofold higher risk in girls compared to boys may reflect gender specific risk factors. Eur J Epidemiol 18(7):677–684
17. Jacobson DL, Gange SJ, Rose NR et al (1997) Epidemiology and estimated population burden of selected autoimmune diseases in the United States. Clin Immunol Immunopathol 84(3):223–243 18. Lilic D, Sewell WA (2001) IgA deficiency: what we should—or
should not—be doing. J Clin Pathol 54(5):337–338
19. Mäki M, Mustalahti K, Kokkonen J et al (2003) Prevalence of celiac disease among children in Finland. N Engl J Med 348 (25):2517–2524
20. Marsh MN (1992) Gluten, major histocompatibility complex, and the small intestine. A molecular and immunobiologic approach to the spectrum of gluten sensitivity (‘celiac sprue’). Gastroenterol-ogy 102(1):330–354
21. Murray JA (2005) Celiac disease in patients with an affected member, type 1 diabetes, iron-deficiency, or osteoporosis? Gastroenterology 128(4 Suppl 1):S52–S56
22. Oberhuber G, Granditsch G, Vogelsang H et al (1999) The histo-pathology of coeliac disease: time for a standardized report scheme for pathologists. Eur J Gastroenterol Hepatol 11(10):1185–1194 23. Ravikumara M, Tuthill DP, Jenkins HR et al (2006) The changing
clinical presentation of coeliac disease. Arch Dis Child 91 (12):969–971
24. Rostom A, Dubé C, Cranney A et al (2005) The diagnostic accuracy of serologic tests for celiac disease: a systematic review. Gastroenterology 128(4 Suppl 1):S38–S46
25. Rutz R, Ritzler E, Fierz W et al (2002) Prevalence of asymptomatic celiac disease in adolescents of eastern Switzerland. Swiss Med Wkly 132(3–4):43–47
26. Steens RF, Csizmadia CG, George EK et al (2005) A national prospective study on childhood celiac disease in the Netherlands 1993–2000: an increasing recognition and a changing clinical picture. J Pediatr 147(2):239–243
27. Stern M; Working Group on Serologic Screening for Celiac Disease (2000) Comparative evaluation of serologic tests for celiac disease: a European initiative toward standardization. J Pediatr Gastroenterol Nutr 31(5):513–519
28. Tommasini A, Not T, Kiren V et al (2004) Mass screening for coeliac disease using antihuman transglutaminase antibody assay. Arch Dis Child 89(6):512–515
29. Troncone R, Maurano F, Rossi M et al (1999) IgA antibodies to tissue transglutaminase: an effective diagnostic test for celiac disease. J Pediatr 134(2):166–171
30. Walker-Smith JA, Guandalini S, Schmitz J et al (1990) Revised criteria for diagnosis of coeliac disease. Report of Working Group of European Society of Paediatric Gastroenterology and Nutrition. Arch Dis Child 65(8):909–911
31. Zintzaras E, Germenis AE (2006) Performance of antibodies against tissue transglutaminase for the diagnosis of celiac disease: meta-analysis. Clin Vaccine Immunol 13(2):187–192