Z Gerontol Geriat 2010 · 43:19–24 DOI 10.1007/s00391-009-0082-0 Eingegangen: 22. August 2009 Akzeptiert: 26. September 2009 Online publiziert: 11. Dezember 2009 © Springer-Verlag 2009
R.T. Proyer · W. Ruch · L. Müller
Section on Personality and Assessment,
Department of Psychology, University of Zurich, Switzerland
Sense of humor
among the elderly
Findings using the German version of the SHS
Little is known about sense of humor and its correlates in the elderly. Stu-dying differences in humor across the lifespan is beneficial for people of all ages. However, knowing how elder-ly people deal with humor might be of added importance for those wor-king with aged persons, as this might be crucial for finding a fruitful com-munication base. In addition, relati-onships with quality of life are of inte-rest as they might be potential indica-tors for intervention programs. Paul McGhee’s conceptualization of sense of humor is used in this study.
Concepts of humor
There are different conceptualizations of humor in personality research [7, 8]. Some researchers were interested in the tempe-ramental basis of humor [10, 11], whi-le others tried to comprehensively iden-tify the behavioral domains of everyday humorous conduct, humor-related beha-viors or behavior tendencies, aggregated styles of humorous conduct [2, 3], or ad-aptive and maladad-aptive dimensions of hu-mor [4].
The Sense of Humor Scale
Paul McGhee [5] favored a multi-face-ted concept of sense of humor. He ar-gues that humor is a form of play—the play with ideas. A playful frame of mind (as opposed to a serious one) is important to successfully process humorous stimuli. McGhee argues that playfulness forms the
basis for sense of humor, which is compo-sed of six less basic components (facets) or humor skills. They are hierarchically orga-nized from enjoyment of humor to finding humor under stress, with the ones higher in the hierarchy being more difficult to develop. He introduced a rationally cons-tructed scale (Sense of Humor Scale, SHS) [5] for measuring these aspects.
>
Humor is a form of play –
the play with ideas
McGhee’s model is not only of theoretical but also of practical interest. He postulates that playfulness is inherited but individu-als become serious when they grow up, which in turn impairs their sense of hu-mor. Thus, the rediscovery of playfulness is a trigger for activating a person’s sen-se of humor. McGhee developed an eight-step program to train sense of humor. This dynamic part of this model is not yet sup-ported. There is no empirical study aimed at examining whether a shift in serious-ness vs. playfulserious-ness indeed enhances the sense of humor. There is first evidence that training changes several componen-ts of the sense of humor [15], and the in-tervention program that comes with the scale does involve a training of the skills measured by this scale. Thus far, there are no studies testing this program with an el-derly population.
Ruch and Carrell [9] used the Ameri-can and German versions of the SHS in an empirical study. Factor analyses of the data suggested two or three factors, but not the general factor implied by the original
mo-del. The six components (and only those) were found to form a homogeneous fac-tor that is separate from the original good vs. bad mood and seriousness vs. play-ful factors. The reliabilities of the subsca-les (with five items each) yielded coeffici-ents between 0.56 and 0.78 with a medi-an of 0.71. This indicates that this versi-on cannot be recommended for practical use because of its low reliabilities (subsca-le “laughter”). In addition, the trait cheer-fulness and sense of humor correlated highly (r=0.85), i.e., they were practical-ly interchangeable. Overall, the SHS sca-les showed a high convergent validity with the State–Trait Cheerfulness Inventory (STCI) scales [9], and the sense of humor scale was almost interchangeable with the trait cheerfulness.
As a result of the Ruch and Carrell stu-dy, McGhee [5] introduced a new scoring scheme with three factors, i.e., playful vs. serious attitude, positive vs. negative mood, and sense of humor, whereby sense of humor consists of six facets (enjoyment of humor, laughter, verbal humor, finding humor in everyday life, laughing at your-self, and humor under stress). In addition, a total score can be computed using all the items of the SHS.
Are there age differences
in the SHS?
Studies by Ruch et al. [14, 14], who exa-mined humor in a cross-sectional design within a positive psychology framework, suggested that there is a decline with age
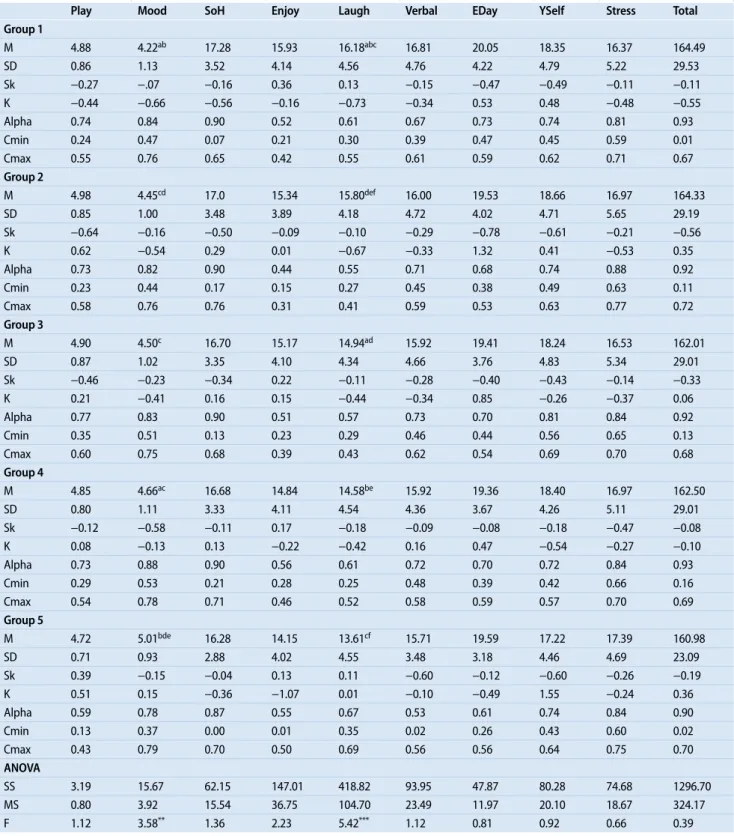
Tab. 1 Distribution, mean score differences, and reliability of the SHS scores in five different age samples
Play Mood SoH Enjoy Laugh Verbal EDay YSelf Stress Total
Group 1 M 4.88 4.22ab 17.28 15.93 16.18abc 16.81 20.05 18.35 16.37 164.49 SD 0.86 1.13 3.52 4.14 4.56 4.76 4.22 4.79 5.22 29.53 Sk −0.27 −.07 −0.16 0.36 0.13 −0.15 −0.47 −0.49 −0.11 −0.11 K −0.44 −0.66 −0.56 −0.16 −0.73 −0.34 0.53 0.48 −0.48 −0.55 Alpha 0.74 0.84 0.90 0.52 0.61 0.67 0.73 0.74 0.81 0.93 Cmin 0.24 0.47 0.07 0.21 0.30 0.39 0.47 0.45 0.59 0.01 Cmax 0.55 0.76 0.65 0.42 0.55 0.61 0.59 0.62 0.71 0.67 Group 2 M 4.98 4.45cd 17.0 15.34 15.80def 16.00 19.53 18.66 16.97 164.33 SD 0.85 1.00 3.48 3.89 4.18 4.72 4.02 4.71 5.65 29.19 Sk −0.64 −0.16 −0.50 −0.09 −0.10 −0.29 −0.78 −0.61 −0.21 −0.56 K 0.62 −0.54 0.29 0.01 −0.67 −0.33 1.32 0.41 −0.53 0.35 Alpha 0.73 0.82 0.90 0.44 0.55 0.71 0.68 0.74 0.88 0.92 Cmin 0.23 0.44 0.17 0.15 0.27 0.45 0.38 0.49 0.63 0.11 Cmax 0.58 0.76 0.76 0.31 0.41 0.59 0.53 0.63 0.77 0.72 Group 3 M 4.90 4.50c 16.70 15.17 14.94ad 15.92 19.41 18.24 16.53 162.01 SD 0.87 1.02 3.35 4.10 4.34 4.66 3.76 4.83 5.34 29.01 Sk −0.46 −0.23 −0.34 0.22 −0.11 −0.28 −0.40 −0.43 −0.14 −0.33 K 0.21 −0.41 0.16 0.15 −0.44 −0.34 0.85 −0.26 −0.37 0.06 Alpha 0.77 0.83 0.90 0.51 0.57 0.73 0.70 0.81 0.84 0.92 Cmin 0.35 0.51 0.13 0.23 0.29 0.46 0.44 0.56 0.65 0.13 Cmax 0.60 0.75 0.68 0.39 0.43 0.62 0.54 0.69 0.70 0.68 Group 4 M 4.85 4.66ac 16.68 14.84 14.58be 15.92 19.36 18.40 16.97 162.50 SD 0.80 1.11 3.33 4.11 4.54 4.36 3.67 4.26 5.11 29.01 Sk −0.12 −0.58 −0.11 0.17 −0.18 −0.09 −0.08 −0.18 −0.47 −0.08 K 0.08 −0.13 0.13 −0.22 −0.42 0.16 0.47 −0.54 −0.27 −0.10 Alpha 0.73 0.88 0.90 0.56 0.61 0.72 0.70 0.72 0.84 0.93 Cmin 0.29 0.53 0.21 0.28 0.25 0.48 0.39 0.42 0.66 0.16 Cmax 0.54 0.78 0.71 0.46 0.52 0.58 0.59 0.57 0.70 0.69 Group 5 M 4.72 5.01bde 16.28 14.15 13.61cf 15.71 19.59 17.22 17.39 160.98 SD 0.71 0.93 2.88 4.02 4.55 3.48 3.18 4.46 4.69 23.09 Sk 0.39 −0.15 −0.04 0.13 0.11 −0.60 −0.12 −0.60 −0.26 −0.19 K 0.51 0.15 −0.36 −1.07 0.01 −0.10 −0.49 1.55 −0.24 0.36 Alpha 0.59 0.78 0.87 0.55 0.67 0.53 0.61 0.74 0.84 0.90 Cmin 0.13 0.37 0.00 0.01 0.35 0.02 0.26 0.43 0.60 0.02 Cmax 0.43 0.79 0.70 0.50 0.69 0.56 0.56 0.64 0.75 0.70 ANOVA SS 3.19 15.67 62.15 147.01 418.82 93.95 47.87 80.28 74.68 1296.70 MS 0.80 3.92 15.54 36.75 104.70 23.49 11.97 20.10 18.67 324.17 F 1.12 3.58** 1.36 2.23 5.42*** 1.12 0.81 0.92 0.66 0.39
Group 1=18–29 years (n=143), Group 2=30–39 (n=238), Group 3=40–49(n=378), Group 4=50–59 (n=198), Group 5=60–74 (n=41). Play playful vs. serious attitude; Mood positive vs. negative mood; SoH sense of humor; Enjoy enjoyment of humor; Laugh laughter; Verbal verbal humor; Eday humor in everyday life; YSelf laughing at yourself; Stress humor under stress; Total total score of all SHS items; M mean; SD standard deviation; Sk skewness; K kurtosis; alpha Cronbach alpha (internal consis-tency); Cmin/Cmax minimum/maximum of corrected item-total correlation; ANOVA: grouping variable age groups, dependent variables SHS scales; SS sum of squares, MS mean squares, F F ratio.a-f means sharing a superscript differ significantly from each other.*p<0.05; **p<0.01; ***p<0.001.
but that the oldest persons in the sample yielded higher scores again.
E This study depicts that there are
changes in humor throughout the lifespan but that they are not linear. Thus far, there are no data on the SHS that directly refer to an older populati-on. There were two facets of sense of hu-mor that yielded age differences. Younger participants were higher in their enjoy-ment of verbal humor (r=−0.30, p<0.01) and found more humor in everyday life (r=−0.20, p<0.05, both n=151). Thus, the-re is a hint of a decline of certain facets of the SHS with age. However, these results need a broader basis before they can be in-terpreted at the content level.
The SHS in an elderly population
Ruch et al. [12] adapted the revised form of the SHS [5] to German. It consists of 40 items in a seven-point answer format (1=strongly agree to 7=strongly disagree) and measures the three domains of the sense of humor, i.e., playful vs. serious at-titude (8 items; a sample item is: “I am in a serious frame of mind most of the ti-me”), positive vs. negative mood (8 items; “I am often depressed”), sense of humor (24 items; “I generally look for sitcoms or other funny programs to watch on TV”) that consists of five humor skills (“enjoy-ment of humor,” “verbal humor,” “humor in everyday life,” “laughing at yourself,” and “humor under stress”).The Ruch et al. [12] data show that the scale is reliable (the apha coefficients for the domains were between 0.74 and 0.90) and useful for research purposes. It can be well localized within current personality models (it shows stable relations to hig-her extraversion and lower neuroticism), and to variables of positive psychological functioning. For example, optimism is a very potent predictor of playfulness, posi-tive mood, and the sense of humor (whi-le pessimism has an inverse relationship with these relations). The same was true for the humor skills—yet, enjoyment of humor existed independently from opti-mism and pessiopti-mism (r2≤0.01). A
simi-lar relation was found to personal (and to a lower degree for national) well-being
Z Gerontol Geriat 2010 · 43:19–24 DOI 10.1007/s00391-009-0082-0 © Springer-Verlag 2009
R.T. Proyer · W. Ruch · L. Müller
Sense of humor among the elderly.
Findings using the German version of the SHS
Abstract
Empirical studies on humor among the el-derly are lacking. Based on the model of sense of humor by Paul McGhee, different age groups are compared (n=979) in the present study. Data suggest that playful-ness and sense of humor are stable across dif-ferent age groups (in a cross-sectional de-sign) but that elderly participants were high-est in positive mood. However, they also in-dicated that they laughed less and less easi-ly than younger participants. Among the el-derly, those who frequently (more than once a week) meet with friends and colleagues yielded higher expressions in different as-pects of the sense of humor than those who
meet friends and colleagues less often. Gen-erally, humor was positively associated with personal and national well-being. However, among those participants older than 60 years of age, national well-being (i.e., satisfaction with the government, safety, or economics in the country) was negatively related to humor. Results are discussed together with a gener-al outlook on the use of humor interventions for increasing the well-being and quality of life of elderly people.
Keywords
Elderly · Humor · Sense of humor scale · Well-being
Sinn für Humor bei Älteren. Untersuchungen
mit einer deutschen Fassung der Sense-of-Humor-Scale
Zusammenfassung
Es fehlt an empirischen Studien, die sich mit dem Humor älterer Menschen beschäftigen. Auf der Basis von Paul McGhees Modell zum Sinn für Humor wurden in der vorliegenden Untersuchung Menschen (n=979) verschie-dener Altersgruppen in ihrem Sinn für Humor verglichen. Die (Querschnitts-)Daten legen nahe, dass eine spielerische Haltung („play-fulness“) und der Sinn für Humor über ver-schiedene Altersgruppen hinweg stabil blei-ben. Die ältesten TeilnehmerInnen erzielten die höchsten Werte in positiver Stimmung, sie gaben allerdings auch an, dass sie weni-ger und weniweni-ger leicht lachen als Jünweni-gere. Unter den älteren TeilnehmerInnen erzielten jene Personen, die sich häufig (mehr als ein-mal pro Woche) mit Freunden treffen, höhere Werte in verschiedenen Aspekten des Sinns
für Humor als jene, die sich weniger häufig mit Freunden treffen. Im Allgemeinen war Humor positiv mit persönlichem und natio-nalem Wohlbefinden korreliert, in der Grup-pe der über 60-Jährigen zeigten sich aller-dings negative Zusammenhänge mit dem nationalen Wohlbefinden (das betrifft bei-spielsweise die Zufriedenheit mit der Regie-rung, Fragen der Sicherheit oder der wirt-schaftlichen Situation des Landes). Die Ergeb-nisse werden diskutiert im Zusammenhang mit den Möglichkeiten von Humorinterven-tionen, um Lebenszufriedenheit und Lebens-qualität älterer Menschen zu steigern.
Schlüsselwörter
Ältere Menschen · Humor · Sinn für Humor-Skala · Wohlbefinden
(again enjoyment of humor but also ver-bal humor were virtually unrelated).
Method
For the present article, we reanalyzed the-se data with a special focus on an elder-ly population. The basic sample consisted of n=979 participants. There were 154 ma-le and 823 femama-le subjects (2 subjects did not specify their gender). The mean age was 41.92 years (SD=10.56) and ranged from 18 to 74 years. From the answers gi-ven, 41.27% were married (or in a regis-tered partnership), 16.45% were not mar-ried but lived together with their partner, 11.34% were in a partnership but did not li-ve with their partner, 9.50% were separa-ted or divorced, and 0.51% were widowed. In addition to the SHS, we also used the International Well-being Index (IWI) for some of the analyses [3, 6] which measures personal and national well-being.
Results
Mean score differences
in the SHS across the lifespan
The total sample was split into five age groups. For each of these groups, we com-puted the distribution of the scores, relia-bilities, and mean level differences across the groups (. Tab. 1).It is shown in . Tab. 1 that the SHS scores were normally distributed in all age samples. Furthermore, they yielded acceptable to high reliability coefficients in each age group. Exceptions were play-fulness in the sample of the oldest par-ticipants and enjoyment of humor in all groups. Some of the corrected-item total correlations were low, but on average, th-ey were in an acceptable range.
Two of the SHS scales yielded signifi-cant age differences. First, there were con-siderable mean level differences for the mood scale. The older the participants were the higher their positive mood was. The oldest group (i.e., those older than 60) yielded the highest mean score— higher than any of the other groups (ex-cept for those older than 50). There were no differences within the three youngest groups. Second, with respect to humor skills, laughing decreased with age. The
three oldest groups differed significant-ly from the two youngest (neither the two youngest nor the three oldest groups dif-fered from each other); thus, they indicate being able to laugh less and less easily.
Additional analyses (not shown in . Tab. 1) were conducted with the two oldest age groups to examine what their factors contribute to humor experiences in older age. There were no differences in the variables being single vs. being in a partnership, practicing one’s religi-on vs. not practicing religi-one’s religireligi-on, ed-ucational level, or alcohol and nicotine consumption. However, those who fre-quently (more than once a week) met with friends and colleagues scored hig-her in all three of the main scales com-pared with those who do not meet friends at all or less than weekly, i.e., playfulness (t(230)=3.78, p<0.01; M=4.93 [SD=0.78] vs. M=4.45 [SD=0.72]; d=0.63); posi-tive mood (t(230)=4.51, p<0.01; M=4.90 [SD=0.97] vs. M=4.13 [SD=1.21]; d=0.75); and sense of humor (t(230)=2.01, p<0.05; M=16.84 [SD=3.32] vs. M=15.77 [SD=2.89]; d=0.33). They were also higher in three humor skills: verbal humor (t(230)=2.27, p<0.05; M=16.19 [SD=4.20] vs. M=14.63 [SD=4.15]; d=0.37), finding humor in eve-ryday life (t(230)=2.04, p<0.05; M=19.66 [SD=3.68] vs. M=18.46 [SD=3.04]; d=0.33), and humor under stress (t(230)=2.21, p<0.05; M=17.46 [SD=5.00] vs. M=15.62 [SD=4.90]; d=0.37).
Humor and well-being
among the elderly
Proyer et al. [12] also collected data on the relation between the SHS and different in-dicators of (personal and national) well-being. We reanalyzed these data by split-ting the sample into four age groups and computed Pearson correlation coeffici-ents with the items from the Internatio-nal Well-being Index [6] in each of the age groups (. Fig. 1).
The differences in the relation to dif-ferent indicators of well-being in the four age groups are shown in . Fig. 1. E Striking is that all negative relations
to indicators of well-being were found for the oldest group (i.e., >60 years).
For example, elderly persons with a high-er sense of humor tended to feel less safe (at the moment and expected for the futu-re) and less happy with their social group. However, it should be noted that no data were available on whether those partici-pants suffered from any physical illnesses or from psychological disturbances that might distort feelings of safety or whether they suffered from many losses within their social group.
Equally important as the discussion of negative relations is that there do not seem to be major differences in the relation of playfulness and (positive) mood to dif-ferent indicators of personal well-being. Though some of the correlation coeffici-ents failed to reach statistical significan-ce (due to the smaller number of persons in these groups), a playful frame of mind seemed to contribute to personal well-being of the elderly. In some cases (disre-garding statistical significance), it even ex-ceeded the coefficients of younger partici-pants (e.g., satisfaction with the standard of living or with one’s own health condi-tion or one’s religiousness). A similar pic-ture, yet with higher correlation coeffici-ents, was found for the relation between positive mood and higher personal well-being.
These relations were also found for the total score. However, as this is an averaged score across all scales it would not be fair to say that a higher sense of humor corre-lates with a lower personal well-being in the elderly in general. This holds true (but is not statistically significant) for those in-dicators that deal with safety and group cohesion. For the latter, it could be hypo-thesized that the lack of social contacts or dissatisfaction with the existing contacts must be especially harmful to those with a higher sense of humor score and who want to share this with others.
The results were different for the indi-cators national well-being. A higher sen-se of humor score in the elderly was asso-ciated primarily with dissatisfaction about the economy and the economic situation of the country, about the government, and national safety. Likewise, playful el-derly persons indicated lower satisfaction with the general (economic) situation of the country. Positive mood in the elderly
Beiträge zum Themenschwerpunkt
existed independently to the expression of national well-being in the elderly.
Overall, these analyses suggest that the relation between well-being (be it per-sonal or national) and humor is not as straightforward as among younger peo-ple. In particular, the negative relations to indicators of national well-being need further explanation. However, it should be pointed out that (unlike that for the per-sonal well-being) there is little theoretical basis that humor should be related to na-tional well-being at all. Despite this, the-re seems to be such a the-relation, of course lower than for the personal well-being, among younger adults. Different variab-les might mediate this relation. We tested (separately via partial correlations) the influence of both demographic (educa-tional level, size of town the participants were living in) and psychological variables (psychoticism, extraversion, and neuroti-cism1) as potential mediators. Although
some of them reduced the negative cor-relations for some of the variables (whi-le others (whi-led to even higher negative re-lations, e.g., controlling for the educatio-nal level led to a higher negative correlati-on between playfulness and naticorrelati-onal well-being; r=−0.28, n.s.) but none of them see-1 Assessed via the standard form of the revi-sed Eysenck Personality Questionnaire (EPQ-R).
med to solely have a marked influence2.
These analyses suggest that other variables seem to be of greater importance. For exa-mple, one might think of the economic si-tuation of the person him-/herself that re-flects on the national level but also on dif-ferent factors such as care (needed and re-ceived) or the level of activity. In addition, one has to consider limitations of the sam-ple, such as those persons over 60 years of age with access to the Internet and willing to complete longer test batteries on the In-ternet might not necessarily be represen-tative for the population.
Without going into too many details it should be noted that the results were high-ly similar for the humor skills. In the youn-ger age groups, finding humor in everyday life in particular was associated with high-er satisfaction with one’s social contacts (rs between r=0.24 and 0.36, p<0.01). Notable negative correlation coefficients were only found for those older than 60 years of age. A few of these relations should be high-lighted. For example, those who felt dissa-tisfaction about their personal future were lower in verbal humor (r=−0.41, p<0.01). Greatest dissatisfaction about the natio-nal well-being was experienced by those who do not use humor under stress (me-2 Controlling for all variables simultaneously in one analysis also did not change the coeffici-ents strongly.
dian r=−0.33) and by those with lower in-clination to finding humor in everyday life (median r=−0.32).
Discussion and implications
for practice
The study revealed several interesting fin-dings about the sense of humor in the el-derly. First of all, age does not seem to ha-ve a major impact on playfulness or on the sense of humor; both remain stab-le over the age span. Further good news is that positive mood increases with age. This might be related to the upcoming re-tirement. In our cross-sectional data, the oldest participants were those displaying the highest positive mood. However, the older people were, the less often and the less easily they laughed (facet laughter of the SHS). Those older than 60 years who spend more time with friends in a typical week yielded higher levels of playfulness, higher positive mood, and a higher sense of humor (compared to those who spend less time with their friends). Similar fin-dings were found for the time spent with the partner or with the time spent with one’s hobbies. Likewise one might think that the activity level seems to contribute to how people deal with humor and laugh-ter in older age. Furthermore, a higher le-vel of social activities might contribute to well-being among the elderly. However,
* * ** * * * * * * * * * * * * * * * * * * * * * * * * * * * * * * * * * * * * * * * * * * * ** * *** b National WB c Total scores –0.60 Achievement Relations Safety Social group Future safety Religiosity Situation of country Environment Social conditions Government Economy National safety Personal National Total 0.60 –0.40–0.20 0.00 0.20 0.40 * * * * * * * * * * * * * * * * * * * * * * * * * * * * * * * * * * * * b National WB c Total scores –0.60 Achievement Relations Safety Social group Future safety Religiosity Situation of country Environment Social conditions Government Economy National safety Personal National Total 0.60 –0.40–0.20 0.00 0.20 0.40 * ** * ** ** *** * * * * * * * * * * * * * * * ** * b National WB c Total scores –0.60 Achievement Relations Safety Social group Future safety Religiosity Situation of country Environment Social conditions Government Economy National safety Personal National Total 0.60 –0.40 –0.200.00 0.20 0.40
Fig. 1 8 Correlations between single indicators of personal and national well-being and playfulness, mood, and sense of hu-mor. White block with black dots=<40 years of age (n=381), black block=<50 (n=378), white block=<60 (n=198), black block with white dots= >60 years (n=41). WB well-being
it has to be noted that the kind of activi-ty is also of relevance. For example, tho-se (elderly) participants who spend mo-re time working or who spent momo-re time using the Internet yielded higher negative mood and were less prone of finding hu-mor in their everyday life.
>
Positive mood
increases with age
The sense of humor scales were general-ly related to positive aspects of life such as optimism (and negatively to pessimism) and to different aspects of well-being [12]. However, these relations were not found in all age groups. A higher sense of hu-mor was related to lowered well-being in the oldest age-group (60–74 years) in our sample. This was mainly reflected in a greater dissatisfaction about indicators of national well-being (e.g., economic sta-tus of the country, its government, or sa-fety of the country). It can only be specu-lated whether the financial crisis that hit countries all over the world had a special impact on the elderly and how this might be related to sense of humor. It might also be speculated how retirement affects the-se relations (e.g., different perspective to-wards society and institutions). However, these results should be replicated with a larger sample. Not only cross-sectional but also longitudinal data would be ne-cessary to obtain a broader picture of the sense of humor among the elderly. Never-theless, this study can be interpreted as a first step in this direction. It also suggests that interventions facilitating the sense of humor such as McGhee’s eight-step pro-gram [5] might be key to improving well-being among the elderly. Two steps in the program are “finding humor in everyday life” and “surrounding oneself with hu-mor.” These two might be of special rele-vance for people who tend to laugh less and less easily!
Conclusion
Data and studies on sense of humor among elderly people are lacking. In this study, neither playfulness nor the sense of humor varied strongly across the lifespan, and positive mood was highest among the oldest participants. A higher sense of
hu-mor score seems to be negatively related to indicators of national well-being among the elderly, and intervention programs for fostering one’s sense of humor might be useful in improving quality of life and sa-tisfaction with life among the elderly.
Corresponding address
Dr. R.T. ProyerSection on Personality and Assessment, Department of Psychology, University of Zurich Binzmühlestr. 14/7, 8050 Zurich, Switzerland
Acknowledgments. The authors are grateful to Fabi-an GFabi-ander Fabi-and Tobias Wyss for their assistFabi-ance in data collection.
Conflict of interest. The corresponding author states that there are no conflicts of interest.
References
1. Craik KH, Ware AP (2007) Humor and personality in everyday life. In: Ruch W (ed) The sense of humor: explorations of a personality characteristic. Mou-ton deGruyter, Berlin, pp 63–94
2. Craik KH, Lampert M, Nelson AJ (1996) Sense of humor and styles of everyday humorous conduct. Humor 9:273–302
3. Cummins RA, Eckersley R, Pallant J et al (2003) De-veloping a national index of subjective wellbeing: the Australian Unity Wellbeing Index. Soc Indic Res 64:159–190
4. Martin RA, Puhlik-Doris P, Larsen G et al (2003) In-dividual differences in uses of humor and their relation to psychological well-being: develop-ment of the humor styles questionnaire. J Res Pers 37:48–75
5. McGhee P (1996) Health, healing and the amuse system: humor as survival training. Kendall/Hunt Publishing Company, Dubuque, IA
6. Renn D, Pfaffenberger N, Platter M et al (2009) In-ternational Well-being Index: the Austrian version. Soc Indic Res 90:243–256
7. Ruch W (ed) (2007) The sense of humor: explora-tions of a personality characteristic. Mouton de-Gruyter, Berlin
8. Ruch W (2008) Psychology of humor. In: Raskin V (ed) A primer of humor. Mouton de Gruyter, Berlin, pp 17–100
9. Ruch W, Carrell A (1998) Trait cheerfulness and the sense of humor. Pers Indiv Differ 24:551–558 10. Ruch W, Köhler G (2007) A temperament approach
to humor. In: Ruch W (ed) The sense of humor: ex-plorations of a personality characteristic. Mouton DeGruyter, Berlin, pp 203–230
11. Ruch W, Köhler G, van Thriel C (1996) Assessing the “humorous temperament”: construction of the facet and standard trait forms of the State-Trait-Cheerfulness-Inventory – STCI. Humor 9:303–339 12. Ruch W, Proyer RT, Müller L (2009) The German
version of the SHS. Unpublished manuscript
13. Ruch W, Proyer RT, Weber (2010) Humor as a cha-racter strength among the elderly: theoretical con-siderations. Z Gerontol Geriatr 1:(this issue) 14. Ruch W, Proyer RT, Weber M (2010) Humor as a
character strength: empirical findings on age-re-lated changes and its contribution to satisfaction with life. Z Gerontol Geriatr 1:(this issue) 15. Sassenrath S (2001) Humor und Lachen als
Stress-bewältigungsstrategie [Humor and laughter as a way of coping with stress]. University of Vienna, Unpublished Masters thesis