HAL Id: halshs-00682949
https://halshs.archives-ouvertes.fr/halshs-00682949
Submitted on 27 Mar 2012
HAL is a multi-disciplinary open access archive for the deposit and dissemination of sci-entific research documents, whether they are pub-lished or not. The documents may come from teaching and research institutions in France or abroad, or from public or private research centers.
L’archive ouverte pluridisciplinaire HAL, est destinée au dépôt et à la diffusion de documents scientifiques de niveau recherche, publiés ou non, émanant des établissements d’enseignement et de recherche français ou étrangers, des laboratoires publics ou privés.
Shipping
César Ducruet, Theo Notteboom
To cite this version:
César Ducruet, Theo Notteboom. Developing Liner Service Networks in Container Shipping. Song, D.W. and Panayides, P. Maritime Logistics: A complete guide to effective shipping and port manage-ment, Kogan Page, pp.77-100, 2012. �halshs-00682949�
CHAPTER 6
Developing Liner Service Networks in Container Shipping
DUCRUET César1
CNRS / UMR 8504 Géographie-Cités 13 rue du Four F-75006 Paris (France) Email address: [email protected]
Phone: +33-140464007 Fax: +33-140464191 NOTTEBOOM Theo
ITMMA / University of Antwerp / Antwerp Maritime Academy Keizerstraat 64, B-2000 Antwerp (Belgium)
Email address: [email protected]
Phone: +32-32655152 Fax: +32-32655150
Abstract
After a brief background about the development of containerization in recent decades, this chapter reviews the current characteristics of liner shipping networks under three main themes. First, it provides an overview of the different service types of shipping lines and dynamics in liner service configuration and design. Second, a global snapshot of the worldwide liner shipping network is proposed by means of vessel movement data. The changing geographic distribution of main inter-port links is explored in the light of recent reconfigurations of liner shipping networks (e.g. multiplication versus rationalisation of port calls). We also discuss the position of seaports in liner shipping networks referring to concepts of centrality, hierarchy, and selection factors. The chapter concludes by elaborating on the interactions and interdependencies between seaport development and liner shipping network development notably under current economic changes.
1. INTRODUCTION: BACKGROUND ON LINER SHIPPING
Container liner shipping has a relatively short history. In 1956 Malcolm McLean launched the first containership Ideal X. Ten years later the first transatlantic container service between the US East Coast and North Europe marked the real start of long distance scheduled container liner services. The first specialized cellular containerships were delivered in 1968. In the 1970s the containerization process expanded rapidly due to the adoption of standard container sizes and the awareness of industry players about the advantages and cost savings containerization brought (Rodrigue and Notteboom, 2009; Levinson, 2006). Although container shipping occupies a relatively minor share of the whole maritime fleet (about 12 per cent), it is the fastest growing sector and currently concentrates more than half of world trade value, regularly expanding to other commodities (e.g. neo bulks).
The world container traffic, the absolute number of containers being carried by sea, increased from 28.7 million TEU in 1990 to 152 million TEU in 2008 or an average annual increase of 9.5 per cent. Worldwide container port throughput increased from 36 million TEU in 1980 and 88 million TEU in 1990 to about 535 million TEU in 2008. A comparison between world container traffic and world container port throughput reveals a container on average was handled (loaded or discharged) 3.5 times between the first port of loading and the last port of discharge in 2008. This figure amounted to 3 in 1990. The rise in the average number of port handlings per box is the result of more complex configurations in liner service networks as will be explained later in this chapter. Furthermore, the centre of gravity of these liner service networks has shifted to Asia. The dominance of Asia is reflected in world container port rankings. In 2009 fourteen of the twenty busiest container ports came from Asia, mainly from China. In the mid 1980s there were only six Asian ports in the top 20, mainly Japanese load centres. The emerging worldwide container shipping networks helped to reshape global supply chain practices and supported the globalization in production and consumption. New supply chain practices in turn increased the requirements on container shipping service networks in terms of frequency, schedule reliability/integrity, global coverage of services and rate setting.
This chapter analyses liner service networks as configured by container shipping lines. In a first section we discuss the drivers of and decision variables in liner service design as well as the different liner service types. Next, the chapter provides a global snapshot of the worldwide
liner shipping network based on vessel movement data. The changing geographic distribution of main inter-port links is explored in the light of recent reconfigurations of liner shipping networks. Third, we zoom in on the position of seaports in liner shipping networks referring to concepts of centrality, hierarchy, and selection factors. The chapter concludes by elaborating on the interactions and interdependencies between seaport development and liner shipping network development notably under current economic changes.
2. CONFIGURATION AND DESIGN OF LINER SHIPPING SERVICES
2.1. The configuration of liner shipping services and networks
Liner shipping networks are developed to meet the growing demand in global supply chains in terms of frequency, direct accessibility and transit times. Expansion of traffic has to be covered either by increasing the number of strings operated, or by vessel upsizing, or both. As such, increased cargo availability has triggered changes in vessel size, liner service schedules and in the structure of liner shipping.
When designing their networks, shipping lines implicitly have to make a trade-off between the requirements of the customers and operational cost considerations. A higher demand for service segmentation adds to the growing complexity of the networks. Shippers demand direct services between their preferred ports of loading and discharge. The demand side thus exerts a strong pressure on the service schedules, port rotations and feeder linkages. Shipping lines, however, have to design their liner services and networks in order to optimize ship utilization and benefit the most from scale economies in vessel size. Their objective is to optimize their shipping networks by rationalizing coverage of ports, shipping routes and transit time (Zohil and Prijon, 1999; Lirn et al., 2004). Shipping lines may direct flows along paths that are optimal for the system, with the lowest cost for the entire network being achieved by indirect routing via hubs and the amalgamation of flows. However, the more efficient the network from the carrier’s point of view, the less convenient that network could be for shippers’ needs (Notteboom, 2006).
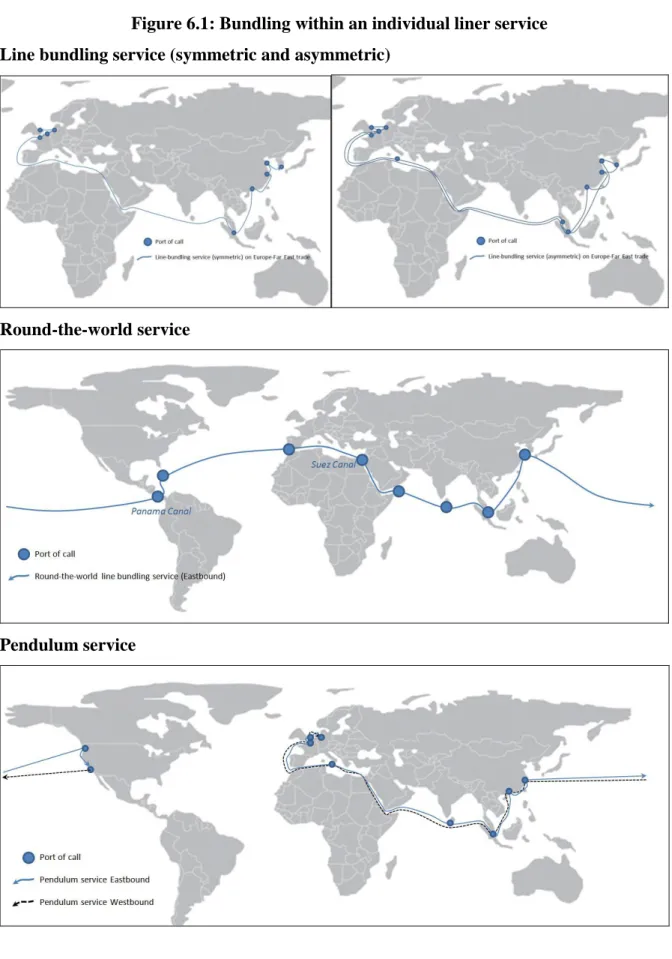
Bundling is one of the key drivers of container service network dynamics. The bundling of container cargo can take place at two levels: (1) bundling within an individual liner service and (2) bundling by combining/linking two or more liner services.
[ Insert Figure 6.1 about here ]
The objective of bundling within an individual liner service is to collect container cargo by calling at various ports along the route instead of focusing on an end-to-end service. Such a line bundling service is conceived as a set of x roundtrips of y vessels each with a similar calling pattern in terms of the order of port calls and time intervals (i.e. frequency) between two consecutive port calls. By the overlay of these x roundtrips, shipping lines can offer a desired calling frequency in each of the ports of call of the loop (Notteboom, 2006). Line bundling operations can be symmetric (i.e. same ports of call for both sailing directions) or asymmetric (i.e. different ports of call on the way back), see Figure 1. Most liner services are line bundling itineraries connecting between two and five ports of call scheduled in each of the main markets. The Europe–Far East trade provides a good example. Most mainline operators and alliances running services from the Far East to North Europe stick to line bundling itineraries with direct calls scheduled in each of the main markets. Notwithstanding diversity in calling patterns on the observed routes, carriers select up to five regional ports of call per loop. Shipping lines have significantly increased average vessel sizes deployed on the route from around 4500 TEU in 2000 to over 8000 TEU in early 2011. These scale increases in vessel size have put a downward pressure on the average number of European port calls per loop on the Far East–North Europe trade: 4.9 ports of call in 1989, 3.84 in 1998, 3.77 in October 2000, 3.68 in February 2006, and 3.35 in December 2009. Two extreme forms of line bundling are round-the-world services and pendulum services.
[ Insert Figure 6.2 about here ]
The second possibility is to bundle container cargo by combining/linking two or more liner services. The three main bundling options in this category include a hub-and-spoke network (hub/feeder), interlining and relay (Figure 2). The establishment of global networks has given rise to hub port development at the crossing points of trade lanes. Intermediate hubs emerged since the mid-1990s within many global port systems: Freeport (Bahamas), Salalah (Oman), Tanjung Pelepas (Malaysia), Gioia Tauro, Algeciras, Taranto, Cagliari, Damietta and Malta in
the Mediterranean, to name but a few. The role of intermediate hubs in maritime hub-and-spoke systems has been discussed extensively in recent literature (see for instance Baird, 2006; Fagerholt, 2004; Guy, 2003; McCalla et al., 2005). The hubs have a range of common characteristics in terms of nautical accessibility, proximity to main shipping lanes and ownership, in whole or in part, by carriers or multinational terminal operators. Most of these intermediate hubs are located along the global beltway or equatorial round-the-world route (i.e. the Caribbean, Southeast and East Asia, the Middle East and the Mediterranean). These nodes multiply shipping options and improve connectivity within the network through their pivotal role in regional hub-and-spoke networks and in cargo relay and interlining operations between the carriers’ east-west services and other inter- and intra-regional services. Container ports in Northern Europe, North America and mainland China mainly act as gateways to the respective hinterlands.
Two developments undermine the position of pure transhipment/interlining hubs (Rodrigue and Notteboom, 2010). First of all, the insertion of hubs often represents a temporary phase in connecting a region to global shipping networks. Hub-and-spoke networks would allow considerable economies of scale of equipment, but the cost efficiency of larger ships might be not sufficient to offset the extra feeder costs and container lift charges involved. Once traffic volumes for the gateway ports are sufficient, hubs are bypassed and become redundant (see also Wilmsmeier and Notteboom, 2010). Secondly, transhipment cargo can easily be moved to new hub terminals that emerge along the long distance shipping lanes. The combination of these factors makes that seaports which are able to combine a transhipment function with gateway cargo obtain a less vulnerable and thus more sustainable position in shipping networks.
In channelling gateway and transhipment flows through their shipping networks, container carriers aim for control over key terminals in the network. Decisions on the desired port hierarchy are guided by strategic, commercial and operational considerations. Shipping lines rarely opt for the same port hierarchy in the sense that a terminal can be a regional hub for one shipping line and a secondary feeder port for another operator. For example, Antwerp in Belgium and Valencia in Spain are some of the main European hubs for Mediterranean Shipping Company (MSC) while they receive only few vessels from Maersk Line. Zeebrugge and Algeciras are among the primary European ports of call in the service network of Maersk Line while these container ports are rather insignificant in the network of MSC.
The liner service configurations in Figures 1 and 2 are often combined to form complex multi-layer networks. The advantages of complex bundling are higher load factors and/or the use of larger vessels in terms of TEU capacity and/or higher frequencies and/or more destinations served. Container service operators have to make a trade-off between frequency and volume on the trunk lines: smaller vessels allow meeting the shippers’ demand for high frequencies and lower transit times, while larger units will allow operators to benefit from economies of vessel scale. The main disadvantages of complex bundling networks are the need for extra container handling at intermediate terminals and longer transport times and distances. Both elements incur additional costs and as such could counterbalance the cost advantages linked to higher load factors or the use of larger unit capacities. Some have suggested that the most efficient east/west pattern is the equatorial round-the-world, following the beltway of the world (e.g. Ashar, 2002 and De Monie, 1997). This service pattern focuses on a hub-and-spoke system of ports that allows shipping lines to provide a global grid of east/west, north/south and regional services. The large ships on the east/west routes will call mainly at transhipment hubs where containers will be shifted to multi-layered feeder subsystems serving north/south, diagonal and regional routes. Some boxes in such a system would undergo as many as four transhipments before reaching the final port of discharge. The global grid would allow shipping lines to cope with the changes of trade flows as it combines all different routes in a network.
Existing liner shipping networks feature a great diversity in types of liner services and a great complexity in the way end-to-end services, line bundling services and transhipment/relay/interlining operations are connected to form extensive shipping networks. Maersk Line, MSC and CMA-CGM operate truly global liner service networks, with a strong presence also on secondary routes. Especially Maersk Line has created a balanced global coverage of liner services. The networks of CMA-CGM and MSC differ from the general scheme of traffic circulation through a network of specific hubs (many of these hubs are not among the world’s biggest container ports) and a more selective serving of secondary markets such as Africa (strong presence by MSC), the Caribbean and the East Mediterranean. Notwithstanding the demand pull for global services, a large number of individual carriers remains regionally based. Asian carriers such as APL, Hanjin, NYK, China Shipping and HMM mainly focus on intra-Asian trade, transpacific trade and the Europe – Far East route, partly because of their huge dependence on export flows generated by the respective Asian home bases. MOL and Evergreen are among the few exceptions frequenting secondary routes
such as Africa and South America. Profound differences exist in service network design among shipping lines. Some carriers have clearly opted for a true global coverage, others are somewhat stuck in a triad-based service network forcing them to develop a strong focus on cost bases. Alliance structures (cf. Grand Alliance, New World Alliance, and CYKH) provide its members easy access to more loops or services with relatively low-cost implications and allow them to share terminals.
2.2. The process of designing a liner service
Figure 3 summarizes the liner service design process. Before an operator can start with the actual design of a regular container service, he will have to analyse the targeted trade route(s). The analysis should include elements related to the supply, demand and market profile of the trade route. Key considerations on the supply side include vessel capacity deployment and ulitzation, vessel size distribution, the configuration of existing liner services, the existing market structure and the port call patterns of existing operators. At the demand side, container lines focus on the characteristics of the market to be served, the geographical cargo distribution, seasonality and cargo imbalances. The interaction between demand and supply on the trade route considered results in specific freight rate fluctuations and the overall earning potential on the trade.
[ Insert Figure 6.3 about here ]
The ultimate goal of the market analysis is not only to estimate the potential cargo demand for a new liner service, but also to estimate the volatility, geographical dispersion and seasonality of such demand. These factors will eventually affect the earning potential of the new service. Once the market potential for a new service has been determined, the service planners need to take decisions on several inter-related core design variables. These design variables are indicated in dark gray/shaded boxes in Figure 3 and mainly concern (1) the liner service type, (2) the number and order of port calls in combination with the actual port selection process, (3) vessel speed, (4) frequency and (5) vessel size and fleet mix.
The array of liner service types and bundling options available to shipping lines was discussed in the previous section.
Limiting the number of port calls shortens round voyage time and increases the number of round trips per year, thereby minimizing the number of vessels required for that specific liner service. However, fewer ports of call mean poorer access to more cargo catchment areas. Adding port calls can generate additional revenue if the additional costs from added calls are offset by revenue growth. The actual port selection is a complex issue. Traffic flows through ports are a physical outcome of route and port selection by the relevant actors in the chain. The most relevant service-related and cost factors explaining port selection by the main players of the transport chain (e.g. shippers, ocean carriers, and forwarders) are identified in the scientific literature on port choice, see e.g. Murphy et al.(1992), Murphy and Daley (1994), Malchow and Kanafani (2001), Tiwari et al. (2003), Nir et al. (2003), Chou et al. (2003), Song and Yeo (2004), Guy and Urli (2006) and Wiegmans et al. (2008). Port choice has increasingly become a function of the overall network cost and performance. Figure 3 incorporates the approach of Notteboom (2009) to group port selection factors together in the demand profile of the port, the supply profile of the port, and the market profile of the port. Human behavioural aspects might impede carriers from achieving an optimal network configuration. Incorrect or incomplete information results in bounded rationality in carriers’ network design, leading to sub-optimal decisions. Shippers sometimes impose bounded rational behaviour on shipping lines, e.g. in case the shipper asks to call at a specific port. Wiegmans et al. (2008) argue that port selection by shipping lines can also be heavily influenced by the balance of power among the shipping lines of the same strategic alliance, or the carrier’s objective to make efficient use of its dedicated terminal capacity in specific ports.
The choice of vessel speed is mainly affected by the technical specifications of the vessel deployed (i.e. the design speed), the bunker price (see Notteboom and Vernimmen, 2009), environmental considerations (e.g. reduction of CO2 through slow steaming) and the capacity situation in the market (i.e. slow steaming can absorb some of the vessel overcapacity in the market, see e.g. Cariou and Notteboom, 2011 and Notteboom et al., 2010).
The number and order of port calls, the total two-way sailing distance and the vessel speed are the main determinants of the total vessel roundtrip time. The theoretical/optimal roundtrip time will seldomly be achieved in practice due to delays along the route and in ports giving rise to schedule reliability problems. Low schedule integrities can have many causes ranging from weather conditions, delays in the access to ports (pilotage, towage, locks, tides) to port terminal congestion or even security considerations (Notteboom, 2006). A shipping line can
insert time buffers in the liner service to cope with the chance of delays. Time buffers reduce schedule unreliability, but increase the vessel roundtrip time.
When it comes to the service frequency, carriers typically aim for a weekly service. The service frequency and the total vessel roundtrip time determine the number of vessels required for the liner service. Carriers have to secure enough vessels to guarantee the desired frequency. Given the number of vessels needed and the anticipated cargo volume for the liner service, the shipping line can then make a decision on the optimal vessel size and fleet mix. As economies of vessel size are more significant on longer distances, the biggest vessels are typically deployed on long and cargo-rich routes.
Decisions on all of the above key design variables will lead to a specific slot capacity offered by the new liner service. The resulting slot capacity should be in line with the actual demand as to maximize average vessel utilization (given expected traffic imbalances, cargo dispersion patterns and cargo seasonality and volatility).
3. SHIPPING ROUTES, NETWORK PATTERNS, AND PORT CENTRALITY
The aforementioned services altogether form a global maritime network within which local, regional and global links among ports become interconnected through the establishment of hub, interlining and relay ports.
3.1 The distribution of container flows
The weight and growth of major trade routes measured in TEUs provides evidence about the imbalanced structure of the global liner shipping network based on the offer of services (Table 1). Their distribution confirms the predominance of the Europe-Asia link both in terms of weight and growth, closely followed by Asia-USA but with lower growth, while other links lag far behind in terms of the capacity deployed. This confirms the study by Frémont and Soppé (2005) of the global container shipping network through the mapping of the top shipping lines’ service offers among world regions. They explain the dominance of Asia by the role of the Newly Industrialised Countries (NICs) that provide consumers goods to industrialized countries, thus intensifying trans-Pacific flows at the expense of transatlantic
flows. They also calculated that in 2002, such relations among the main economic poles of the “Triade” concentrated about 67 per cent of total service capacity, 22 per cent only remaining for North-South relations with these poles, and South-South relations being negligible in size.
[ Insert Table 6.1 about here ]
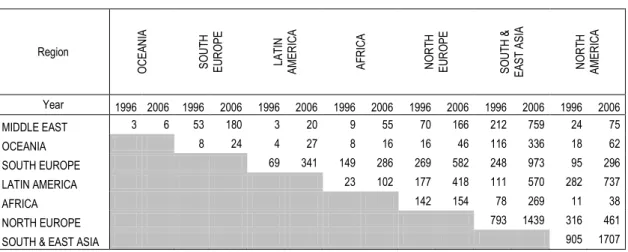
A more precise method for measuring the weight of links is to trace the worldwide circulation of container vessels (Table 2). Each time a vessel calls at one port, its capacity (in deadweight tonnage, DWT) is added to the port and to the inter-port link. The yearly total is thus an expression of the frequency and capacity of the links formed on various levels (i.e. ports, regions, continents) in an origin-destination matrix. One important aspect of the methodology is to have considered all ports of the same vessel voyage being interconnected, should they be or not adjacent calls in the sequence. This allows for a better view of the distribution of links and traffics.
The polarizing role of Asia appears even more explicitly, since most regions have their largest flow link directed to it at both years (Middle East, Oceania, North Europe, North America), or only in 2006 (Africa, South Europe, Latin America). In fact the latter regions have shifted their main traffic flow from North Europe, North America and South Europe respectively (in 1996) to Asia (in 2006), thereby illustrating the continuous influence of Asia on world trade patterns. Links can also be differentiated by their traffic growth rate in a descending order, confirming the faster growth of South-South linkages versus North-North and North-South linkages (albeit in smaller volumes than main routes):
Very fast growth (over 500 per cent): Latin America-Oceania, Latin America-Middle East, and Middle
East-Africa;
Fast growth (over 250 per cent): Latin America-South Europe, Latin America-Africa, Latin America-South
& East Asia, South Europe-South & East Asia, South & East Asia-Middle East;
Significant growth (over 100 per cent): South Middle East, South Oceania, North
Europe-all regions, South & East Asia-Oceania, South & East Asia-North Europe, North America-Europe-all regions;
Moderate growth (100 per cent or less): Africa-Oceania, Oceania-Middle East, Africa-South Europe, North
America-South & East Asia, South & East Asia-North Europe, North America-North Europe.
The importance of intra-regional traffic is estimated based on the sequences of calls that are internal or external to LMIU regions. Such distinction provides a rough estimate on the extent to which different regions have different shipping dynamics. The intensity of intra-regional traffic in total traffic (Table 3) can be explained by various factors such as coastal morphology, the presence of hub ports, and the level of trade integration within the region. For instance, the low share of Africa and the Middle East in 1996 clearly reflects the lack of internal cohesion and integration, but the figure has changed dramatically in 2006, due to greater interdependency among regional ports. Shipping networks are thus a good revelatory of trade and regionalization dynamics (Lemarchand and Joly, 2009). Regions with high internal connectivity through the extensive use of hub-and-feeder systems often have a high share of intra-regional traffic, such as Asia and North Europe, but also Latin America, which includes the Caribbean port system, whereas for North America, it is more the increase of multiple calls along East and West coasts, notably with the shift of major container traffic and intermodal facilities to the Southeast (e.g. Hampton Roads, Jacksonville, Miami).
[ Insert Table 6.3 about here ]
3.2 Topology and the role of distance
Although maritime transport does not use an infrastructure of tracks like in road or rail transport, Ducruet and Notteboom (2011) calculated that the overall length of the network using orthodromic distance doubled between 1996 and 2006, from five to ten million kilometres. The length of the longest inter-port link has remained constant (10,000 km) but the average length has slightly increased from 1,000 to 1,200 km, as well as the traffic density from 331 to 407 TEU per kilometre. Such evidences validate the fact that shipping networks have constantly expanded geographically during this period.
In addition to these results, Ducruet and Notteboom (2011) also underline the influence of distance on traffic concentration. They show that most traffic occurs across relatively short distances: about 80 per cent of total worldwide traffic concentrates over direct links of 500 km or less, while links of 100 km or less support more than half. Besides the influence of coastal morphology and the necessity following successive calls in relative proximity, such figures can be explained by some local service configurations, as in the case of adjacent seaports serving shared hinterlands (e.g. Le Havre-Hamburg range) or acting as dual hubs (e.g. Busan
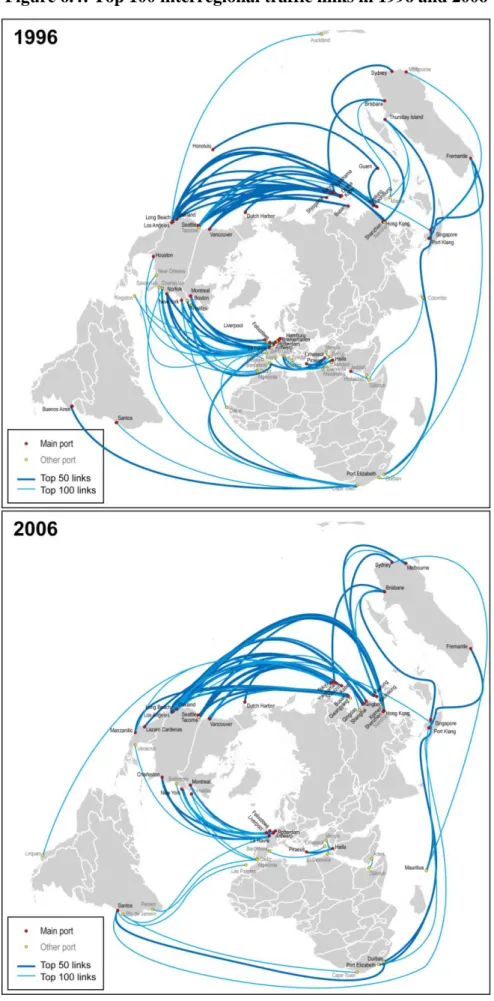
and Gwangyang), which often receive multiple calls for the same vessels or liner services. The noticeable increase of the longest links can be explained by stronger trans-Pacific ties and also by rapid technological progress in the shipping industry, allowing longer sailing distances between two ports: links of over 5,000 km concentrate 7 per cent and 10 per cent of worldwide traffic in 1996 and 2006 respectively. Overall, it could be calculated that the top 100 direct inter-port links in terms of traffic volume represent no less than 52 per cent and 39 per cent of worldwide container traffic in 1996 and 2006, respectively, thus confirming a trend of de-concentration due to the multiplication of links. The spatial distribution of these top links also shows the dominance of intra-regional relations, with the exception of trans-Pacific links. The maps in Figure 6.4 retain only interregional inter-port (direct) links based on the definition of large world regions by the United Nations (i.e. Europe, Americas, Asia, Oceania, and Africa). We clearly observe a reduction and simplification of transatlantic and trans-Mediterranean links together with the appearance of new links in the top 100 such as Europe-Brazil links and Asia-Mexico links. There is, however, also some continuity, since Le Havre - New York is the heaviest direct link connecting Europe with the world in both years, and Trans-Pacific links remain at centre stage, but with a shift of main links from Japanese to Chinese ports.
[Insert Figure 6.4 about here]
The extent to which the strategies of shipping lines are reflected in the topological structure of the network can also be verified by applying some measures from graph theory and complex networks. On a world level, Hu and Zhu (2009) were the first to confirm that container shipping networks belong to the category of so-called “scale-free” and “small-world” networks, i.e. where a limited number of nodes have the majority of links, the latter’s frequency being distributed along a power-law, and with high cluster densities among smaller nodes outside hubs. Although Kaluza et al. (2010) contradict Deng et al. (2009) about the extent to which the global maritime network is more or less “efficient” (i.e. low average number of stops between two nodes) than other transport networks such as airlines, Ducruet and Notteboom (2010) underlined an increase in efficiency between 1996 and 2006, which is attributed to the expansion of the network as well as to the emergence of new hub ports. Another important trend topologically speaking is the decreasing hierarchical structure of the network, as observed by Ducruet and Notteboom (2010) on a world level and by Ducruet et al. (2010a, 2010b) in Northeast Asia and the Atlantic regions. Such trend results from the
combination of various factors such as regional integration processes (multiplication of intraregional links, opening of new direct call and multi-port services), diseconomies of scale in large gateway and hub ports, and competition between existing and emerging hub ports.
3.3 The centrality of container ports
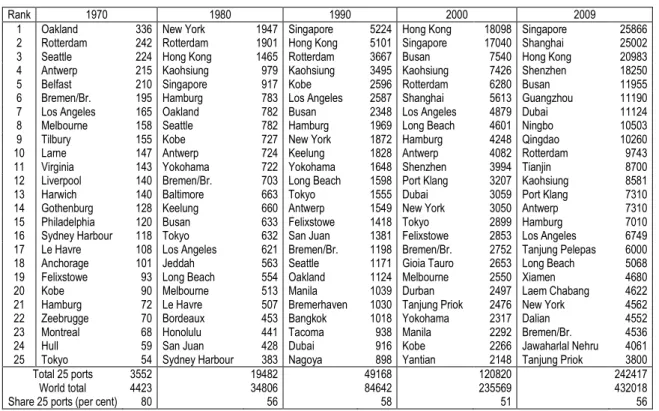
The impact of liner shipping network’s operation on container ports is often analysed in terms of throughput, the most widely available indicator of port performance in official statistics. Table 4 shows the classic port hierarchy with regard to the number of containers (TEUs) handled by top ports since the 1970s, regardless of the function of ports in the network. However, the network perspective allows for calculating the connectivity of ports, which is critically lacking in the related literature (De Langen et al., 2007). Two main measures of centrality in networks can be obtained based on the configuration of inter-port links in a binary port-to-port matrix (i.e. presence or absence of links between two given ports). First, betweenness centrality counts the number of positions of a node on possible shortest paths among all nodes in the entire network (Ducruet and Rodrigue, 2011). It is a measure of accessibility or reachability. Second, degree centrality is the number of adjacent neighbours, which simply counts the number of ports connected to a given port. These are two very classic measures in network analysis across all fields of investigation from physics to sociology (Wasserman and Faust, 1994), which can provide answers to theoretical configurations notably provided by Fleming and Hayuth (1994) on the centrality and intermediacy of transportation hubs. When it comes to ports, these measures can reveal other dimensions than sole throughput, with which they can be highly correlated.
[ Insert Table 6.4 about here ]
A first look at the top 25 central ports in the worldwide network provides some evidence about the usefulness of the measures and how they characterize the position of ports in the network. Unlike airline networks where anomalous centralities depict the peculiar position of very central airports (betweenness) with few direct connections (degree) (Guimera et al., 2005), liner shipping shows a good fit between betweenness and degree (Deng et al., 2009). Thus, very central ports in the entire liner shipping network are also those multiplying their connections towards other ports. This would mean that hub ports have many connections while being very central, unlike relay hubs in airline networks (e.g. Anchorage). Some
exceptions, however, are visible in the results about ports, in light of the overall drop in the linear correlation among betweenness and degree from 0.84 in 1996 to 0.72 in 2006. This change suggests a more complex relationship between the two variables. Indeed in 2006, the peculiar position of some ports having less degree than betweenness appears with Surabaya and Miami. Those ports thus tend to have a role as regional hubs, with fewer connections to local ports that are not well connected to the rest of the network, and have no option but to go through Surabaya and Miami, such as several Indonesian and Caribbean ports. Surabaya and Miami thus benefit from their bridge position towards such smaller ports to raise their centrality in the global network. Such trend is also visible in the work of Ducruet et al. (2009) showing how Busan has increased its centrality within Northeast Asia but has simultaneously seen its centrality lowering in the worldwide network.
[ Insert Table 6.5 about here ]
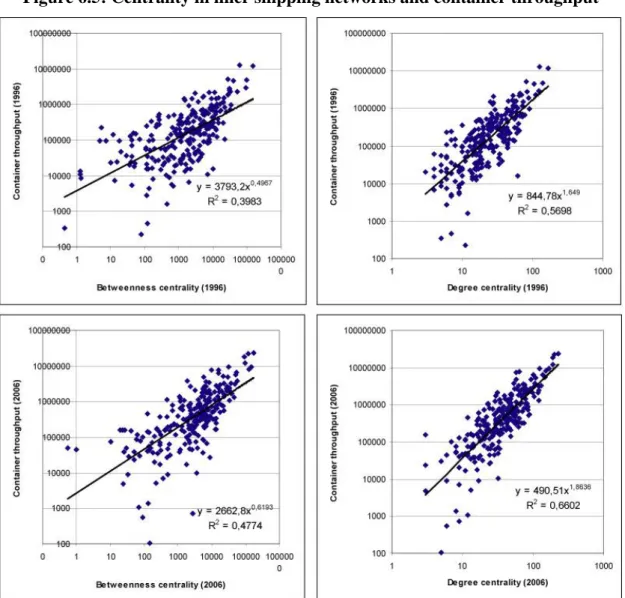
The extent to which network position relates with the hierarchy of container throughput is a crucial question that can be tested in Figure 5. Interestingly, the correlation with betweenness and with degree has increased between 1996 and 2006, showing a better fit with container throughput. In terms of variance, betweenness centrality explains 40 per cent and 47 per cent of total throughput, while degree centrality explains 57 per cent and 66 per cent at respective years. This would suggest that network indicators are very good tools for understanding overall port performance, although they do not include land-based dimensions of hinterland connectivity, coverage, and other aspects of performance such as technical standards and the availability, quality, size, and cost of terminal handling facilities and services. Overall, betweenness is less related with throughput than is degree, with regard to correlation levels and to the slope of the power-law line. Degree centrality scales superlinearly with throughput, which means that the number of connections is highly concentrated at large throughput ports. At the top of the hierarchy, large gateway ports such as Shenzhen and Yokohama may have less betweenness centrality than transhipment hubs, while ports combining both functions (cf. section 2.1) may rank high in the three indicators. Further analyses may better explain the role of network position on throughput performance as empirically tested by Ducruet et al. (2011). Overall, the position of ports in shipping networks seems to explain a large part of their overall activity.
5. CONCLUSIONS
The extensive worldwide container shipping networks are key to globalization and global supply chains. The requirements on container shipping service networks have tightened in terms of frequency, schedule reliability/integrity, global coverage of services and rate setting. The evolutionary path of liner shipping networks and port operations is characterised by drastic changes as well as permanencies. Shipping lines have embraced a wide range of bundling concepts and liner service configurations to drive container service network dynamics. As global trade expands in economical and geographic terms, despite difficult conjunctures such as the global financial crisis, new ports and new shipping networks are regularly created to cope with demand. Shipping lines logically adapt to such trends as well as influence them, sometimes by refining their services through rationalization or by creating new service configurations through a combination of line bundling itineraries and transhipment/relay/interlining operations at pivotal ports of the network.
This chapter provided evidence about the increasing complexity and number of cargo movements that occurs in parallel with increased concentration and polarisation, depending on the measures and methodologies applied for revealing such trends. It discussed some fundamental aspects, such as the economic and geographic dimension of the variety of services offered by the industry, as well as the strong and growing interdependency between maritime centrality and port throughput for container ports, although in this simple equation, hinterland connectivity and port efficiency are not included. Looking at the distribution of main trading routes as well as disaggregated interregional and inter-port shipping links, the latter being compared with kilometric distance, we observed that the overall network is growing in size and length notably thanks to a catching-up of South-South linkages versus North-North and North-South linkages. However, most worldwide traffic still concentrates over very short distances, that is more specific to maritime transport than to air transport due to adjacent calls between ports.
In light of our results, further research on container shipping networks should go deeper in the analysis of the causal relationship between throughput and centrality for container ports, while better identifying specific cases and outliers. Another avenue of future research would be to test the impact of the global financial crisis on the overall structure of regional and global
liner shipping networks, as well as on the position of individual container ports, which would complement the classic view of shipping based on aggregated cargo flows among major trade routes. The global database on vessel movements is being expanded to other years and other types of vessels so as to better appreciate the linkages between port hierarchy, global/regional trade patterns, and the evolution of network structure. Last but not least, the analysis of the situation of ports and cities within combined maritime and land-based networks would prove helpful for the study of logistics chains, the hinterland-foreland continuum, intermodal transport systems, and port competitiveness.
REFERENCES
Ashar, A (2002) Revolution Now, Containerisation International, January
Baird, A (2006) Optimising the container transshipment hub location in northern Europe, Journal of Transport Geography, 14 (3), pp 195–214
Cariou, P and Notteboom, T (2011) Bunker costs in container liner shipping: are slow steaming practices reflected in maritime fuel surcharges?, in Current Issues in Shipping, Ports and Logistics, ed T Notteboom, pp 69–82, UPA, Brussels
Chou, CC, Chu, CW and Liang, GS (2003) Comparison of two models for port choice, Maritime Quarterly, 12 (3), pp 45–62
De Langen, PW, Nijdam, M and Van der Horst, MR (2007) New indicators to measure port performance, Journal of Maritime Research, 4 (1), pp 23–6
De Monie, G (1997) The global economy, very large containerships and the funding of mega-hubs, Port Finance Conference, London
Deng, WB, Long, G, Wei, L and Xu, C (2009) Worldwide marine transportation network: Efficiency and container throughput, Chinese Physics Letters, 26 (11), pp 118901
Ducruet, C, Lee, SW and Ng, KYA (2010a) Centrality and vulnerability in liner shipping networks: Revisiting the Northeast Asian port hierarchy, Maritime Policy and Management, 37 (1), pp 17–36
Ducruet, C, Lee, SW and Roussin, S (2009) Local strength and global weakness: A maritime network perspective on South Korea as Northeast Asia's logistics hub, International Journal of Maritime Affairs and Fisheries, 1 (1), pp 32–50
Ducruet, C, Lee, SW and Song, JM (2011) Network position and throughput performance of seaports, in: Current Issues in Shipping, Ports and Logistics, ed T Notteboom, pp 189–201, UPA, Brussels
Spatial structure and regional dynamics, Global Networks (forthcoming)
Ducruet, C, Rodrigue, JP (2011) Graph theory: Measures and indices, in The Geography of Transport Systems, ed JP Rodrigue et al., Hofstra University, Department of Global Studies & Geography, http://people.hofstra.edu/geotrans/eng/ch1en/meth1en/ch1m3en.html
Ducruet, C, Rozenblat, C and Zaidi, F (2010b) Ports in multi-level maritime networks: Evidence from the Atlantic (1996-2006), Journal of Transport Geography, 18 (4), pp 508–18 Fagerholt, K (2004) Designing optimal routes in a liner shipping problem, Maritime Policy and Management, 31 (4), pp 259–68
Fleming, DK and Hayuth, Y (1994) Spatial characteristics of transportation hubs: Centrality and intermediacy, Journal of Transport Geography, 2 (1), pp 3–18
Frémont, A and Soppé, M (2005) Transport maritime conteneurisé et mondialisation, Annales de Géographie, 642, pp 187–200
Guimerà, R, Mossa, S, Turtschi, A and Amaral, LAN (2005) The worldwide air transportation network: anomalous centrality, community structure, and cities’ global roles, Proceedings of the National Academy of Sciences, 102 (22), pp 7794–99
Guy, E (2003) Shipping line networks and the integration of South America trades, Maritime Policy and Management, 30 (3), pp 231–42
Guy, E and Urli, B (2006) Port selection and multicriteria analysis: An application to the Montreal-New York alternative, Maritime Economics and Logistics, 8, 169–86
Hu, Y and Zhu, D (2009) Empirical analysis of the worldwide maritime transportation network, Physica A, 388 (10), pp 2061–71
Kaluza, P, Kölzsch, A, Gastner, MT and Blasius, B (2010) The complex network of global cargo ship movements, Journal of the Royal Society Interface, 7 (48), pp 1093-1103
Lemarchand, A and Joly, O (2009) Regional integration and maritime range, in Ports in Proximity: Competition and Coordination Among Adjacent Seaports, eds T Notteboom, C Ducruet and PW De Langen, Ashgate, Aldershot, pp 87–98
Levinson, M (2006) The Box: How the Shipping Container Made the World Smaller and the World Economy Bigger, Princeton University Press, Princeton
Lirn, TC, Thanopoulou, HA, Beynon, MJ and Beresford, AKC (2004) An application of AHP on transshipment port selection: a global perspective, Maritime Economics and Logistics, 6, pp 70–91
Malchow, M and Kanafani, A (2001) A disaggregate analysis of factors influencing port selection, Maritime Policy and Management, 28 (3), pp 265–77
McCalla, R, Slack, B and Comtois, C (2005) The Caribbean basin: adjusting to global trends in containerization, Maritime Policy and Management, 32 (3), pp 245–61
Murphy, P, Daley, J and Dalenberg, D (1992) Port selection criteria: An application of a transportation research framework, Logistics and Transportation Review, 28, pp 237–55 Murphy, P and Daley, J (1994) A comparative analysis of port selection factors, Transportation Journal, 3, pp 15–21
Nir, AS, Kuang, L and Gin-Shun, L (2003) Port choice behaviour - from the perspective of the shipper, Maritime Policy and Management, 30 (2), pp 165–73
Notteboom, T (2006) The time factor in liner shipping services, Maritime Economics and Logistics, 8 (1), pp 19–39
Notteboom, T (2009) Complementarity and substitutability among adjacent gateway ports, Environment and Planning A, 41 (3), pp 743–62
Notteboom, T and Vernimmen, B (2009) The effect of high fuel costs on liner service configuration in container shipping, Journal of Transport Geography, 17 (5), 325–37
Notteboom, T, Rodrigue, JP and De Monie, G (2010) The organizational and geographical ramifications of the 2008-09 financial crisis on the maritime shipping and port industries, in Integrating Seaports and Trade Corridors, eds P Hall, R McCalla, C Comtois and B Slack, Ashgate, Aldershot, pp 31–46
Rodrigue, JP and Notteboom, T (2009) The future of containerization: perspectives from maritime and inland freight distribution, Geojournal, 74, pp 7–22
Rodrigue, JP and Notteboom, T (2010) Foreland-based regionalization: integrating intermediate hubs with port hinterlands, Research in Transportation Economics, 27, pp 19-29 Song, DW and Yeo, KT (2004) A competitive analysis of Chinese container ports using the analytic hierarchy process, Maritime Economics and Logistics, 6, pp 34–52
Tiwari, P, Itoh, H and Doi, M (2003) Shippers’ port and carrier selection behavior in China: A discrete choice analysis, Maritime Economics and Logistics, 5, pp 23–39
Wasserman, S and Faust, K (1994) Social Network Analysis. Methods and Applications, Cambridge University Press, Cambridge
Wiegmans, B, Van Der Hoest, A and Notteboom, T (2008) Port and terminal selection by deep-sea container operators, Maritime Policy and Management, 35 (6), pp 517–34
Wilmsmeier, G and Notteboom, T (2010) Determinants of liner shipping network configuration: a two region comparison, GeoJournal, in press, doi:10.1007/s10708-009-9333-2
Zohil, J and Prijon, M (1999) The MED rule: the interdependence of container throughput and transshipment volumes in the Mediterranean ports, Maritime Policy and Management, 26 (2), pp 175–93
Table 6.1: World’s major trade routes in 2007
Main route
Transpacific Europe-Asia Transatlantic Asia-USA USA-Asia Asia-Europe Europe-Asia USA-Europe Europe-USA Cargo flows
(million TEUs) 15.4 4.9 17.7 10.0 2.7 4.5 Growth
2006-2007 (per cent) 2.8 3.0 15.5 9.0 7.3 1.6
Source: Containerisation International
Table 6.2: Distribution of interregional flows in 1996 and 2006 (million DWT)
Region O C EA N IA SO U TH EU R O PE LA TI N AM ER IC A AF R IC A N O R TH EU R O PE SO U TH & EA ST A SI A N O R TH AM ER IC A Year 1996 2006 1996 2006 1996 2006 1996 2006 1996 2006 1996 2006 1996 2006 MIDDLE EAST 3 6 53 180 3 20 9 55 70 166 212 759 24 75 OCEANIA 8 24 4 27 8 16 16 46 116 336 18 62 SOUTH EUROPE 69 341 149 286 269 582 248 973 95 296 LATIN AMERICA 23 102 177 418 111 570 282 737 AFRICA 142 154 78 269 11 38 NORTH EUROPE 793 1439 316 461
SOUTH & EAST ASIA 905 1707
Source: own elaboration based on LMIU data
N.B. calculated based on direct and indirect calls between regions
Table 6.3: Share of intraregional traffic in total regional traffic (per cent DWT)
Region 1996 2006
SOUTH & EAST ASIA 69.8 70.6 OCEANIA 49.8 53.9 LATIN AMERICA 59.1 57.1 NORTH EUROPE 48.4 52.2 World average 46.7 48.6 AFRICA 34.7 46.5 SOUTH EUROPE 47.1 43.2 MIDDLE EAST 32.4 33.3 NORTH AMERICA 32.2 32.1 Source: own elaboration based on LMIU data
Table 6.4: Top 20 container ports 1970-2009 (000s TEUs)
Rank 1970 1980 1990 2000 2009
1 Oakland 336 New York 1947 Singapore 5224 Hong Kong 18098 Singapore 25866 2 Rotterdam 242 Rotterdam 1901 Hong Kong 5101 Singapore 17040 Shanghai 25002 3 Seattle 224 Hong Kong 1465 Rotterdam 3667 Busan 7540 Hong Kong 20983 4 Antwerp 215 Kaohsiung 979 Kaohsiung 3495 Kaohsiung 7426 Shenzhen 18250 5 Belfast 210 Singapore 917 Kobe 2596 Rotterdam 6280 Busan 11955 6 Bremen/Br. 195 Hamburg 783 Los Angeles 2587 Shanghai 5613 Guangzhou 11190 7 Los Angeles 165 Oakland 782 Busan 2348 Los Angeles 4879 Dubai 11124 8 Melbourne 158 Seattle 782 Hamburg 1969 Long Beach 4601 Ningbo 10503 9 Tilbury 155 Kobe 727 New York 1872 Hamburg 4248 Qingdao 10260 10 Larne 147 Antwerp 724 Keelung 1828 Antwerp 4082 Rotterdam 9743 11 Virginia 143 Yokohama 722 Yokohama 1648 Shenzhen 3994 Tianjin 8700 12 Liverpool 140 Bremen/Br. 703 Long Beach 1598 Port Klang 3207 Kaohsiung 8581 13 Harwich 140 Baltimore 663 Tokyo 1555 Dubai 3059 Port Klang 7310 14 Gothenburg 128 Keelung 660 Antwerp 1549 New York 3050 Antwerp 7310 15 Philadelphia 120 Busan 633 Felixstowe 1418 Tokyo 2899 Hamburg 7010 16 Sydney Harbour 118 Tokyo 632 San Juan 1381 Felixstowe 2853 Los Angeles 6749 17 Le Havre 108 Los Angeles 621 Bremen/Br. 1198 Bremen/Br. 2752 Tanjung Pelepas 6000 18 Anchorage 101 Jeddah 563 Seattle 1171 Gioia Tauro 2653 Long Beach 5068 19 Felixstowe 93 Long Beach 554 Oakland 1124 Melbourne 2550 Xiamen 4680 20 Kobe 90 Melbourne 513 Manila 1039 Durban 2497 Laem Chabang 4622 21 Hamburg 72 Le Havre 507 Bremerhaven 1030 Tanjung Priok 2476 New York 4562 22 Zeebrugge 70 Bordeaux 453 Bangkok 1018 Yokohama 2317 Dalian 4552 23 Montreal 68 Honolulu 441 Tacoma 938 Manila 2292 Bremen/Br. 4536 24 Hull 59 San Juan 428 Dubai 916 Kobe 2266 Jawaharlal Nehru 4061 25 Tokyo 54 Sydney Harbour 383 Nagoya 898 Yantian 2148 Tanjung Priok 3800
Total 25 ports 3552 19482 49168 120820 242417
World total 4423 34806 84642 235569 432018
Share 25 ports (per cent) 80 56 58 51 56
Source: Containerisation International
Table 6.5: Centrality of top 25 ports in 1996 and 2006
1996 2006 Port Betweenness Centrality Degree Centrality Port Betweenness Centrality Degree Centrality Singapore 150,240 165 Singapore 174,516 226 Rotterdam 97,875 140 Rotterdam 146,454 167 Hamburg 90,978 124 Hamburg 127,733 150
Hong Kong 61,839 126 Hong Kong 117,675 203
Antwerp 50,513 112 Busan 96,257 190
Busan 39,943 105 Shanghai 92,838 193
Le Havre 34,593 90 Bremerhaven 56,219 105
Houston 32,841 71 Antwerp 53,766 137
New York 32,536 70 Port Klang 52,191 148 Yokohama 31,090 83 Gioia Tauro 47,971 120 Los Angeles 30,726 66 Marsaxlokk 45,183 120 Felixstowe 27,606 88 Surabaya 39,030 50 Kaohsiung 27,551 82 Kingston(JAM) 37,495 104 Piraeus 24,827 71 Algeciras 36,846 130 Melbourne 22,516 44 Valencia 33,688 120 Philadelphia 21,867 44 Miami 32,963 83 Bremerhaven 21,661 56 Barcelona 32,462 118 Algeciras 20,373 72 Le Havre 31,623 98
Port Klang 19,782 58 Kaohsiung 31,419 125
Bilbao 19,549 60 New York 30,607 93
Valencia 17,380 78 Jebel Ali 28,785 97
Port Everglades 16,176 67 Felixstowe 28,216 92
Colombo 16,043 62 Durban 27,708 82
Izmir 14,854 55 Santos 26,306 92
Shanghai 14,719 59 Shenzhen 25,582 107
Figure 6.1: Bundling within an individual liner service Line bundling service (symmetric and asymmetric)
Round-the-world service
Figure 6.2: Bundling container cargo by combining/linking two or more liner services
Hub/feeder (hub-and-spoke) network
Interlining
Figure 6.3: The process of liner service design
Note: Dark gray/shaded areas are decision variables in liner service design
Source: own elaboration based on insights from Notteboom (2009) and Notteboom and Vernimmen (2009)
Figure 6.4: Top 100 interregional traffic links in 1996 and 2006
Figure 6.5: Centrality in liner shipping networks and container throughput
Source: own elaboration based on LMIU data N.B. analysis based on the graph of adjacent calls between ports
Authors’ bionotes
Dr. César Ducruet works since 2009 as research fellow for the French National Centre for Scientific Research (CNRS) at the research laboratory Géographie-Cités (Sorbonne University). His research interests as a geographer include transport networks, territorial integration, and spatial analysis, through the looking glass of urban-port development and maritime networks, with a special focus on Europe and Asia. His past experiences in South Korea (KRIHS) and The Netherlands (Erasmus University) have resulted in several collaborations with many foreign colleagues, finalised in numerous book chapters and peer-reviewed journals. He has given regular lectures in Asia (Korea, China) and Europe (Belgium, France, The Netherlands), and is currently involved in several research projects on port cities and maritime networks such as ESPON-TIGER and Marie Curie ERG (Europe), OECD (expert), and CNRS-PE/PS (France).
Prof. Dr. Theo Notteboom is professor and president of ITMMA, an institute of the University of Antwerp (www.itmma.ua.ac.be). He is also a part-time professor in maritime transport at the Antwerp Maritime Academy and a visiting professor at Dalian Maritime University in China and World Maritime University in Sweden. He previously held a position as MPA Visiting Professor in Port Management at the Nanyang Technological University in Singapore. He currently is president of International Association of Maritime Economists (IAME) and chairman of the Board of Directors of Belgian Institute of Transport Organizers (BITO), an institute of the Belgian Federal Government. He (co-)authored nearly 300 papers on (trans)port and maritime economics in academic journals, books and conference proceedings and was involved in about 50 national and international research projects. He received six awards for his academic work from organizations such as International Association of Ports and Harbors (IAPH) and IAME. He is a regular speaker at international and national conferences and co-organized about ten conferences. He is a fellow of the Belgian Royal Academy of Overseas Sciences, a co-director of PortEconomics.eu, associate editor of Maritime Policy and Management and a member of the editorial boards of four other leading academic journals.