HAL Id: hal-01224902
https://hal.archives-ouvertes.fr/hal-01224902
Submitted on 5 Oct 2018HAL is a multi-disciplinary open access archive for the deposit and dissemination of sci-entific research documents, whether they are pub-lished or not. The documents may come from teaching and research institutions in France or abroad, or from public or private research centers.
L’archive ouverte pluridisciplinaire HAL, est destinée au dépôt et à la diffusion de documents scientifiques de niveau recherche, publiés ou non, émanant des établissements d’enseignement et de recherche français ou étrangers, des laboratoires publics ou privés.
Elucidating collision induced dissociation products and
reaction mechanisms of protonated uracil by coupling
chemical dynamics simulations with tandem mass
spectrometry experiments
Estefania Rossich-Molina, Daniel Ortiz, Jean-Yves Salpin, Riccardo Spezia
To cite this version:
Estefania Rossich-Molina, Daniel Ortiz, Jean-Yves Salpin, Riccardo Spezia. Elucidating collision induced dissociation products and reaction mechanisms of protonated uracil by coupling chemical dynamics simulations with tandem mass spectrometry experiments. Journal of Mass Spectrometry, Wiley-Blackwell, 2015, 50 (12), pp.1340-1351. �10.1002/jms.3704�. �hal-01224902�
Elucidating collision induced dissociation products and reaction
mechanisms of protonated uracil by coupling chemical dynamics
simulations with tandem mass spectrometry experiments
Estefanía Rossich Molina,
1,2Daniel Ortiz,
3,4Jean-Yves Salpin
*1,2and Riccardo
Spezia
*1,21) Université d'Evry Val d'Essonne – Laboratoire Analyse et Modélisation pour la Biologie et l’Environnement – Boulevard François Mitterrand – 91025 Evry – France.
2) CNRS- UMR 8587.
3) Institut Rayonnement Matière de Saclay, NIMBE/CEA, LIONS, Bât. 546, F-91191
Gif-sur-Yvette Cedex, France.
4) CNRS – UMR 3685.
* e-mail to: jean-yves.salpin@univ-evry.fr ; riccardo.spezia@univ-evry.fr
27/08/2015
Keywords: nucleobases fragmentation, collision induced dissociation, retro Diels Alder, gas-phase reaction mechanisms, chemical dynamics simulations
Abstract
In this study we have coupled mixed quantum-classical (QM+MM) direct chemical dynamics simulations with electrospray ionization/tandem mass spectrometry (ESI-MS/MS) experiments in order to achieve a deeper understanding of the fragmentation mechanisms occurring during the collision induced dissociation (CID) of gaseous protonated uracil. Using this approach, we were able to successfully characterize the fragmentation pathways corresponding to ammonia loss (m/z 96), water loss (m/z 95) and cyanic or isocyanic acid loss (m/z 70). Furthermore, we also performed experiments with isotopic labeling completing the fragmentation picture. Remarkably, fragmentation mechanisms obtained from chemical dynamics simulations are consistent with those deduced from isotopic labeling.
1. Introduction
DNA is present in the nuclei of eukaryotic cells and its vital role in inheritance and protein coding was outlined long time ago. However, modifications occurring at the level of the nucleobase moieties, namely adenine (A) cytosine (C), thymine (T) or guanine (G), may have severe effects onto the integrity of this biopolymer. This is the case notably of uracil formation within DNA. Cytosine for example can be hydrolytically deaminated spontaneously under physiological circumstances, leading to uracil.1 Misincorporation of dUMP (deoxyuridine-5’-monophosphate) during DNA replication is another source of uracil in DNA. Although uracil is naturally occurring in RNA, the uracil:adenine and uracil:guanine mispairings that result from the presence of uracil in DNA represent a problem since they have cytotoxic and mutagenic potential, respectively.1 It is therefore important from the biological viewpoint to understand the chemical reactivity of the nucleobases, and notably uracil. This is not a simple task, in fact different biological reactions may involve different tautomers of uracil.2-6
Studying the reactivity of biomolecules in the gas phase is a powerful approach, because one can get rid of any effect depending on the environment and thus access directly to important intrinsic properties. In this respect, fast atom bombardment (FAB),7 matrix assisted laser desorption ionization (MALDI),8 electrospray ionization (ESI)9,10 or desorption electrospray ionization (DESI)11,12 techniques are particularly useful, and have been extensively used to generate biomolecular ions in the gas phase. In combination with these ionization methods, tandem mass spectrometry through collisional induced dissociation of ions (CID) is also particularly helpful to understand reactivity and to identify characteristic features of biomolecules, since activated ions get enough energy to follow extensive fragmentation.13
In this context, CID was used to study the gas-phase unimolecular reactivity of protonated uracil (m/z 113).14,15,16 Those studies unanimously point out that the MS/MS spectrum of protonated uracil presents three main peaks: m/z 96 corresponding to ammonia loss, another peak at m/z 95 associated with elimination of water, and finally an intense peak at m/z 70 tagged as cyanic or isocyanic acid loss.
On the other hand, these authors suggested different mechanisms as responsible for reaction pathways leading to some of the observed fragment ions. For example, Nelson and McCloskey proposed that water loss from pyrimidine bases involves ring opening followed by proton transfer to an exocyclic oxygen14, while Beach and Gabryelski discussed the possibility that this mechanism does not reflect experimental data.15 They also proposed that the retro Diels-Alder mechanism proposed by Nelson and McCloskey for a cyanic acid loss could not occur in a single step as a charge-directed process.15 Conversely, in a recent study,16 calculations were performed by means of density functional theory (DFT), which suggested that retro Diels-Alder reaction represents 90% of cyanic acid loss.
In this context, we propose a complementary and extended approach that, to our knowledge, was not used before for uracil. This approach, which combines ESI-MS/MS with chemical dynamics simulations at the QM+MM level of the CID process, gives new insights on uracil fragmentations in the gas phase. This approach was pioneered by Hase and co-workers in studying CID of different systems,17-22 and we have recently obtained good agreement between simulations and theory on several systems, from small organic molecules23-25 to small peptides and carbohydrates.26-28 Direct dynamics is able to provide information on the structure of fragment ions obtained after collision of a gaseous precursor ion with an inert gas, and thus on the reaction pathways, without pre-imposing any reaction coordinate. Recently, Li+/uracil complexes CID was studied theoretically by the same approach by Martinez-Nuñez
and co-workers29 and we presently applied this strategy to elucidate the dissociation mechanisms of protonated uracil.
2. Materials and methods 2.1 Mass spectrometry
Experiments were performed using an Applied Biosystems/MDS Sciex API2000 triple-quadrupole instrument fitted with a turboionspray source. Aqueous solutions (10-4 M) of unlabeled and labeled uracil (2-13C-uracil; 3-15N-uracil and 1,3-15N-213C-uracil) were prepared with Milli-Q water, and were introduced in the source using direct infusion with a syringe pump at a flow rate of 5 μl/min. Ionization of the sample was achieved by applying a voltage of 5.5 kV on the sprayer probe and by the use of a nebulizing gas (GAS1, air) surrounding the sprayer probe, intersected by a heated gas (GAS2, air) at an angle of 90°. The operating pressure of GAS1 and GAS2 are adjusted to 2.1 bars, by means of an electronic board (pressure sensors), as a fraction of the air inlet pressure. The curtain gas (N2), which
prevents air or solvent from entering the analyzer region, was similarly adjusted to a value of 1.4 bar. The temperature of GAS2 was set to 100 °C. CID spectra were recorded by introducing nitrogen as collision gas in the second quadrupole. Low gas pressures were used to limit multiple ion–molecule collisions. Moreover, the declustering potential was fixed to 40 V to perform MS/MS experiments. CID spectra were recorded at different collision energies ranging from 5 to 30 eV (laboratory frame). Note that MS/MS spectra are very likely obtained under a multiple-collision regime and this increases the internal energy content of the precursor ion. With the CAD parameter (which controls the amount of N2 introduced into Q2)
set to its minimum value, the pressure value measured by the ion gauge, located at the vicinity of Q2, is about 3 × 10 -5 Torr, but the actual pressure inside Q2 cannot be determined accurately. However, according to a previous report,21 this pressure inside Q2 is closer to 10-2
Torr. Given the dimensions of Q2, the mean free path for a moving N2 molecule, according to
the gas kinetic theory is several mm at 10-2 Torr. So a molecule of N2 may undergo tens of
collisions within Q2. This is a lower limit for present ion of interest which has a larger diameter and, thus, a larger collision cross-section. All Nucleobases but 3-15N-uracil (see acknowledgements) were purchased from Aldrich (Saint-Quentin Fallavier, France) and were used without further purification.
2.2 Computational details
Uracil has different protonated forms. Here, we have considered six different protonation states, shown in Figure 1. In the same figure, we also show the atom numbering typically used to identify basic sites and heavy atoms of uracil, together with the nomenclature of uracil isomers employed hereafter. Note that for each tautomer different conformations of the NCOH dihedral angle are possible: in dynamics we have considered for each protonation site the most stable conformer.
Geometry optimizations of minima of reactants (protonated uracil) and fragmentation products were obtained at B3LYP30,31, BLYP 32 , AM133 and PM334 levels of theory, the same used later in chemical dynamics simulations. In the case of B3LYP and BLYP, we used 6-31G and 6-6-31G(d) basis sets. Furthermore, on some selected fragmentation pathways single point energies were obtained with those methods and also CCSD(T)/6-31G and B3LYP/6-311G(d, p) levels of theory.
Finally, NBO35 calculations were performed on reactants and some selected products using the aforementioned levels of theory in order to obtain charges and bond orders. Formal Lewis structures used to draw reaction mechanisms are obtained by analyzing such NBO results. All these calculations were performed with Gaussian0936 package.
Based on minima and transition states obtained from quantum chemistry calculations we have evaluated rate constants for some selected proton transfer in the framework of RRKM theory using the standard equation 37
(1)
where σ is the reaction path degeneracy, N#(E - E0) is the sum of states at the transition state (TS), (E) is the reactant’s density of states, and h is Planck’s constant. The TSs are located at saddle points on the PES. The sum and density of states were calculated from vibrational frequencies using the direct count algorithm, as implemented in the RRKM code developed by Zhu and Hase.38
The expression of the potential energy function used for the collision system, formed by [uracil]H+ and Argon, is described by:
(2)
where is the intramolecular potential of [uracil]H+ while is the Ar-[uracil]H+
intermolecular potential.
As in previous works23,24,26,39 we used semi-empirical Hamiltonians, PM3 and AM1, as well as DFT (at BLYP/6-31G level) for the intramolecular potential, , while for the intermolecular potential, , we used an analytical two-body potential whose
parameters were obtained by fitting accurate quantum chemical calculations, as done also in previous works:
(3)
where i runs over all the [uracil]H+ atoms. This potential is purely repulsive – A, B and C are always positive – and it was developed by Meroueh and Hase to simulate CID of peptides19 and recently used successfully in our group to simulate CID of different molecules.23,24,28 Parameters used in equation 3 for uracil atoms were obtained from the work of Meroueh and Hase.19 Parameters for sp2 carbon atoms (missing in previous works) were obtained by fitting Ar-ethylene interaction obtained at the QCISD(T)/6-31++G** level of theory (the same used in the previous works). Interaction curves, fits and parameters obtained are reported in Supporting Information (Figure S1 and Table S1).
Note that we used Ar in simulations while experiments were done with N2. As we have
detailed in a case study,39 the use of Ar provides a more efficient energy transfer and thus a higher reaction yield.
Chemical dynamics simulations were done for the six isomers shown in Figure 1 and as reference structure we have used the minima corresponding to each QM method employed in simulations (PM3, AM1 and DFT).
Initial conditions for each isomer were chosen by adding quasi-classical 300 K Boltzmann distribution of vibrational/rotational energies about the isomers potential energy minima.40-42 The resulting normal mode energies were partitioned between kinetic and potential energies by choosing a random phase for each normal mode. A 300 K rotational energy of RT/2 was added to each principal axis of rotation for the ion. Vibrational and rotational energies were transformed into Cartesian coordinates and momenta following the well-known algorithms implemented in VENUS96.43 The ion was then randomly rotated about its Euler angles to take into account the random directions of the Ar + [uracil]H+ collisions. Relative velocities were
impact parameter. Collision energy of 300 kcal/mol was considered, corresponding to a laboratory framework energy of 49.7 eV. The impact parameter, b, was randomly sampled between 0 and 0.5 (bmax) Å. This small maximum value of bmax as well as the value of energy
were chosen to increase the reaction probability. To understand the effect of impact parameter on fragmentation, we have performed simulations also with higher bmax, up to 5 Å, monitoring
the reactivity ratio for different values of b sampled. For isomers with small reactivity (e.g. isomer 1), reaction probability is already small for b=0.5Å (less than 1%) and increasing the bmax value it becomes even smaller (and only one fragmentation product is obtained in any
case). For isomer 2, which exhibits a good variety of fragments (see results section) reactivity drops down quickly with b (see Figure S2(a) of the Supporting Information where reactivity is less than 0.5% for b>0.5 Å) and the fragmentation pattern does not seem to depend on the bmax used but rather on the sampling of small b values: i.e. to have enough statistics on
reaction products for higher values of bmax more trajectories than the 10000 used here should
be used. Finally, for isomers with large reactivity, e.g. isomer 5 which has a high reaction probability for b = 0.5 Å, the reactivity drops down slowly up to about b=4Å as shown in Figure S2(b). On the other hand, this isomer mainly produces the m/z 70 product and this is not affected by the impact parameter. In fact, while the angular momentum can have a role in determining fragmentation products in general, it has not a big impact in uracil, probably due to the compact and planar shape of the molecule. Thus, to be consistent through the different isomers studied and to enhance the reaction probability and the statistics of reaction products for the less reactive ones, we have reported in this work only results obtained with bmax=0.5Å. Trajectories were calculated using the software package consisting of the general chemical dynamics computer program VENUS9643 coupled to MOPAC44 for PM3 and AM1 and to Gaussian0936 for DFT. The classical equations of motion were integrated using the velocity Verlet algorithm with a time step of 0.2 fs that gives energy conservation for both reactive and
nonreactive trajectories. The trajectories were initiated at an ion-projectile distance of 15 Å, large enough to guarantee no interaction between the ion and the colliding atom, and halted at a distance of 200 Å for PM3 and AM1 simulations, and 50 Å for those run with DFT to allow substantial intramolecular motion of the protonated uracil after collision. This corresponds to a total integration time of about 5 and 2 ps, respectively. A trajectory was also stopped if the ion dissociates. In the case of PM3 and AM1 simulations, we ran for each isomer 10000 trajectories, while in DFT dynamics we ran 50 trajectories per isomer.
3. Results
3.1 Experimental spectra
Typical positive-ion electrospray spectra (not shown) of an aqueous mixture of uracil results in a very abundant ion detected at m/z 113 corresponding to protonated uracil. This is expected given the relatively high gas-phase basicity of this nucleobase.45 Peaks corresponding to [(uracil)n]H+ multimers (n=2,3) are also detected in significant abundance at
m/z 225 and m/z 337. Finally, peaks corresponding to cationization of uracil by sodium or potassium are also observed.
[(uracil)n]H+ species (n=1-3) were selected and allowed to dissociate upon collision with
nitrogen. Higher homologues fragment by successive elimination of neutral uracil. Figure 2(a) shows the experimental MS/MS spectrum of [uracil]H+ (m/z 113) recorded at a collision energy of 25 eV in the laboratory framework. The peak at m/z 113 corresponds to residual protonated uracil. Three other intense peaks at m/z 96, 95 and 70 are observed. We interpret the peak at m/z 96 as ammonia elimination. m/z 95 arises from water loss and the ion detected at m/z 70 is associated with either isocyanic (HNCO) or cyanic (NCOH) acid loss (see also Figure S3 for a spectrum recorded with higher resolving power). Finally, small peaks at m/z
43 and 44 are also detected. Globally, the MS/MS spectrum is similar to that of protonated uracil generated in the gas phase by FAB 14 or more recently by ESI.15
Results obtained with labeled uracil are summarized in Table S2 of the Supporting Information. The set of spectra reported in the present work are those obtained using a collision energy of 25 eV in the laboratory framework. Our data provide useful insights about the mechanisms involved during the CID process. For example, in the case of 3-15N-uracil (Figure 2(b)), we can see a very intense peak associated with the loss of 18 amu, while the loss of 17 amu is very weak. This indicates that elimination of ammonia process by at least two different mechanisms, the one resulting in the elimination of the N3 center being clearly overwhelming with respect to the process expelling the N1 atom. A similar deduction can be made for the elimination of [H, N, C, O]. Two processes are associated with the elimination of 43 amu. Again, the [H, C,15N, O] loss (m/z 70) is more important than [H,C,N,O] elimination (m/z 71). Results obtained with 2-13C-uracil (Figure 2(c)) and 1,3-15N2--2-13
C-uracil (Figure 2(d)) also demonstrate that the C2 center is systematically eliminated (Table S2) These different findings are in agreement with previous data obtained under FAB/CID conditions.14
The MS/MS spectra of both the m/z 96 and 70 species have also been recorded and are given in Figure S4 of the Supporting Information. These ions were generated by “in-source” fragmentation and then selected by the first quadrupole. In the MS/MS spectrum of m/z 96 (Figure S4 (a)), we can see a peak at m/z 68 assigned to CO loss in a second step. The MS/MS spectrum of the m/z 70 species (Figure S4 (b)) is characterized by a peak detected at m/z 28 and corresponding to HNCH+.
3.2 Chemical dynamics fragmentations
The diketo form of uracil is reported to be the predominant isomer in condensed phase.46,47,48,49,50 In the gas phase, O7 and O8 proton affinities become close in energy51-54 and
so we find that tautomerization and proton transfer are more plausible.15 The relative energies of the different tautomers studied in the present work are summarized in Table 1, where we also report the corresponding Boltzmann population at 300 K. It is worth noting that the global minimum, isomer 1, cannot be generated directly from protonation of the diketo form of uracil. Previous experiments and calculations in the gas phase have shown that protonated uracil is mainly in isomer 1 configuration, but also isomer 2 structure can be partially populated.54 It is likely that collision activation is able to populate different protonation states. In any case, the isomerization barriers between the different conformers are about 40-46 kcal/mol, 54,55 an energy amount that can be gained by the precursor ions during the CID activation process. Using a simple RRKM model for the kinetics of proton transfer (see Eq.1), the time-scales of such reactions are in the ns time regime (or slower). In Figure S5 of Supporting Information we show the RRKM microcanonical rate constant for intramolecular proton transfer from O7 to N3: conversion from isomer 1 into isomer 2. While experimentally accessible, these time scales are too long for direct dynamics simulations and thus, to overcome this time-scale problem, we performed simulations using as initial structures all the six isomers in a different protonation state. This means that proton transfers are not directly simulated, but performing CID simulations of different initial isomers we can have a clear picture of fragmentation mechanisms and suggest the isomer that is mainly responsible of this reactivity, similarly to what done in the case of N-formylalanylamide.26 We should note that for each tautomer we have used as initial structure for chemical dynamics the most stable conformer. Of course, other conformers may be present in gas phase after collisional activation. During dynamics, starting from the most stable conformer of each tautomer, we have activated the NCOH dihedral angle (that was observed to rotate almost freely), such that for each tautomer we populated the different conformers reported by Salpin et al.54 Thus, it was not necessary to run dynamics with different conformers for each tautomer. As in
previous works,26,56 what is most relevant for product distributions obtained directly from chemical dynamics simulations is where the proton is initially located.
In Table 2 we report the products obtained from AM1, PM3 and DFT chemical dynamics simulations of CID using the six different initial protonation states described previously (Figure 1). First, we can notice that the most stable isomer 1 has a very low reaction probability (<1% and even no reactivity at AM1 level) and the few reactive trajectories (about 10 over 10000) only provide m/z 70. Isomer 2 CID dynamics provides a much more rich fragmentation pattern, and in particular we obtain m/z 95, 70, 44 and 28 that are coherent with experimental spectra, plus (mainly at PM3 level) m/z 85. Isomer 3 provides a similar pattern as isomer 2, and isomer 4 is able to provide also the m/z 96 product ion. Isomer 5 fragments to generate m/z 70 and few of m/z 85 and m/z 44. For this particular isomer ammonia loss (m/z 96) involving N1 is not observed, which is consistent with the predominant elimination of N3 observed experimentally by Nelson and McCloskey14 and confirmed by our study. Finally, isomer 6 provides m/z 85 as the main reaction product and thus it can be excluded since this particular fragment ion is not clearly obtained experimentally. More details will be given in the next section. Here can conclude that isomers 2, 3 and 4 constitute the minimum set of structures that are able to account for all the observed reactivity. The picture that emerges is that collisions populate the different tautomers from which the observed fragments are directly obtained, since in principle in the gas phase, based on IRMPD spectrum done similar ionization conditions54 and the Boltzmann probabilities, only isomer 1 should be obtained with a small population of the isomer 2. On the other hand, also (at least) isomers 3 and 4 must be populated in the process before fragmentation to obtain the observed product ions. In Figure 3 we report the theoretical CID spectra obtained from chemical dynamics using these three initial protonation states at AM1 and DFT level. PM3 dynamics seem to be less in agreement with experiments and DFT simulations than AM1 is, such that in the following we
will only discuss AM1 as semi-empirical Hamiltonian for fragmentation patterns. We should note that here the comparison between simulations and experiments is qualitative, i.e. based on the observed product ions and not on the intensity (see comparison in Table 2). First, the Ar projectile provide an upper limit in energy transfer,39 and thus a higher reaction yield with respect to what one can expect with N2. Secondly, simulations are limited in time and mainly
fast processes are correctly sampled. In other words, fast direct fragmentation processes are overestimated with respect to slow statistical processes. What is important, to understand fragmentation pathways, is to have a correct fragmentation pattern in simulations from which we can obtain a molecular description of reaction mechanisms. A full theoretical MS/MS spectrum, should also account for slow processes that cannot directly be obtained from chemical dynamics that are performed in the ps time scales. As shown in detail in a previous work of our group,25 a full CID spectrum will result from the combination of fast direct and slow statistical processes. In fact, as shown in Figure S6 of the Supporting Information, some of the trajectories that did not react in the simulated time length have enough vibrational energy after collision to isomerize and fragment.
4. Discussion
In this section we describe in detail the mechanisms obtained by performing chemical dynamics simulations and responsible for the three most intense peaks in the ESI-MS/MS spectrum of protonated uracil, namely ammonia loss at m/z 96, water loss at m/z 95, and elimination of 43 amu associated with the loss of either cyanic or isocyanic acid and leading to m/z 70.
4.1 Ammonia loss (m/z 96)
Since the precursor ion is m/z 113, elimination of ammonia corresponds to m/z 96. Looking at the structures of protonated uracil (Figure 1), we see that a priori such elimination may
isomers where two of the protons were initially on N1 (isomer 5) or on N3 (isomer 4 and 6), we observed ammonia loss only in the latter case.
Concerning the mechanism for ammonia loss starting from isomer 4, we observed a dominant mechanism (75%) starting by ring opening on the C2-N3 bond, and a minor one whose first step is associated with N3-C4 bond cleavage. Once the ring is opened, a proton transfer (PT) occurred from N1 to N3. We show these two mechanisms in Scheme 1 a) and b). On the other hand, starting from isomer 6, we found that the mechanism leading to ammonia loss exclusively implies the N3-C4 bond cleavage and then, a proton is transferred from the O7 to N3. The mechanism is shown in Scheme 1 c). Note that the three mechanisms lead to the same fragment ion’s structure.
CID experiments with 3-15N-uracil are useful to determine which nitrogen atom is retained in the formula of ammonia. Experimentally, we show that ammonia loss predominantly proceeds through elimination of N3 (see previous section). The result is in agreement not only with our simulations, but also with the results of Nelson and co-workers under FAB conditions.14
Note that the NH3 loss is not observed in DFT simulations and it is only a minor product in
PM3 and AM1 simulations. By comparing energy of this exit channel, we cannot find any remarkable difference between the semiempirical Hamiltonians and DFT (see for example Figure S7 where we show that DFT barriers are not higher than AM1 ones). On the other hand, DFT simulation has a standard deviation for such minor products of about 3%, while AM1 and PM3 of 0.2%, so we are close to the statistical observation limit. The difference between the two approaches is also in the simulation time: 2 ps for DFT vs 5 ps for AM1 and PM3. As shown by the relatively complex mechanisms leading to NH3 loss shown in Scheme
1, it is a slow process for which the 2 ps of DFT trajectories are probably not enough. This explains also the discrepancy observed in the intensity of the m/z 96 peak: in experiments both fast direct fragmentation and slow statistical processes are present.
4.2 Water loss (m/z 95)
The peak detected at m/z 95 corresponds to water elimination. The water lost may incorporate either O7 or O8. From our simulations on different isomers, we observed water loss from O7 when starting from isomer 3, and water loss from O8 when the initial structure is isomer 2. AM1, PM3 and DFT dynamics show that when the water is lost from O8, the reaction begins with C2-N3 bond breaking, followed by a proton transfer from N1 to O8. This proton transfer seems to be favored once the ring is opened because there is a rotation about the C4-C5 and N1-C6 bonds that brings O8 closer to N1. Water loss from O7 involves first the ring opening through cleavage of the C4-N3 bond, followed by a proton from N1 to this oxygen, to finally obtain the charged fragment m/z 95. These two mechanisms are shown in Scheme 2.
Nelson and McCloskey14 performed MS/MS experiments with isotopic labeling either on O7 or O8 of uracil. They observed that the abundance ratio m/z 95/m/z 97 (-H218O/-H2O) are
similar in both spectra, giving evidence to the non-selective character for this reaction path. Furthermore, they interpret the non-existence of this path in the Electron Impact spectrum of uracil57 as initial ring opening at N3 position. On the other hand, Beach and coworkers15 reinterpreted these data and considered that once the ring opened , O7 and O8 would not be equivalent with respect to proton transfer and therefore the rate of water loss would not give peaks with same intensity. Based on this interpretation, they proposed other mechanisms involving proton transfer without ring opening.
In our simulations, isomer 2 loses water from O8 while isomer 3 from O7, and in both cases the mechanisms involve proton transfer after ring opening as proposed by Nelson and McCloskey.14
4.3 Neutral and protonated cyanic (NCOH) and isocyanic (HNCO) acid loss (m/z 70 and
Protonated uracil can also follow a retro Diels-Alder like (rDA) reaction, that is the reverse mechanism of Diels-Alder reaction.58-60
When isomers 1, 2 and 5 react following rDA mechanism two fragments are obtained: a neutral one – cyanic or isocyanic acid – and another singly charged cation that is the peak at m/z 70 observed experimentally. On the other hand, when the other isomers studied react according to a rDA process, they give a peak at m/z 44 – protonated cyanic or isocyanic acid – as a consequence of the different location of the proton. We end up with the same ion at m/z 70 only in the cases where the protonated cyanic or isocyanic transfers a proton to the other fragment in a second step. These two mechanisms are displayed in Scheme 3. For the latter isomers, we also show the different proton transfers that can occur after the rDA reaction. In the previous work of Beach and Gabryelski,15 other mechanisms different from the rDA reaction were proposed to account for the formation of the m/z 70 ion. These mechanisms are reported in Scheme 4. For these mechanisms, we calculated the potential energy surface (PES) at different levels of theory. Analyzing the PES of the different reaction pathways, we see that those suggested by Beach and Gabryelski are comparable energetically with the pathway corresponding to the rDA mechanism. Note that we observed in chemical dynamics simulations producing m/z 70 only rDA mechanisms. Kinetics and dynamical factors, and in particular the time-scale needed for the multiple steps alternative pathways, could be the reason why we do not observe in our simulations these other mechanisms.
4.4 CO loss (m/z 85)
A peak at m/z 85 is assigned to CO loss (either from O7 or O8). Elimination of ethylene is never observed during simulations. In all cases CO is lost in a concerted way, that is, breaking the N1-C2 and C2-N3 bonds, or N3-C4 and C4-C5 bonds. This path is observed for certain isomers and is only present in some of our theoretical simulations. For each given isomer, comparing PM3 and AM1 products, we observe that the m/z 85 ion is obtained much more
during PM3 simulations. Then, we have calculated the electronic energy profile taking the snapshots of a trajectory producing m/z 85 at different levels of theory (see Figure 4). The energy barrier obtained at PM3 level is underestimated by around 20 kcal/mol with respect to B3LYP/6-311+G(3df,2p), while AM1 underestimates the same barrier only by 5 kcal/mol. We should thus considered the abundance obtained by PM3 due to the method employed, while AM1 results are probably more reliable, since the energy barrier (and the full dissociation energy profile) is comparable to what obtained by calculations done at higher level of theory.
Finally, we performed CID simulations using as starting structure the m/z 85 ion corresponding to CO loss. We found that the reactivity is very high (about 75%), leading to minor fragments. This suggests that even if the m/z 85 fragment is formed in experiments, it is probably not detected because it further dissociates before reaching the detector. Note that this peak has only been reported by Sadr-Arani et al. in a recent study.16
4.5 Other minor fragmentations (m/z 53, 43 and 28)
Apart from the peaks present in the experimental MS/MS of protonated uracil that appear either dominant (m/z 96, 95, 70) or controversial (m/z 85) and that we just described, there are also other minor processes leading to ions detected at m/z 53, 43 and 28. In the following we will briefly describe the mechanisms leading to these ions.
m/z 53. In Scheme 5, we see that starting from isomer 3, the ring is opened at N3-C4 bond and then there is a proton transfer from C5 to N3 leading to m/z 53. C4, C5, C6 and O8 atoms are retained in the final fragment. Nelson and McCloskey 14 proposed another mechanism accounting for this fragment ion. Their mechanism consists in two steps: in a first step uracil loses isocyanic acid and then in a second step, it loses ammonia. Note that the atoms retained in the final fragment are the same ones in both mechanisms, such that isotope labeling experiments cannot be used to determine which is the mechanism.
m/z 43. For isomer 3, we see trajectories leading to a fragment ion at m/z 43. The first step is rDA reaction and then the protonated NCOH loses a H. We show the mechanism in Scheme 6 that may explain the peak observed experimentally in weak abundance.
m/z 28. In the experimental MS/MS spectrum of protonated uracil we do not see a peak at m/z 28. On the other hand, we show that this peak may come from m/z 70 (Figure S4). This means that this fragment is not obtained directly from the parent ion but instead, in a second step. We show in Scheme 7 the corresponding mechanism leading to HNCH+: the reaction starts by cleavage of both N1-C2 and N3-C4 bonds, and then HNCH+ is obtained when the C5-C6 bond in the m/z 70 fragment is broken. In agreement with Nelson and McCloskey,14 atoms N1 and C6 are retained in this fragment of m/z 28.
5 Conclusions
In the present work, by coupling ESI-MS/MS experiments with QM+MM direct dynamics simulations of CID for protonated uracil, we were able to understand the mechanisms beyond the observed experimental peaks. We see that all the protonation states undergo a retro Diels-Alder process in varying degrees, giving two peaks in the MS/MS spectrum: m/z 70 and the minor peak at m/z 44. Apart from m/z 70, we explained in detail two other important fragmentation mechanisms, leading to water and ammonia loss.
By performing simulations starting from different isomers where the extra proton is located on the different basic sites of uracil, we were able to point out which isomers are relevant for reactivity (and thus populated in the activation process in addition to the most stable isomer that, on the other hand shows a very low reactivity). If we combine together the information from simulations on isomers 2, 3 and 4, we are able to explain all the peaks present in the experimental MS/MS spectrum. For both water and ammonia losses, we found that the proton transfers take place once the ring is opened and that water lost can retain in its formula either
O7 or O8, N1 or O7 being the atoms donating a proton to form water, respectively. Conversely, ammonia loss is a more selective reaction and we observed this path only from N3 rather than from N1. The selectivity for these two paths are in agreement with our experiments and with previous experimental results obtained from MS/MS spectra using isotopic labeling.14
In this example, we noticed that AM1 compares better than PM3 with experiments, albeit there are no a priori reasons to prefer one to the other. To understand the origin of the difference in observed reactivity, we have compared the energy profile of some exit channels. In the case of CO loss (Figure 4), PM3 underestimates the energy of exit channel, while AM1 provides results close to DFT ones. This is surely at the origin of the presence of m/z 85, (CO loss) in PM3 dynamics, whereas it is observed neither in AM1 simulations nor in experiments (and this is one of the main reason of the better performance of AM1 vs PM3). On the other hand, for one NH3 loss case, Figure S7-b, the two semiempirical Hamiltonians provide similar
pathways, and also DFT calculations are not clearly different, while for another case, Figure S7-a, PM3 underestimates the barrier high with respect to both AM1 and DFT. On other pathways (see Scheme 4), AM1 globally provides lower energies for TS, intermediates and exit channels. The combination of these differences, that depends on the bonds breaking and isomerization involved in different reaction channels, can be at the origin of the observed difference in global reactivity and fragmentation pattern.
Concluding, we have shown that simulations can provide a clear and powerful support to understand the reaction mechanisms and product structures of nucleobases, thus giving us confidence in extending this approach also to this class of molecules. The good performances of fast semi-empirical Hamiltonians pave the way of applying to larger related systems, as nucleosides and portion of RNA or DNA.
Acknowledgments
This work was partially supported by ANR contract n° ANR-14-CE06-0029-01 (DynBioReact). JYS would like to thank Denis Brasseur (Sanofi-Aventis) for kindly providing a few milligrams of uracil-3-15N.
References
1. Olinski R, Jurgowiak M, Zaremba T. Uracil in DNA-Its biological significance. Mutat. Res. Rev. Mutat. 2010; 705: 239-245.
2. Topal MD, Fresco JR. Complementary Base-Pairing and Origin of Substitution Mutations. Nature 1976; 263: 285-289.
3. Frankkamenetskii MD, Mirkin SM. Triplex DNA Structures. Annu. Rev. Biochem. 1995; 64: 65-95.
4. Frankkamenetskii MD. DNA Topology. theochem-J. Mol. Struct. 1995; 336: 235-243.
5. Dabkowska I, Gutowski M, Rak J. Interaction with glycine increases stability of a mutagenic tautomer of uracil. A density functional theory study. J. Am. Chem. Soc. 2005; 127: 2238-2248.
6. Sinden RR. In DNA Structure and Function, 1st ed. (eds). Academic Press: San Diego, CA, 1994;
7. Morris HR, Panico M, Barber M, Bordoli RS, Sedgwick RD, Tyler A. Fast atom bombardment: A new mass spectrometric method for peptide sequence analysis. Biochem. Biophys. Res. Commun. 1981; 101: 623-631.
8. Hillenkamp F, Karas M, Rosmarinowsky J. Processes of Laser-Induced ion Formation in Mass-Spectrometry. Acs. Sym. Ser. 1985; 291: 69-82.
9. Ho CS, Lam CWK, Chan MHM, Cheung RCK, Law LK, Lit LCW, Ng KF, Suen MWM, Tai HL. Electrospray Ionisation Mass Spectrometry: Principles and Clinical Applications. Clin. Biochem. Rev. 2003; 24: 3-12.
10. Fenn JB, Mann M, Meng CK, Wong SF, Whitehouse CM. Electrospray Ionization for Mass-Spectrometry of Large Biomolecules. Science 1989; 246: 64-71.
11. Takats Z, Wiseman JM, Gologan B, Cooks RG. Mass spectrometry sampling under ambient conditions with desorption electrospray ionization. Science 2004; 306: 471-473.
12. Takats Z, Wiseman JM, Cooks RG. Ambient mass spectrometry using desorption electrospray ionization (DESI): instrumentation, mechanisms and applications in forensics, chemistry, and biology. J. Mass Spectrom. 2005; 40: 1261-1275.
13. Hayes RN, Gross ML. Collision-Induced Dissociation. Methods Enzymol. 1990;
193: 237-263.
14. Nelson CC, McCloskey JA. Collision-Induced Dissociation of Uracil and its Derivatives. J. Am. Soc. Mass Spectrom. 1994; 5: 339-349.
15. Beach DG, Gabryelski W. Revisiting the Reactivity of Uracil During Collision Induced Dissociation: Tautomerism and Charge-Directed Processes. J. Am. Soc. Mass Spectrom. 2012; 23: 858-868.
16. Sadr-Arani L, Mignon P, Chermette H, Douki T. Theoretical and experimental study of the fragmentation of protonated uracil. Chem. Phys. Lett. 2014; 605–606: 108-114.
17. Claire PD, Hase WL. Thresholds for the collision-induced dissociation of clusters by rare gas impact. J. Phys. Chem. 1996; 100: 8190-8196.
18. Desainteclaire P, Peslherbe GH, Hase WL. Energy-Transfer Dynamics in the Collison-induced Dissociation of Al-6 and Al-13 clusters. J. Phys. Chem. 1995; 99: 8147-8161.
19. Meroueh O, Hase WL. Collisional Activation of Small Peptides. J. Phys. Chem. A 1999; 103: 3981-3990.
20. Liu JY, Li ZS, Dai ZW, Huang XR, Sun CC. Direct ab initio dynamics study on the hydrogen abstraction reaction of CH3CCl3 + OH -> CH2CCl3+H2O. J. Phys. Chem. A
2003; 107: 6231-6235.
21. Martínez-Núñez E, Fernández-Ramos A, Vázquez SA, Marques JMC, Xue MY, Hase WL. Quasiclassical dynamics simulation of the collision-induced dissociation of Cr(CO)6+ with Xe. J. Chem. Phys. 2005; 123: 154311.
22. Meroueh SO, Wang YF, Hase WL. Direct dynamics Simulations of collision- and surface-induced dissociation of N-protonated glycine. Shattering fragmentation. J. Phys. Chem. A 2002; 106: 9983-9992.
23. Spezia R, Salpin JY, Gaigeot MP, Hase WL, Song K. Protonated Urea Collision-Induced Dissociation. Comparison of Experiments and Chemical Dynamics Simulations. J. Phys. Chem. A 2009; 113: 13853-13862.
24. Spezia R, Cimas A, Gaigeot MP, Salpin JY, Song K, Hase WL. Collision induced dissociation of doubly-charged ions: Coulomb explosion vs. neutral loss in Ca(urea)2+ gas phase unimolecular reactivity via chemical dynamics simulations.
Phys. Chem. Chem. Phys. 2012; 14: 11724-11736.
25. Martín-Sómer A, Yáñez M, Gaigeot M-P, Spezia R. Unimolecular Fragmentation Induced By Low-Energy Collision: Statistically or Dynamically Driven? J. Phys. Chem. A 2014; 118: 10882-10893.
26. Ortiz D, Martin-Gago P, Riera A, Song K, Salpin JY, Spezia R. Gas-phase collision induced dissociation mechanisms of peptides: Theoretical and experimental study of N-formylalanylamide fragmentation. Int. J. Mass Spectrom. 2013; 335: 33-44.
27. D. Ortiz, J.-Y. Salpin, J. Tortajada, A. Mokhtar Lamsabhi, O. Mo, M. Yanez, in World Association of Theoretical and Computational Chemists, Santiago de Compostela, Spain, 2011.
28. Ortiz D, Salpin JY, Song K, Spezia R. Galactose-6-Sulfate collision induced dissociation using QM plus MM chemical dynamics simulations and ESI-MS/MS experiments. Int. J. Mass Spectrom. 2014; 358: 25-35.
29. Rodriguez-Fernandez R, Vazquez SA, Martinez-Nuñez E. Collision-induced dissociation mechanisms of Li(uracil)+. Phys. Chem. Chem. Phys. 2013; 15:
7628-7637.
30. Becke AD. A new mixing of Hartree–Fock and local density‐functional theories. J. Chem. Phys. 1993; 98: 1372-1377.
31. Lee C, Yang W, Parr RG. Development of the Colle-Salvetti correlation-energy formula into a functional of the electron density. Phys. Rev. B 1988; 37: 785-789. 32. Becke AD. Density-Functional Exchange-energy Approximation with Correct
33. Dewar MJS, Zoebisch EG, Healy EF, Stewart JJP. Development and use of quantum mechanical molecular models. 76. AM1: a new general purpose quantum mechanical molecular model. J. Am. Chem. Soc. 1985; 107: 3902-3909.
34. Stewart JJP. Optimization of parameters for semiempirical methods I. Method. J. Comput. Chem. 1989; 10: 209-220.
35. Weinhold F, Landis CR. Natural Bond Orbitals and Extensions of Localized Bonding Concepts. Chem. Educ. Res. Pract. 2001; 2: 91-104.
36. Frisch MJ, Trucks GW, Schlegel HB, Scuseria GE, Robb MA, Cheeseman JR, Scalmani G, Barone V, Mennucci B, Petersson GA, Nakatsuji H, Caricato M, Li X, Hratchian HP, Izmaylov AF, Bloino JZ, G., Sonnenberg JL, Hada M, Ehara M, Toyota K, Fukuda R, Hasegawa J, Ishida M, Nakajima T, Honda Y, Kitao O, Nakai H, Vreven T, Montgomery JA, Jr., Peralta JE, Ogliaro F, Bearpark M, Heyd JJ, Brothers E, Kudin KN, Staroverov VN, Kobayashi R, Normand J, Raghavachari K, Rendell A, Burant JC, Iyengar SS, Tomasi J, Cossi M, Rega N, Millam JM, Klene M, Knox JE, Cross JB, Bakken V, Adamo C, Jaramillo J, Gomperts R, Stratmann RE, Yazyev O, Austin AJ, Cammi R, Pomelli C, Ochterski JW, Martin RL, Morokuma K, Zakrzewski VG, Voth GA, Salvador P, Dannenberg JJ, Dapprich S, Daniels AD, Farkas Ö, Foresman JB, Ortiz JV, Cioslowski J, Fox DJ. Gaussian 09, Revision D.01,2009. 37. Baer T, Hase WL. In Unimolecular Reaction Dynamics: Theory and Experiments, 1st
Ed. (eds). 1996;
38. Zhu L, Hase WL. A general RRKM program. QCPE, 1994 ; 14: 644.
39. Jeanvoine Y, Gaigeot M-P, Hase WL, Song K, Spezia R. Collision induced dissociation of protonated urea with N2: Effects of rotational energy on reactivity and energy transfer via chemical dynamics simulations. Int. J. Mass Spectrom. 2011; 308: 289-298.
40. Chapman S, Bunker DL. Exploratory Study of Reactant Vibrational Effects in CH3 +
H2 and its isotopic Variants. J. Chem. Phys. 1975;
41. Sloane CS, Hase WL. On the dynamics of state selected unimolecular reactions: Chloroacetylene dissociation and predissociation. J. Chem. Phys. 1977; 66: 1523-1533.
42. Cho YJ, Vande Linde SR, Zhu L, Hase WL. Trajectory studies of SN2 nucleophilic
substitution. II. Nonstatistical central barrier recrossing in the Cl− + CH3Cl system.
J. Chem. Phys. 1992; 96: 8275-8287.
43. Hase WL, Duchovic RJ, Hu X, Komornicki A, Lim KF, Lu D-h, Peslherbe GH, Swamy KN, Vande Linde SR, Varandas AJC, Wang H, Wolf RJ. VENUS96: A General Chemical Dynamics Computer Program,1996.
44. Stewart JJP. Special Issue - MOPAC - a Semiempirical Molecular-Orbital Program. J. Comput. Aided Mol. Des. 1990; 4: 1-105.
45. http://webbook.nist.gov/chemistry/
46. Beak P, White JM. Relative enthalpies of 1,3-dimethyl-pyrimidinedione, 2,4-dimethoxypyrimidine, and 4-methoxy-1-methyl-1-2-pyrimidinone: estimation of the relative stabilities of two protomers of uracil. J. Am. Chem. Soc. 1982; 104: 7073-7077.
47. Becker RS, Kogan G. Photophysical Properties of Nucleic-Acid Components .1. Pyrimidines - Thymine, Uracil, N,N-Dimethyl Derivatives and Thymidine. Photochem. Photobiol. 1980; 31: 5-13.
48. Ruterjans H, Kaun E, Hull WE, Limbach HH. Evidence for Tautomerism in Nucleic-Acid Base-Pairs - H-1-NMR Study of N-15 Labeled Transfer-RNA. Nucl. Nucleic-Acid Res. 1982; 10: 7027-7039.
49. Wojcik MJ. Low-Frequency Vibrational-Spectra of Crystalline Uracil, Thymine and their 1-methyl-derivatives. J. Mol. Struct. 1988; 189: 239-242.
50. Piskorz PJ, Wojcik MJ. Theoretical-Analisis of the NU-N-H IR Spectral Band of Crystalline Uracil. J. Mol. Struct. 1991; 242: 263-272.
51. Nguyen MT, Chandra AK, Zeegers-Huyskens T. Protonation and deprotonation energies of uracil - Implications for the uracil-water complex. J. Chem. Soc., Faraday Trans. 1998; 94: 1277-1280.
52. Kryachko ES, Nguyen MT, Zeegers-Huyskens T. Theoretical study of tautomeric forms of uracil. 1. Relative order of stabilities and their relation to proton affinities and deprotonation enthalpies. J. Phys. Chem. A 2001; 105: 1288-1295. 53. Wolken JK, Turecek F. Proton affinity of uracil. A computational study of
protonation sites. J. Am. Soc. Mass Spectrom. 2000; 11: 1065-1071.
54. Salpin J-Y, Guillaumont S, Tortajada J, MacAleese L, Lemaire J, Maitre P. Infrared spectra of protonated uracil, thymine and cytosine. ChemPhysChem 2007; 8: 2235-2244.
55. Wu RH, McMahon TB. Investigation of proton transport tautomerism in clusters of protonated nucleic acid bases (cytosine, uracil, thymine, and adenine) and ammonia by high-pressure mass spectrometry and ab initio calculations. J. Am. Chem. Soc. 2007; 129: 569-580.
56. Spezia R, Martens J, Oomens J, Song K. Collision-induced dissociation pathways of protonated Gly2NH2 and Gly3NH2 in the short time-scale limit by chemical
dynamics and ion spectroscopy. Int. J. Mass Spectrom. 2015, in press. DOI : 10.1016/j.ijms.2015.07.025
57. Rice JM, Dudek GO, Barber M. Mass Spectra of Nucleic Acid Derivatives. Pyrimidines. J. Am. Chem. Soc. 1965; 87: 4569-4576.
58. Diels O, Alder K. Synthesis in the hydroaromatic series, IV. Announcement: The rearrangement of malein acid anhydride on arylated diene, triene and fulvene (collaborated by Paul Pries). Chem. Ber. 1929; 62: 2081-2087.
59. Diels O, Alder K. Syntheses on the hydro-aromatic series, V. Announcement: On Delta(4)-tetrahydro-o-phthalic acid (Statements on the announcement(1)) by E.H Farmer and F.L Warren : Characteristics of conjugated double bonds, VII.). Chem. Ber. 1929; 62: 2087-2090.
60. Diels O, Alder K. Synthesis of the hydro aromatic sequence. Liebigs Ann. 1929;
Figure captions
Figure 1. Structures and nomenclature of protonated forms of uracil studied. Atomic
numbering is specified on isomer 1. Energies obtained at B3LYP/6-31+G(d,p) level with zero point energy correction are reported (values in kcal/mol).
Figure 2. Experimental MS/MS spectra of protonated uracil obtained with (a) uracil, (b)
3-15
N-uracil, (c) 2-13C-uracil and (d) 1,3-15N2-213C-uracil.
Figure 3. AM1 (a) and BLYP/6-31G (b) theoretical spectra of isomer 2, AM1 (c) and (d) BLYP/6-31G spectra of isomer 3, AM1 (e) and BLYP/6-31G (f) spectra of isomer 4.
Figure 4. Electronic energy of different structures extracted from one trajectory of isomer 2 in
which CO is lost retaining C2 in its formula. On the horizontal axis we show the distance between N1 and the leaving C2 atoms as it evolves in the reaction pathways.
Table caption
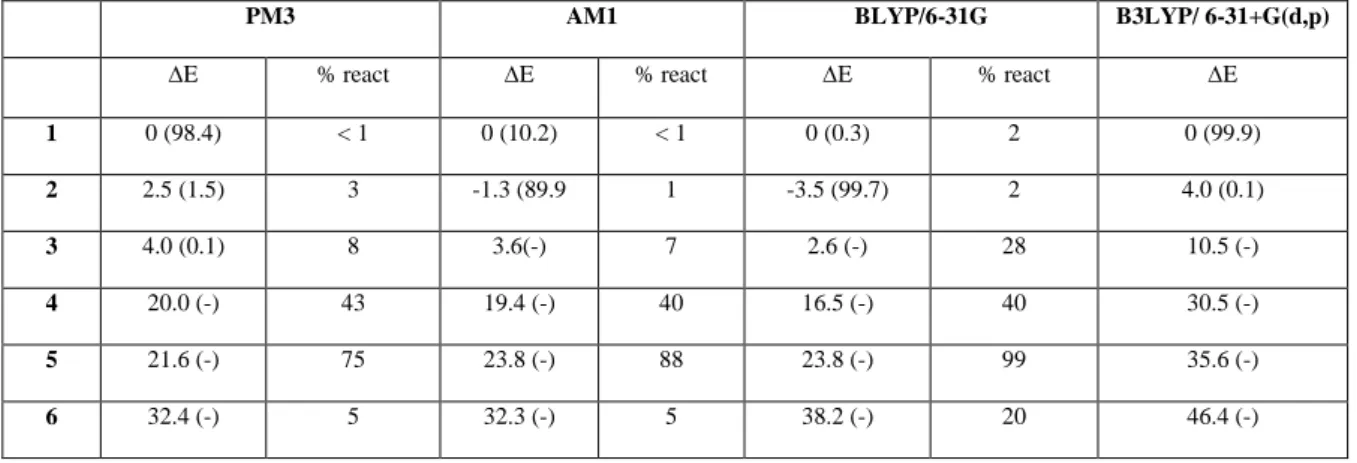
Table 1. Relative stability (kcal/mol) for different isomers obtained by geometry
optimizations and percentage of reactivity as obtained from subsequent CID simulations. In parenthesis we report the Boltzmann probability at 300 K of each isomer.
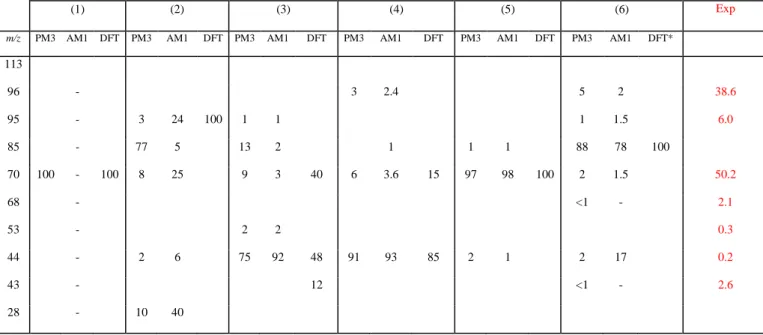
Table 2. Summary of all fragmentation obtained for different isomers in PM3, AM1 and DFT
(BLYP/6-31G) CID chemical dynamics. Results are expressed as %. Experimental abundances obtained at collision energy of 25 eV (laboratory frame) are also reported.
Figures
(a) (b)
(c) (d)
Scheme 1. Mechanisms for ammonia loss from isomer 4 (a and b) and from isomer 6 (c) as obtained in CID simulations.
Scheme 2. Mechanism for water loss as obtained in CID simulations. N N H OH O H N N OH O H N HO H N H H rotation N H N C O H2O N N H OH O H
*
Om/z 95
N N H O HO H N N H O HO H*
N N H O HO H N N H C O HO H C O N NH OH Hm/z 95
H2O rotation C O N N H 2 3Scheme 3. Retro Diels-Alder mechanism for isomer 3 as obtained in CID simulations. After this first step leading the fragment of m/z 44, a proton transfer may occur from this fragment to the other one protonating the N1 (path a), or protonating the O8 (path b).
N N H O O H H N HN C O O H H m/z 44 H H N C HN C O O H m/z 70 H H N C O H or H a) b) HN C HO m/z 70 H H N C O H 3 + + +
(0) (105) {0} {83} [0] [98] (27) (0) (76) (87) {22} {0} - {93} [23] [0] [63] [89] (16) (22) - (100) {40} {18} - {54} [35] [23] - [84] (27) (27) (94) {22} {22} {59} [23] [23] [74]
Scheme 4. Mechanisms leading to m/z 70 peak proposed by Beach.15 “( )” values correspond to the energy of each structure calculated at B3LYP/6-31G level of theory, “{ }” values correspond to the energy of each structure calculated at AM1 level of theory and “[ ]” values correspond to the energy of
HN N H OH O -HNCO HN C HO HN N H OH O H2N N H O O HN N H O OH PT NA HN HO -HNCO N N H2 OH O HO H2N N H H C O PT N H2N C OH H C HO -NCOH H2N C OH H H2N N H O O H2N N H O O H -NCOH H 2N OH
each structure calculated at PM3 level of theory. “-” is used to notate that the structure does not correspond to a minimum. All values are reported in kcal/mol.
Scheme 5. Mechanism leading to the m/z 53 peak starting from isomer 3 as obtained in CID
simulations.
Scheme 6. Mechanism leading to the m/z 43 peak starting from isomer 3 as obtained in CID simulations. N N H O HO H m/z 53 N N H O HO H H H NH NH CH C C O HO H PT 3 + N N H OH O H m/z 70 NH C HN OH O rDA HN CH m/z 28 C OH CH NH C O N N H OH O H
*
2 + + + N N H O O H H N HN C O O H H m/z 44 H H HN C O m/z 43 H H N C OH H loss H rDA 3 + + +Scheme 7. Mechanism leading to the m/z 28 peak starting from isomer 2 as obtained in CID simulations.
Table 1. Relative stability (kcal/mol) for different isomers obtained by geometry
optimizations and percentage of reactivity as obtained from subsequent CID simulations. In parenthesis we report the Boltzmann probability at 300 K of each isomer.
PM3 AM1 BLYP/6-31G B3LYP/ 6-31+G(d,p)
E % react E % react E % react E 1 0 (98.4) < 1 0 (10.2) < 1 0 (0.3) 2 0 (99.9) 2 2.5 (1.5) 3 -1.3 (89.9 1 -3.5 (99.7) 2 4.0 (0.1) 3 4.0 (0.1) 8 3.6(-) 7 2.6 (-) 28 10.5 (-) 4 20.0 (-) 43 19.4 (-) 40 16.5 (-) 40 30.5 (-) 5 21.6 (-) 75 23.8 (-) 88 23.8 (-) 99 35.6 (-) 6 32.4 (-) 5 32.3 (-) 5 38.2 (-) 20 46.4 (-)
Table 2. Summary of all fragmentation obtained for different isomers in PM3, AM1 and DFT
(BLYP/6-31G) CID chemical dynamics. Results are expressed as %. Experimental abundances obtained at a collision energy of 25 eV (laboratory frame) are also reported.
(1) (2) (3) (4) (5) (6) Exp
m/z PM3 AM1 DFT PM3 AM1 DFT PM3 AM1 DFT PM3 AM1 DFT PM3 AM1 DFT PM3 AM1 DFT*
113 96 - 3 2.4 5 2 38.6 95 - 3 24 100 1 1 1 1.5 6.0 85 - 77 5 13 2 1 1 1 88 78 100 70 100 - 100 8 25 9 3 40 6 3.6 15 97 98 100 2 1.5 50.2 68 - <1 - 2.1 53 - 2 2 0.3 44 - 2 6 75 92 48 91 93 85 2 1 2 17 0.2 43 - 12 <1 - 2.6 28 - 10 40
*For isomer 6, B3LYP/6-31G method was used since in BLYP/6-31G the ring structure is unstable during the geometry optimization (leading to an open structure).