HAL Id: hal-00785335
https://hal.archives-ouvertes.fr/hal-00785335
Submitted on 11 Mar 2014
HAL is a multi-disciplinary open access
archive for the deposit and dissemination of
sci-entific research documents, whether they are
pub-lished or not. The documents may come from
teaching and research institutions in France or
abroad, or from public or private research centers.
L’archive ouverte pluridisciplinaire HAL, est
destinée au dépôt et à la diffusion de documents
scientifiques de niveau recherche, publiés ou non,
émanant des établissements d’enseignement et de
recherche français ou étrangers, des laboratoires
publics ou privés.
Micro-organism extraction from biological samples using
DEP forces enhanced by osmotic shock
Emilie Bisceglia, Myriam Cubizolles, Frederic Mallard, Francoise Vinet,
Olivier Français, Bruno Le Pioufle
To cite this version:
Emilie Bisceglia, Myriam Cubizolles, Frederic Mallard, Francoise Vinet, Olivier Français, et al..
Micro-organism extraction from biological samples using DEP forces enhanced by osmotic shock. Lab on a
Chip, Royal Society of Chemistry, 2013, 13 (5), pp.901-909. �10.1039/c2lc41128h�. �hal-00785335�
Micro-organism extraction from biological samples using DEP forces
enhanced by osmotic shock
Emilie Bisceglia,
aMyriam Cubizolles,
aFrederic Mallard,
bFrancoise Vinet,
aOlivier Francais
cand
Bruno Le Pioufle
cReceived Xth XXXXXXXXXX 20XX, Accepted Xth XXXXXXXXX 20XX First published on the web Xth XXXXXXXXXX 200X
DOI: 10.1039/b000000x
On the road towards efficient diagnostics of infectious diseases, sample preparation is considered as the key step and remains a real technical challenge. Finding new methods for extraction of micro-organisms from a complex biological sample remains a major challenge prior to pathogen detection and analysis. This paper reports a new technique capturing and isolating micro-organisms from a complex sample. To achieve the segregation of pathogens and blood cells, dielectrophoretic forces applied to bioparticles previously submitted to an osmotic shock are successfully implemented within a devoted microfluidic device. Our device involves an electrode array of interdigitated electrodes, coated with an insulating layer, to minimize electrochemical reactions with the electrolyte and to enable long-time use. The electric field intensity inside the device is optimized, considering the insulating layer, for a given frequency bandwidth enabling the separation of bioparticles by the dielectrophoretic forces. Our predictions are based on analytical models, consistent with numerical simulations (using COMSOL Multiphysics) and correlated to experimental results. The method and device have been shown to extract different types of micro-organisms spiked in a blood cell sample. We strongly believe that this new separation approach may open the way towards a simple device for pathogen extraction from blood and more generally complex samples, with potential advantages of genericity and simplicity.
1
Introduction
The rapid detection and identification of pathogens in biolog-ical samples is a major challenge for microbiologbiolog-ical diag-nosis. Current diagnostic methods based on bacterial growth and pathogen analysis usually take between 1 and 3 days from sampling to results. In the particular case of sepsis, the ini-tial concentration of bacteria in blood is extremely low1and the reference blood culture methods allow the detection of bacterial contamination within 1 to 3 days, with additional 2 days for identification and antibiotic susceptibility testing of the pathogen. In such conditions, the diagnostic test re-sult is used as a confirmation for a therapeutic decision previ-ously taken by the clinician according to other criteria. Sev-eral analytical methods have emerged in the past years that have the potential to recover a valuable information from a reduced quantity of pathogens.2 Molecular-based methods – mostly quantitative Polymerase Chain Reaction (qPCR) – al-low for the detection of a concentration as mow as 10 bacteria in 1 mL blood in 2 hours.3 However, such methods remain
aDepartment of µTechnology for Biology and Health, CEA LETI-Minatec,
17 rue des Martyrs, 38054 Grenoble Cedex 9, France.
b bioMerieux, Technology Research Department, 5 rue des Berges, 38000
Grenoble, France.
cSATIE, CNRS, ENS Cachan, 61 av President Wilson, 94235 Cachan Cedex,
France.
costly, complex, fragile and also blind to genetic evolutions of bacteria and very dependent of the purification quality of nucleic acids before amplification. Preparation methods that would rapidly decrease the sample complexity by extracting bacteria from their complex environment would open the way not only to more robust molecular tests, but also to a range of emerging analytical methods that may be simpler and/or provide phenotype-correlated information (mass spectrome-try,4 optical spectroscopy5, 6). Some of these last methods can be very sensitive and could be applied without the time-consuming growth step of the primary sample. For example, several groups have shown the use of microspectroscopy, for single bacteria identification.7, 8
However, such methods are very sensitive to the chemical and particulate complexity of the raw samples and good separation of bacteria from the surrounding sample elements is a major challenge that is still poorly addressed by the scientific community. In the mean time, microfluidics and mi-crotechnologies have shown their potential to handle complex biological samples.9, 10 Management of sample preparation and cell sorting has been reported using a wide variety of methods, such as optical forces,11, 12, 13 magnetophore-sis,14, 15, 16 acoustophoresis17, 18, 19 or electric forces.20 Methods that rely on forces generated by an electric field gradient such as dielectrophoresis21, 22, 23, 24 are expanding rapidly due to the emergence of micro-systems technology.
Such methods provide several opportunities to cope with the lack of simple protocols for the sample preparation.
In this paper, we report a method based on the separation and concentration of pathogens from a complex biological sample, namely blood, using a dielectrophoresis (DEP) force in a highly hypotonic solution. The use of such an hypotonic solution as medium for the complex biological sample causes an osmotic shock. Taking advantage from the large tolerance of micro-organisms regarding osmotic shocks, selective lysis, or at least permeabilisation of eukaryotic cells - in particular leucocytes and erythrocytes - occurs in such conditions. This allows achieving the dielectrophoretic separation of micro-organisms versus blood cells with high efficiency.
In this paper we validate this concept, with experiments performed on a devoted microfluidic device. Two types of micro-organisms with very different structures, namely bac-teria (Escherichia coli) and yeasts (Candida albicans), could be handled on the device, and separated from red and white blood cells using dielectrophoresis forces in low conductiv-ity medium (deionized water). The structure of the device was optimised with analytical electric considerations and with numerical simulations performed with Comsol. In order to clearly understand the movement of cell populations under DEP forces, the experiments were carried out on elementary sample mixtures. These sample models demonstrate that the application of DEP forces, combined with an osmotic shock, could be used in a miniaturized fluidic device to separate micro-organisms from whole blood. The method should be robust so that separation may be achieved in a complex bio-logical fluid. We think that this approach might provide dis-ruptive solutions for in-vitro diagnostics of blood infections.
2
Extraction method using dielectrophoresis
combined to an osmotic shock
The sorting method proposed in this paper is based on the di-electrophoresis force (DEP force), which occurs when polar-isable particles are submitted to an AC electrical field gradi-ent.25 The time average DEP force on a spherical particle, in the case where the electrical field is stationary is:
h~FDEPi = 2πεmr3Re[ fCM]~∇|Erms|2 (1) where r is the particle radius, εm is the permittivity of the suspending medium, Re[ fCM] is the real part of the Clausius-Mossoti factor and Ermsis the root-mean-square electric field. The Clausius-Mossoti factor depends on the field frequency and on the electrical properties of the particle and surrounding medium, as shown in equation 2.
fCM=
ε∗p− εm∗
εp∗+ 2εm∗ (2) where εp∗ = εp− jσp/ω and εm∗ = εm− jσm/ω are the complex permittivities of the particule and the medium, ω the electric field pulsation, εp, εm and σp, σm are the permittivities and the conductivities of the particule and the medium, respectively.
The sign of the DEP force is given by the sign of the real part of the CM factor. If the particle is more polarisable than the suspending medium, then Re[ fCM] will be positive, and the force is towards the direction of the field gradient (positive dielectrophoresis or DEP+). Conversely if the particle is less polarisable than the medium, then Re[ fCM] will be negative, and the particle moves oppositely to the gradient (negative dielectrophoresis or DEP-). Both polarisabilities depend on the electrical field frequency. In the case of positive DEP, the particle motion will be induced towards the local maxima of the applied electric field, and conversely towards the local minima of the applied electric field in the case of negative dielectrophoresis.
Therefore, to perform spatial DEP separation between two particles, both Re[ fCM] must have opposite sign for a given frequency range. Such frequencies do not necessarily exist, mainly when dealing with biological cells in a physiological medium having a high electric conductivity.
An alteration of the physiological state of a cell can modify the evolution of the CM factor and can sometimes invert the sign of its real part. Indeed, DEP can be used to sort living from dead yeasts for example.26 It is precisely from this observation that we developed our sorting strategy. By using a hypotonic medium, an osmotic shock is selectively induced on blood cells. This leads to biological modifications of the blood cells, such as membrane permeabilization, and CM factor modifications.
The use of the DEP effect to handle particles in suspension within a liquid shows to be relevant in microfluidic structures as it can provide forces several order of magnitude higher than the buoyancy force, and can compete with the fluidic forces. Indeed for a bacterium, a yeast or a lysed red blood cell (re-spective diameters = 2 µm, 6 µm and 7 µm) the sedimenta-tion velocity vsdue to the buoyancy force reaches respectively 1.4 10−3µm.s−1, 1.3 10−2µm.s−1and 2 10−3µm.s−1 (equa-tion 3),27assuming the spherical shape of the cells.
vs= 2 9 ρp− ρm µ gr 2 (3)
medium, µ the dynamic viscosity, g the standard gravity and rthe particle radius. In the case of E. coli, its natural motility, which provides much higher velocities than vs,28 has to be considered. Comparatively, the DEP-induced velocity of an E. colireaches more than 200 µm.s−1.27Since the DEP force is proportional to the cell volume, this velocity is even higher in the case of yeast or blood cells. Finally when an external flow is applied during the DEP trapping experiment, the flow rate should not exceed this DEP-induced velocity to ensure an efficient capture.
However, when applying a non-uniform electric field, DEP is not the only force that can set particules in motion. AC electro-osmosis and electro-thermal effects are commonly dis-cussed.29, 30 We usually neglect these phenomena in our ex-periment interpretations because the passivation layer above the electrode pattern dramatically decreases the magnitude of these forces. Moreover, the frequencies we are working with for the binary sorting (several MHz) prevent AC electro-osmosis from interacting with DEP effects.
3
Material and methods
3.1 Device
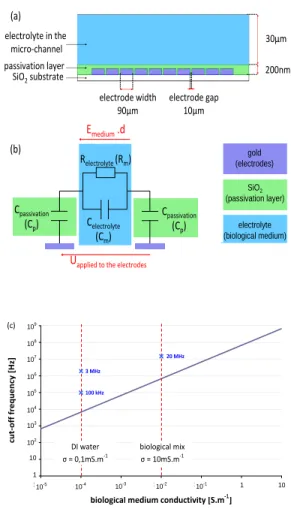
Device designThe DEP froce cell sorting device is com-posed of an electrode array of interdigitated electrodes, coated with an insulating layer, and a microfluidic chamber (see fig-ure 1a). The electrode array consists of 5 pairs of interdigi-tated electrodes (width=90 µm, gap= 10 µm). The electrodes are coated by an insulating silica layer to minimize electro-chemical reactions with the electrolyte and to enable long-time use of the device.
Device fabricationThe device was fabricated on a 4 inch silicon wafer, using standard photolithography techniques. A 1 µm silicon oxide layer is obtained by wet oxidation. Lay-ers of titanium and gold (100 and 400nm, respectively) were successively deposited by sputtering. A 200nm thick silicon oxide passivation layer is then deposited by CVD (Chemical Vapor Deposition). Double-sided tape (30 µm thick) topped over the electrodes (Nitto Denko MC-2033) is used to design the sorting chamber. The chamber is finally closed with a cov-erglass to enable microscopic observation.
3.2 Electric Field Distribution : numerical simulation with ComsolT M
We numerically solved the electric field produced by inter-digitated electrodes by using finite element analysis software (Comsol Multiphysics 4.1), taking the frequency of the elec-tric signal into account. By solving Laplace equation, the calculated potential V is used to determine the electric field
(~E = −~∇V ) from which ~Fdep is calculated (proportional to ~∇|E|2). Antiperiodic boundary conditions were imposed on both sides of the simulated channel to take into account neigh-boring electrodes, while zero charge boundary condition was imposed at the top of the channel boundary.
Table 1 experimental parameters used for numerical simulations and analytical considerations (ε0is the vacuum permittivity)
ep lgap εp εm σm
200 nm 10 µm 7,5ε0 80ε0 10 mS.m−1
3.3 Analytical model of the passivation layer
To assess its effect on the electric field in the biological medium, the passivation layer is modeled as a capacitive el-ement while the biological medium is approximated by a ca-pacitive and a resistive elements in parallel (figure 1b). We can use the transfer function of this equivalent electric circuit to evaluate the field screening effect of the passivation layer (equation 4). Indeed, the screening effect, which is a func-tion of the electrical frequency, is characterized by the ratio between the circulation of the effective electrical field in the biological medium, and the voltage applied to the electrodes.
H( jω) = Emedium.d Uapplied to the electrodes = Zm Zm+ 2Zp (4) with Zm= Rm 1+ jRmCmω, Zp= 1 jCpω, Rm= 1 σm. lgap hm.wm, Cm= εm hm.wm lgap and Cp= εphp.wp ep
where the p and m indexes stand for the passivation layer and the biological medium respectively, lgap is the mean equiva-lent path for the electric field between two electrodes, epthe thickness of the passivation layer, hm, hp, wmand wpthe car-acteristic length and width of the microchannel and the pas-sivation layer respectively. Substitution of the expressions of Zmand Zpinto equation 4 yields the expanded equation 5.
H( jω) = CpRm 2 jω 1+RmCm 2 (2 + Cp Cm) jω (5) 3.4 Sample preparation
Bacteria. Escherichia coli(strain ATCC 35421) are grown overnight in 3mL Tryptic Soy Broth medium at 30◦C. Then
a second culture at a 1:50 dilution in the same medium is performed for 2h at 37◦C. The bacteria are washed twice with de-ionised water by centrifugation at 10 000 rpm during 5 min and resuspended in de-ionised water at a cell concen-tration of 5 108colony-forming unit/mL (cfu/mL). The cell concentration is determined by optical absorbance at 550nm. We controlled bacterial viability in de-ionised water using standard plate-count method to enumerate viable bacteria.
Genetically modified E. coli cells (BL21) that produce Green Fluorescent Protein are also used : the fluorescence distribution makes the microscopic observation easier, namely when the electrode surface conditions are really poor.
Yeasts. Candida Albicans(strain ATCC 18804) are grown overnight in 10mL Sabouraud medium at 30◦C. Then a second culture at a 1:50 dilution in the same medium is performed for 4h at 30◦C. The yeasts are washed twice in de-ionised water by centrifugation at 10 000 rpm during 5 min and resuspended in de-ionised water at a cell concentration of 107cfu/mL.
Red blood cells (RBC). Human blood is collected from anonymous healthy donors in EDTA vaccum tubes (BD va-cutainer) provided by the French Blood Service. A 1mL sam-ple containing 5 109RBC/mL is centrifuged at 600g for 15 min in order to separate red blood cells from the plasma and the buffy coat. 10 µL of the centrifuged solution of RBC at a concentration of 1010cells/mL are then collected.
Cell mixtures.RBC suspension is then spiked with one of the previous micro-organism suspension, using the following ratio : 25 µL of micro-organisms suspension, 1 µL of RBC suspension and 25 µL of deionised water. In contact with this hypotonic solution, red blood cells get immediatly lysed by osmotic shock. The final concentration of micro-organisms and red blood cell ghosts in the sample are approximately 2.45 108 cfu/mL (bacteria) or 4.9 106 cfu/mL (yeasts) and 1.95 108RBC/mL, respectively. The increase of the solution electric conductivity due to RBC lysis is measured by a conductivity meter (Meter Lab CDM 210).
1.5µL of the solution is finally injected by capillarity in the micro-system. To avoid evaporation and interfering con-vective movements during the expermients, two oil drops (bioMerieux) were applied at both ends of the chamber.
3.5 Experimental setup
A 10 Vp-p sinusoidal signal was supplied by a function generator (Agilent 33250A, frequency range 0-80MHz). The electric signal parameters (amplitude and frequency) are controlled by an oscilloscope (Tektronix TDS640A). A card-edge plug-in connects the device to the generator.
Particule motion was observed with an optical microscope (Zeiss) and a x20 objective (Zeiss LD Epiplan) . The heat pro-duced by the microscope incident light did not produce any convection movement of bioparticules. Images were captured with a CDD camera (Hamamatsu Orca) with a 1344x1024 pixel2resolution (covering a 0.43 x 0.33 µm2surface). Video aquisition is performed at 3.33 frame/sec. To compute cell velocity, image interpretation of DEP experiments was per-formed using the image processing software ImageJ with the particle tracker plugin Mosaic.
4
Results and discussion
4.1 Electric field distribution and dependence with the frequency
Analytical characterization of the effect of the passivation layer. The effect of the passivation layer was characterized analytically with the model proposed in the previous section. The resulting first order transfer function (equation 4) is a high pass filter with a cut-off frequency fcand a gain G0defined by equation 6. fc= σm 2πεm 2 2+ α and Go= α 2+ α (6) with α=lgapεp εmep
Then we can assess the consequence of this high pass filter behaviour on the effective tension of the biological medium, as described by equation 7.
if f≥ fc then Emedium.d = G0.Uapplied if f≤ fc then Emedium.d = G0. f
fc
.Uapplied (7)
The electric field pulsation is thus a key parameter to deter-mine the electric field intensity within the biological medium and thus the DEP force applied to various biological particles. If the working frequency is higher than the cut-off frequency, the electric field inside the micro-channel will be hardly screened by the passivation layer. On the contrary, if lower than the cut off frequency, the passivation layer will weaken the transmitted electric field.
This cut-off frequency highly depends on the biological medium frequency (as proved by equation 6), and thus will take different values depending on the suspension medium used during the experiments (figure 1c).
With the experimental conditions used for the micro-organism extraction (described in the Results section), the cut
electrolyte (biological medium) gold (electrodes) 30µm 200nm passivation layer SiO2substrate electrolyte in the micro-channel electrode width 90µm electrode gap 10µm Relectrolyte(Rm) Celectrolyte (Cm) Cpassivation (Cp) Cpassivation (Cp) (a) (b) SiO2 (passivation layer) Emedium.d
Uapplied to the electrodes
1E+00 1E+01 1E+02 1E+03 1E+04 1E+05 1E+06 1E+07 1E+08 1E+09
1E-05 1E-04 1E-03 1E-02 1E-01 1E+00 1E+01
biological medium conductivity [S.m-1
] c u t-o ff f re q u e n c y [ H z] DI water σ = 0,1mS.m-1 biological mix σ = 10mS.m-1 10-5 10-4 10-3 10-2 10-1 1 10 1 10 102 103 104 105 106 107 108 109 3 MHz 100 kHz 20 MHz (c)
Fig. 1 (a) Description and dimensions (not to scale) of a vertical section of the microfluidic device for cell separation using DEP. (b) Electric modelisation for frequency behaviour : the device can be described as a high-pass filter. (c) Analytical modelisation of the cut-off frequency as a function of the biological medium conductivity (the other parameters used in the modelisation are given in table 1) Red lines represent the medium conductivities used in the experiments. Blue crosses give values of the working frequencies chosen for the experiments
off frequency is around 700 kHz, which indicates the electric field is hardly shielded by the passivation layer at the working frequencies chosen to perform the separation (20MHz). In ad-dition, when using the DEP force in deionised water, the cut-off frequency is much lower (around 7kHz), which enables to use lower working frequencies, such as 100kHz.
Numerical solution.The determination of the spatial distri-bution of the electric field and thus the direction of the DEP force (shown in figure 2a) enables to distinguish two specific areas : i) the edges of the electrodes that correspond to
posi-tive DEP collection zone, and ii) the top of the sorting chamber above the center of the electrodes where particles are repealed by negative DEP.
Taking into account that electric field intensity and thus DEP forces decrease dramatically with the distance from the electrodes as illustrated by figure 2b (DEP force intensity being proportional to electric field gradient, as shown in equation 1), the microsystem height is limited to 30 µm for DEP sorting: this height was set as a compromise between the sorting efficiency and the volume of the sorting chamber. It also allows the use of complex biological samples with eukaryote cells such as leucocytes without clogging the micro-system since these cells can reach a size of 20 µm.
The parametric study of the electric field estimation for dif-ferent electric signal frequencies (figure 3) confirms the pre-vious modelisation of the passivation layer which screens the electric field in the medium when the electric signal frequency is lower than the cut-off frequency.
Discussion and comparison between analytical and sim-ulation results. When computing the cut-off frequency and the gain of our micro-system high pass filter, we observed a very good fit between analytical and simulation results. These results are detailled in table 2.
Table 2 Comparison between analytical and simulation results for the estimation of the high pass filter cut-off frequency and gain
analytical results simulation results
fc 675 kHz 900 kHz
G0 0.70 0.73
The cut-off frequency determined by the analytical model involves the assumption of the mean equivalent path for the electric field between two electrodes (lgap). We can make a correlation between the analytical model and the simulation results by computing the lgap parameter used in the analytical model from the gain G0estimated by the simulation : to get a gain in the analytical model that equals the gain set by the simulation (G0= 0.73), the lgapparameter has to be revaluated to 11.5 µm. This means that the actual path of the electric field between two electrodes is slightly longer than the value of the gap.
To perform the most efficient sorting, the electric field frequency will have to be higher than the cut-off frequency. In the case where a lower frequency has to be used (in order to tune the CM factor transition), the efficiency of the DEP trap will decrease. To keep the same efficiency with low frequencies as the one we get with high frequencies, the screening can be managed by using a higher voltage on the
(a)
(b)
Fig. 2 (a)|E| distribution (surface) and ~∇|E|2direction (normalized
arrows) inside a vertical section of the sorting micro-system (simulation parameters are itemized in table 1). (b) Estimation of x and y components of ~∇|E|2for different heights above the electrodes (supply voltage frequency = 100MHz).
electrodes or by reconsidering the passivation layer thickness.
(a)
(b)
Fig. 3 (a) Estimation of|E| for different electric signal frequencies (at a given distance above the electrodes = 0µm). The estimation of |E| with no passivation layer is given as a reference to compute the electric field screening produced by the passivation layer. (b) Evolution of|E|maxin the micro-channel (at a given distance above
the electrodes = 0µm) as a function of the frequency.
One main benefit of this passivation layer is to decrease dra-matically the AC electro-osmosis and electro-thermal effects that commonly appear beside DEP force when non-uniform electric field is applied. Moreover, the frequencies used for the binary sorting (several MHz) prevent AC electro-osmosis from interacting with DEP effects. These phenomena will be thus neglected in our experiments interpretations.
In order to validate the proposed methodology, all experi-ments described here after were carried out in low conductiv-ity medium. In deionised water, the microbiological sample has a conductivity around 0.1mS.m−1. When dealing with red blood cells, the cell lysis can increase the conductivity of the sample up to 20mS.m−1.
4.2 Handling micro-organisms using the DEP force The working frequencies we used to perform DEP+ and DEP-on micro-organisms (3MHz and 100kHz, respectively) are higher than the cut-off frequency we computed previously (around 7kHz when σbio = 0.1 mS. m−1). Thus we can as-sume that the passivation layer doesn’t screen the electric field within the biological medium.
Handling bacteria by DEP.Figure 4a displays how fluores-cent E. coli bacteria distribute within the device while an AC electrical field is applied. Micro-organisms are collected at the edge of the electrodes when they exhibit positive DEP at 3MHz, while they levitate on the top of the fluidic chamber, above the center of the electrodes in the case where they exhibit negative DEP at 100kHz.
Either in positive or negative DEP regime, we observed that E. colibacteria lined up with the field lines. This behavior, described as electro-orientation has already been noticed and explored in other papers.31, 32This phenomenon is especially striking in these E. coli experiments because of their rod shapes.
Handling yeasts by DEP.Figure 4b displays how C. albi-cansyeasts distribute within the device while an AC electrical field is applied. Both equilibrum DEP positions are the same as in the previous E. coli experiments. When submitted to DEP- at 100 kHz, yeasts get collected in levitation at the top of the chamber. When submitted to DEP+, yeasts gather at the edges of the electrodes at 3MHz.
Some cells do not exhibit the same general trend, as shown especially on figure 4b. Some yeasts (5%) are adsorbed on the silicon oxide bottom surface of the device, and the DEP force is not high enough to desorb them. Some other yeasts (15%) stay in low electrical field regions (DEP-) independent of the signal frequency. This effect is certainly a consequence of the electropermeabilisation of the yeast walls. We already noticed in previous work the general trend of permeabilised cells to obey DEP-.33
For both E. coli bacteria and C. albicans yeasts, the DEP force is far more intense than the buoyancy, and thus the cells levitate above the electrodes in a DEP- equilibrium position.
4.3 Pathogen separation from blood cells in a low con-ductivity medium
In order to get a relevant behavior of the mixtures, comparable to the one of clinical samples, we selected biological species that present similar shapes and structures to the ones found in real blood samples. So mixtures of blood cells with E.
coli bacteria or C. albicans have been used to validate our methodology.
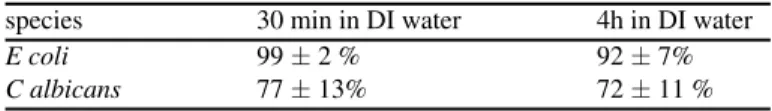
The dilution of the sample in low conductivity medium allows both positive or negative DEP, when tuning the field frequency. As it is an essential step in our binary sorting protocol. Indeed, lowering the biological medium osmolarity selectively disrupts the membrane of the blood cells. Such a lysis occurs on red blood cells,34whilemostmicro-organisms keep functional thanks to their robust cellular walls (table 3). Following this osmotic shock, blood cells populations and microorganisms will be directed oppositely by the DEP force when immersed in the same electric field gradient.
Table 3 Viability of micro-organisms once suspended in deionised water (viability assessed by a standard agar plate count method35) species 30 min in DI water 4h in DI water
E coli 99± 2 % 92± 7%
C albicans 77± 13% 72± 11 %
Figure 4c-d illustrates the spatial DEP separation of micro-organisms from red blood cells. This separation has been tested with different mixtures (E. coli (4c) and C. albicans (4d)).
When submitted to a 20MHz frequency signal, more than 92% of micro-organisms experimence a DEP+ force and thus concentrate on the edges of the electrodes (table 4). Simultaneously, altered red blood cells experiment a DEP-force and gather on the top of the micro-system above the center of the electrodes.
Table 4 Micro-organisms trapping (DEP+) and release (DEP-) efficiency
species trapping by DEP+ (20 Mhz) release by DEP- (50 kHz)
E. coli 97 % 94 %
C. albicans 92 % 56 %
The release efficiency (table 4) was determined using only the DEP- force to repel the micro-organisms. While the majority of E. coli can be released by a DEP- force, only half of the yeasts are removed from the surface of the gap-electrode interface. The difference in the release rate between E. coli and C. albicans can be explained by the motility of E. coli cells that prevent them from non-specific interactions with the surface of the device. The use of an external flow could be a good option to increase this release rate.
Fig. 4 Illustration of negative and positive dielectrophoresis for fluorescent E. coli (a) and C. albicans (b). Micro-organisms exhibiting DEP+ collect at the edge of the electrodes (frequency = 3MHz), whereas micro-organisms exhibiting DEP- levitate on the top of the chamber, in the center of the electrodes (frequency = 100kHz). Illustration of negative and positive dielectrophoresis respectively for red blood cells and E. colibacteria (c) or C. albicans yeasts (d) separation in low conductivity medium (σ = 10 mS.m−1, f = 20MHz). Magnification shows a lysed red blood cell, a E. coli bacterium and a C. albicans yeast.
Fig. 5 White blood cells undergoing negative dielectrophoresis ( f = 20MHz)
The DEP behavior of white blood cells (WBC) in low os-motic medium was also investigated. A high concentrated WBC solution (prepared with a BD vacutainer CPTT M follow-ing manufacturer instructions) was used to carry out this ex-periment, since a low concentration of WBC in whole blood is not convenient for properly characterizing their DEP response. White blood cells undergo the same DEP- movement than red blood cells (figure 5).
4.4 DEP force and bacteria velocity
From equation 1, we can theoretically compute the velocity of the cells, as they obey to Stokes’ law in the micro-channel (equation 8).
vcell∝ ∇|E|2 (8)
To ensure that DEP is the only force that sets the cells in motion without the interaction of any other electrohydrody-namic forces, an analysis of the cell trajectory and velocity was performed.
The positions of 40 E. coli cells were tracked during the DEP+ stage (working frequency = 20MHz) and then plotted as a function of the distance from the electrode gaps (figure 6). Each data set corresponds to one tracked cell. The clos-est the bacterium is to the gap, the highclos-est its velocity. Since the evolution of E. coli velocity in the x-direction fits perfectly with the x-component of ∇|E|2distribution, this confirms our supposition that dielectrophoresis is the only force that gov-erns cell motion, being much more intense than buoyancy of fluidic forces. 0 10 20 30 0 50 100 150 x [µm] 200 250 300 e x p e ri m e n ta l c e ll s p e e d [ µ m / s] 0 1 2 x -c o m p o n e n t o f si m u la te d e le c tr ic f ie ld ² g ra d ie n t [x 1 0 1 5 V 2.m -3]
Fig. 6 Experimental E. coli velocity evolution with the distance from the electrode gaps (dark grey areas) and simulated
x-component ∇|E|2(red line). Each data set corresponds to one E. colicell trajectory. The x-component of ∇|E|2is computed for a height = 2µm above the electrodes. This confirms the proportional relationship between the cells experimental velocity and the x-component of ∇|E|2.
5
Conclusions
In this study, we developed a method and an associated microfluidic device for the extraction and concentration of pathogens from a suspension of blood cells. This device has been optimised with analytical and numerical electric considerations. Our method is based on the large tolerance of micro-organisms towards osmotic shocks. A hypotonic medium selectively alters blood cells and changes their dielectric properties while keeping most micro-organisms functional. This osmotic shock homogenizes the reaction of altered blood cells in a field gradient, as they experience negative dielectrophoresis, while micro-organisms experience positive dielectrophoresis. Interdigitated electrodes were used to create a highly non-uniform electric field required to perform the dielectrophoretic sorting. The performance of the device was validated on two very different pathogen species: indeed the generic aspect of the method is a key issue, as the nature of the pathogen is usually not known prior to its isolation in real biological samples. Nevertheless, this method requires the use of a low osmolarity suspension medium : a dilution of the analyte is thus essential. In order to improve this step, a carrier medium exchange module should be integrated upstream in the microfluidic device.
critical gap in sample preparation between the collection of potentially contaminated samples and the analysis of pathogens in the case of blood contamination. Our results demonstrate the feasibility of pathogen extraction from a complex sample such as blood, using the combination of DEP forces and osmotic shock. We believe that developing this approach could provide the de-complexification step needed upfront of bacterial characterization methods (optical spec-troscopy, mass spectrometry, sequencing) that are known to be strongly affected by the chemical and physical complexity of raw samples.
References
1 L. G. Reimer, M. L. Wilson and M. P. Weinstein, Clinical Microbiology Reviews, 1997, 10, 444–465.
2 N. Mancini, S. Carletti, N. Ghidoli, P. Cichero, R. Burioni and M. Clementi, Clinical Microbiology Reviews, 2010, 23, 235–251. 3 R. P. H. Peters, M. A. van Agtmael, S. A. Danner, P. H. M. Savelkoul and
C. Vandenbroucke-Grauls, Lancet Infectious Diseases, 2004, 4, 751–760. 4 E. N. Ilina, A. D. Borovskaya, M. M. Malakhova, V. A. Vereshcha-gin, A. A. Kubanova, A. N. Kruglov, T. S. Svistunova, A. O. Gazarian, T. Maier, M. Kostrzewa and V. M. Govorun, Journal of Molecular Diag-nostics, 2009, 11, 75–86.
5 R. M. Jarvis and R. Goodacre, Analytical Chemistry, 2004, 76, 40–47. 6 K. Maquelin, C. Kirschner, L. P. Choo-Smith, N. van den Braak, H. P.
Endtz, D. Naumann and G. J. Puppels, Journal of Microbiological Meth-ods, 2002, 51, 255–271.
7 W. E. Huang, R. I. Griffiths, I. P. Thompson, M. J. Bailey and A. S. White-ley, Analytical Chemistry, 2004, 76, 4452–4458.
8 P. Rosch, M. Harz, M. Schmitt, K. D. Peschke, O. Ronneberger, H. Burkhardt, H. W. Motzkus, M. Lankers, S. Hofer, H. Thiele and J. Popp, Applied and Environmental Microbiology, 2005, 71, 1626–1637. 9 J. El-Ali, P. K. Sorger and K. F. Jensen, Nature, 2006, 442, 403–411. 10 H. Andersson and A. van den Berg, Sensors and Actuators B-Chemical,
2003, 92, 315–325.
11 M. P. MacDonald, G. C. Spalding and K. Dholakia, Nature, 2003, 426, 421–424.
12 A. Jonas and P. Zemanek, Electrophoresis, 2008, 29, 4813–4851. 13 J. Enger, M. Goksor, K. Ramser, P. Hagberg and D. Hanstorp, Lab on a
Chip, 2004, 4, 196–200.
14 N. Pamme and C. Wilhelm, Lab on a Chip, 2006, 6, 974–980. 15 J. Jung and K. H. Han, Applied Physics Letters, 2008, 93,. 16 K. H. Han and A. B. Frazier, Lab on a Chip, 2006, 6, 265–273. 17 A. Lenshof, C. Magnusson and T. Laurell, Lab on a Chip, 2012, 12, 1210–
1223.
18 T. Laurell, F. Petersson and A. Nilsson, Chemical Society Reviews, 2007, 36, 492–506.
19 J. J. Shi, X. L. Mao, D. Ahmed, A. Colletti and T. J. Huang, Lab on a Chip, 2008, 8, 221–223.
20 J. Voldman, in Annual Review of Biomedical Engineering, 2006, vol. 8, pp. 425–454.
21 R. Pethig, Biomicrofluidics, 2010, 4,.
22 M. P. Hughes, Electrophoresis, 2002, 23, 2569–2582.
23 K. Khoshmanesh, S. Nahavandi, S. Baratchi, A. Mitchell and K. Kalantar-zadeh, Biosensors & Bioelectronics, 2010, 26, 1800–1814.
24 S. Park, Y. Zhang, T. H. Wang and S. Yang, Lab on a Chip, 2011, 11, 2893–2900.
25 H. A. Pohl and I. Hawk, Science, 1966, 152, 647–649.
26 X. B. Wang, Y. Huang, J. P. H. Burt, G. H. Markx and R. Pethig, Journal of Physics D-Applied Physics, 1993, 26, 1278–1285.
27 A. Castellanos, A. Ramos, A. Gonzalez, N. G. Green and H. Morgan, Journal of Physics D-Applied Physics, 2003, 36, 2584–2597.
28 J. G. Mitchell and K. Kogure, Fems Microbiology Ecology, 2006, 55, 3– 16.
29 J. Oh, R. Hart, J. Capurro and H. Noh, Lab on a Chip, 2009, 9, 62–78. 30 A. Ramos, H. Morgan, N. G. Green and A. Castellanos, Journal of
Physics D-Applied Physics, 1998, 31, 2338–2353. 31 J. Gimsa, Bioelectrochemistry, 2001, 54, 23–31.
32 M. Kriegmaier, M. Zimmermann, K. Wolf, U. Zimmermann and V. L. Sukhorukov, Biochimica et Biophysica Acta (BBA) - General Subjects, 2001, 1568, 135–146.
33 F. Hamdi, O. Francais, E. Dufour-Gergam and B. Le Pioufle, Nanobiotech, Montreux (Switzerland), 2001, 23.
34 G. Schwoch and H. Passow, Molecular and Cellular Biochemistry, 1973, 2, 197–218.
35 V. Jasson, L. Jacxsens, P. Luning, A. Rajkovic and M. Uyttendaele, Food Microbiology, 2010, 27, 710–730.