HAL Id: halshs-00654530
https://halshs.archives-ouvertes.fr/halshs-00654530
Submitted on 2 Jan 2012
HAL is a multi-disciplinary open access
archive for the deposit and dissemination of sci-entific research documents, whether they are pub-lished or not. The documents may come from teaching and research institutions in France or
L’archive ouverte pluridisciplinaire HAL, est destinée au dépôt et à la diffusion de documents scientifiques de niveau recherche, publiés ou non, émanant des établissements d’enseignement et de recherche français ou étrangers, des laboratoires
Mental maps of students - Volume 5
Clarisse Didelon, Sophie de Ruffray, Arnaud Brennetot, Karine Emsellem,
Bénédicte Garnier, France Guérin-Pace
To cite this version:
Clarisse Didelon, Sophie de Ruffray, Arnaud Brennetot, Karine Emsellem, Bénédicte Garnier, et al.. Mental maps of students - Volume 5. 2011. �halshs-00654530�
Cross Country Synthesis on Survey (deliverable 2.6)
Volume 5
Part 3 - Europe as seen by the students surveyed Sub-section 5.1: Clarisse DIDELON and Sophie de RUFFRAY
(CNRS-UMR IDEES)
Sub-section 5.2: Arnaud BRENNETOT (CNRS-UMR IDEES) Karine EMSELLEM (CNRS-UMR Espace)
5
Europe as seen by the students surveyed
5.1 Mental maps of Europe: A fuzzy but consensus vision of Europe
The aim of the EuroBroadMap survey was to find out non-European points of view about Europe. However the last part of the questionnaire introduces some specific questions about Europe. The first one (Question D1) was based on an enlarged map of Europe where the students were asked to drawn the limits of Europe. The first part of this report presents the implementation of the survey and the methods used to analyse the mental maps gathered. Then, the second part presents the results. It shows that students share a consensus but fuzzy mental representation of Europe.
5.1.1 Context and methods Context
The European Union’s enlargement process raises the problem of the definition of what is Europe, and of the definition of its spatial limits. The cartography of the mental representation of Europe has already been ex-plored. In 2005, a survey has been made in the ESPON program, involving geographers and spatial planners (Didelon and Grasland, 2006[35], Didelon, 2010[33]). However, this survey provided a representation of Europe from a European point of view, and more, from a specific one because the public sur-veyed was implicated in a research program funded by the European Union: they were particularly aware of European subjects and the method used in the previous survey focuses the analysis on the country level. The aim of the method implemented in the EuroBroadMap project allows refining the car-tographic representation, and then the analysis of the mental representation of Europe. Our approach is at the crossroads of methods and concepts of mental maps (Lynch, 1960[74]; Cauvin, 1997[25]; Gould and White, 1974[50]; FrÃľmont, 1976[44]; Moles and Rohmer, 1978[78]) with the aim of catching interpretations of Europe. The survey, done in various European and non-European countries, will allow of comparing the representation of Europe all over the world and to confront both perspectives in order to go beyond the Eurocentric perspective.
Psychologists were the first to focus on cognitive space, with the hypoth-esis that space is full of meanings and values. The latter are specific to each individual, but with collective studies, it is possible to sum up more or less shared characteristics. The expression “mental maps” covers different productions from the “cognitive-behaviourism” movement. This movement appeared in the 1970’s in the United-States (Gold, 1992[49]), mixed the fields of perception and imagination and sought to analyse the links between representation and action (Lynch, 1960[74]; Gould and White, 1974[50]).
Our survey can be included in the “interpretative mental maps” category (Didelon et al., 2011[34]). This type of mental map is characterised by the instructions provided during the survey: one have to provide its appreciation or to define a phenomenon in space. In this situation, the researcher neither seeks to know how one draws a space, nor to determine its knowledge level, but rather how one defines a particular phenomenon in a space on a pro-vided base map. Unlike conventional mental maps, the starting point of the analysis is not the individual (their knowledge or practice), but the space on which the analysis focuses that has to be think globally when doing the exercise.
The analysis of the map obtained is then easier, because the researcher can compare the “real” and “interpreted” spaces. Certainly, knowledge and affects have an influence on the realisation of the maps, but the drawing of a space on a map allows of eliminating partly them and going deeper in the analysis.
Precisions of the question in the survey
The students surveyed were asked to: “On the following map draw a line around Europe outlining its borders according to your opinion”. A map was provided with the question (Figure 43). The instruction deliberately gave no precision about the meaning of “Europe”. The aim was to discover what the students surveyed imagined in a spatial perspective when it comes to “Europe”. Names of countries were added to the map, in order to help extra-European students to identify the countries, after a test phase to measure the possible effects of such a decision (see the report on the test phase, del 2.2).
After the data entry of text questions, all the questionnaires were sent to the lead partner of the project in order to digitalise the maps. The maps were scanned and then digitalised on ArcGis with ArcScan tool that allows following exactly the lines drawn by the students. Some students did not answer the question: it was filled in in many questionnaires but it happened that it was not possible to digitalise the maps. Some rules have been implemented during the test phase in order to apply the same procedure for each map.
When the question is filled in, it is possible to use the majority of the questionnaires without any hesitation in an analysis, because “Europe” is simply and clearly circled. A particular case of the circling configuration occurs when the Europe is partly drawn and the student partly used the borders of the map as a limit. But that configuration raises no problem for the digitalisation (Figure 44).
In some cases, there is also no problem, because it is unthinkable to analyse the map provided. More often, it is because there are short and unclosed lines, mainly on terrestrial space. The following maps illustrate the kinds of Europe map not included in the analysis (Figure 45). It was not
Figure 43: Europe map in the questionnaire
Figure 45: Maps excluded from the sample
possible to decide what belongs to Europe or not.
The most difficult situation is the one where the person in charge of the digitalisation had to make a decision about what to digitalise. This was the case for about 10% of the maps of our sample. Figure 46 shows the different situations and the rules applied to each situation. In this table, the maps presented were collected during the test phase.
Using these rules, finally, about 16% of the maps have not been dig-italised, but 7852 Europe maps have been gathered in order to be anal-ysed. The percentage of maps digitalised reaches 100% in Portugal and has high figures in Malta, Turkey, China, and Hungary. It was relatively low in Cameroon, Azerbaijan, and India (less than 75%) (Figure 47).
All the “Europe” polygons have been gathered in one shape file by place of survey. The particularity of these interpretative mental map lies in the fact that the spatial objects which the respondents were asked to draw were deliberately left undefined. Resolving any uncertainty as to “Europe” is left to the own-capabilities of the observer to manage with information according to their own education, their own character, their own culture, their own his-tory. . . More, they can have hesitations or doubts when facing the difficult exercise of drawing a mental map. Imprecision lies in how the “Europe” re-gion is composed when the interpretative mental map is drawn. Indeed, the transition from individual maps towards a collective synthetic map is based on the assumption that, beyond the multiplicity of personal representations, some common mechanisms are expressed in knowledge and perception. In-deed, the respondent is a unique individual but is also socialised. This implies a relative consistency in the mental patterns of the sample. The transition from individual to collective is then made easier by the choice of interpreta-tive maps: clear instructions and a basemap have been provided. However, if the individual representations are quite precise (limits are clearly drawn), the transition to the collective level always introduces imprecision. The map
superposing all the Europe maps drawn by the Maltese sample members (Figure 48) provides an example of the raw material gathered during the survey.
Figure 47: Percentage of maps digitalised compared to the number of ques-tionnaires gathered
Figure 48: Europe as drawn by the Maltese students (Valetta)
The lines are concentrated in some areas (the Straits of Gibraltar for example), but are more scattered in others, such as in the north of Great Britain or in Caucasia.
5.1.2 Results
In order to map and analyse the information gathered during the survey, we intersected the polygons tracing the lines of Europe with a grid covering all the space of the map. The size chosen for the squares were 50 km. This size allowed of getting enough information on small countries such as Malta and, at the same time, did not generate too many squares (which would have slown down the calculation). The principle was to count how many times a square of the grid is included in a Europe polygon. We can then map the extension of Europe for each country, for the entire sample. The aim is to catch the imprecision introduced by the collective level.
The global idea of “Europe”, according to the students
Figure 49 shows the frequency of inclusion in Europe of each square of the grid, for the entire sample. The modalities of the extension of Europe are quite different, depending on the direction. This map shows a clear gra-dient of inclusion-in-Europe that could be interpreted as a kind of gragra-dient of “europeanity” (LÃľvy, 1997[69]). It covers mainly Western Europe and particularly the six founder states of the European Union (France, Germany, Belgium, Luxembourg, the Netherlands, and Italy), for which the inclusion frequency is 95%. It has then an extension toward the Iberian Peninsula and some countries from Central Europe (Poland, the Czech Republic, Slo-vakia, Austria, Hungary, and Slovenia). Then it weakens slightly to the west (Ireland and the UK), to the north (Scandinavia) and especially to the east, where many new EU members are in an intermediate situation (with an inclusion frequency between 60% and 80%).
This configuration allows of observing a distinction between an inner circle and a more distant periphery, which strangely enough includes Greece at the same level as Bulgaria or Romania. The Russian Federation and Turkey—and this is consistent with the design of the outer limits (Figure 50)—are still less included in the vision that the students have of Europe, with a frequency level of inclusion between 20% and 40%.
Figure 49: Extension of Europe according all students surveyed
The extension of Europe as seen by the students has four main properties: • The area of highest concentration (more than 95% of the respondents of inclusion) is very small and follows the boundaries of the countries. It covers only a few countries, which can be identified as the six founder member states of the European Union in 1957, plus Switzerland. Stu-dents generally consider the unity of each country, even if the history is not in agreement, especially for Germany;
• A very low frequency (less than 5% of the sample) of inclusion is found for the countries of the southern Mediterranean shore and the Arabian Peninsula. The border follows the southern border of these countries (see Algeria, Libya). Concerning this space, the level of discontinuity is very high between Southern Europe (Spain) and northern Morocco, confirming the importance of the Straits of Gibraltar’s being perceived as a limit. The discontinuity is less strong with Turkey on the Dard-anelles strait because the level of inclusion of Eastern Europe is low; • The level of inclusion decreases regularly in two spaces: the Russian
Federation and the Atlantic Ocean. In those spaces, the decreasing level of inclusion is not due to this border but to a fuzzy delimitation of Europe more linked to the graphic form often use to draw the limits of Europe: a large circle. The different size of this circle can be very well observed in the Atlantic Ocean;
• An area appears as very much included in Europe. This area matches with the picture of the European Union before the 2004 enlargement as it does not include the countries that belonged to the area of the Soviet Union. Yet, the “Iron curtain” seems quite present as there is a strong discontinuity between Germany, Austria, and Italy on the one hand, and Poland, the Czech Republic, Slovakia, Hungary, and Slovenia on the other hand. This pre-2004 vision of Europe is tempered by the discontinuity with Greece that was a member of the EU since the 80s. This interpretation is also tempered by the case of Switzerland that is among the countries the most included within the limits of Europe and that is not a member of the EU and not even a candidate. The hypothesis in this case in that a principle of contiguity was applied in the drawing. Three EU founder countries have a common border with Switzerland: Italy, France, and Germany. The case of the UK is also particular because of the discontinuity in the inclusion. It is due to the exclusion of the UK in many cases, mainly by Indian students, because they follow the main coast lines and forgot all the islands in many cases.
In conclusion, the conflation between Europe and the European Union seems strong when students are asked to draw the limits of Europe and the
degrees of inclusion in Europe are strongly correlated with the dates of entry of countries into the European Union as member countries. This observation is partly confirmed by Figure 51. The non-EU members show very low figures (about 20%). However, the variance in this category is very high and can be explained by the variation of the distance from the European Union founder members. The frequency of inclusion is high for all other categories (more than 80%) but does not follow strictly the membership diffusion: for example the EU candidate countries are more included than the countries from the 2004 enlargement. One reason is possibly the distance of some countries from the heart of the European Union together with their peripheral position and their relatively small size. This is mainly the case with Cyprus and Malta, but also the Baltic countries. The six founder countries of the European Union show the highest inclusion level, close to 100%14.
Figure 51: Frequency (%) of inclusion of countries in Europe regarding their status vis a vis European Union
Countries’ variation in the drawing of Europe A consensus drawing of Europe
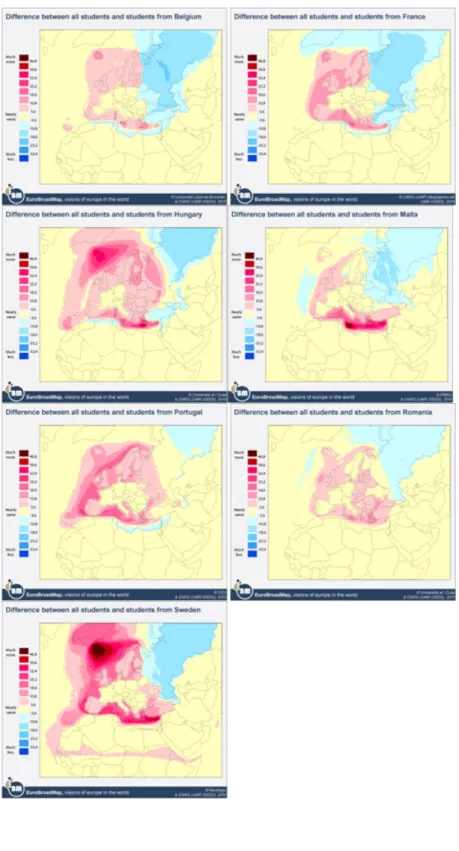
This part focuses on the variation of the drawing of Europe according to the country where the survey took place. The maps presented here show the differences between each country surveyed and the entire EuroBroadMap sample. The representations of inclusion-in-Europe are presented in a per-spective of comparison between the students in the member States included in the European Union, the students in the neighbouring countries, and the students in remote countries. However, the first striking observation one 14This analysis should be deepened by building a model introducing both the distance
from the heart of the European Union (let’s say Brussels) and the membership status regarding the European Union.
Figure 52: Correlation of countries surveyed
could make is that the mental representation of Europe seems to enjoy a firm consensus. Indeed, a correlation matrix displaying the correlation in-dices measuring the relation between all the countries of the sample shows very high positive values between all countries (Figure 52). The figures are the same when the correlations are calculated on the country level of inclu-sion and on the squares of the grid level of incluinclu-sion. Even the minimum and maximum value of correlation are observed between the same countries. The strongest correlation can be observed between Belgium and France. Figure 53 shows that students in both countries have roughly the same be-haviour. However, this does not imply an always perfect correlation between the countries. The lowest correlation (however very high) can be observed between Sweden and India. Figure 54 shows that the students in both coun-tries show the same pattern of inclusion in and exclusion from Europe for a large number of countries. However, for a certain group of countries, the stu-dents from India and Sweden show different inclusion levels. Indian stustu-dents include more often Mongolia (+16 points), Kazakhstan (+12) and China (+11) in Europe, while Swedish students include more often Iceland (+74), Malta (+57), Cyprus (+55), Ireland (+35), Morocco (+35), and the United Kingdom (+32). This observation confirms that even if the drawing of Eu-rope is very consensus, some real differences exist and it is worth while to analyse them.
In the following maps (Figures 55, 56, and 57), the red squares show the places more frequently quoted by the students of the surveyed countries, in blue the contrary. Some European countries are often shown in yellow. This means that the students of the analysed country merely agree with the rest of the sample. This means that if students of this country often included France in the limits of Europe, such is also the case for the rest of the sample. Some countries in the east and the south of the map appear
Figure 53: Correlation between France and Belgium (highest correlation)
also quite often in yellow. They figure as the space for which students of the country analysed agree with the rest of the sample: this space is, in all countries surveyed, not very often included in Europe.
European Union countries
The European Union countries maps have generally the same configura-tion with more and less intensity. Generally, the European Union stu-dents differ from the rest of the sample, in two areas. The rest of the students surveyed included more of the Eastern countries, in particular, Rus-sia, than did the European Union students. The border follows the southern border of the countries (see Algeria, Libya). Concerning this space, the level of discontinuity is very high between Southern Europe (Spain) and northern Morocco, confirming the importance of the Straits of Gibraltar perceived, as a limit.
As far as the European Union students are concerned, we observe that the Atlantic side of Europe, Scandinavia, Baltic countries, the Mediterranean Is-lands, and the Northern part of the Mediterranean Sea are much more quoted than by the entire sample. This figure could be explained by the fact that these students did not often follow the coast in their drawing, but included large parts of water in a circle, when the western part is concerned. Con-cerning the countries, these students seem to include more Nordic countries, Ireland and the UK, Spain and Portugal, and very much more often Iceland and Malta. European peninsulas are not forgotten, even more if they be-long to the European Union (Iberia and the Greek peninsula) neither are European islands. In addition, Iceland is more considered as belonging to Europe by the European Union samples than by the whole sample. The students generally included the EU members Estonia, Latvia, and Lithua-nia. For example, the UK, which is a country positively perceived by the European Union students, but which unlike other European countries, is not as emphatically included within the limits of Europe. This may suggest that the identification of European countries may be linked to the presence of a common currency to which the UK does not subscribe and possibly also to certain common laws in the whole of the EU which take a different form in the UK.
On the other hand, large parts of the southern Mediterranean Sea and a large part of Russia are less quoted. The European Union students are more eager to follow the western border of Russia in drawing the limits of Europe and then include less often this part of the map, maybe for the reasons pointed to before. A tendency, which can be observed in a few country samples (Romania, Portugal, Hungary, and Sweden), is clearly the drawing of Europe towards the east, more than the whole sample. The students interviewed have a larger vision about the extension of Europe to the east and southeast, including the new EU member states, as well as the rest of the Balkans.
Another characteristic is represented by the Swedish and Hungarian stu-dents. They extended Europe to the northwest Atlantic region, especially in connection with Iceland, which was alluded to as part of Europe by these
students more often than average.
Turkey is represented in an ambiguous way by the students of the Euro-pean Union countries. On the one hand, the Maltese and Swedish students, and to a lesser extent the Romanian, integrated clearly Turkey within the limits of Europe. The Belgian, French, and Hungarian students integrated Turkey less often than did the whole sample. In the case of France, pol-itics and the media explain this kind of result because they often present the inconveniences of the entry of Turkey into the European Union. There is considerable debate about the EU expansion and, in some countries, a significant opposition to include this country as a member state. Another particularity concerns the French students: they include very much less of the northern part of the map, including Greenland. They seem not to per-ceive the political importance of the Arctic Sea in the perspective of global warming for the European Union.
Finally, the Maltese and Swedish students tend to represent strongly their countries and the close space inside Europe. However, the largest dif-ference is seen in the perception of Malta itself. Maltese students emphasised the position of Malta in Europe, a perception which is not congruent with the perceptions of students in the whole sample. The geopolitical ambigu-ity of Malta’s position on the border of Europe and Africa is reflected in the ambiguous perception of Malta in Europe and further emphasises the notion of the Maltese as “ambivalent Europeans”. According to the map, Swedish students are much more likely to include northern countries in Eu-rope. This is particularly evident in Iceland’s case, where the inclusion rate was more than 46.8% higher than the overall total. This trend also extends to Greenland, where the inclusion rate was 25% higher than average. This is particularly evident in the north, which is unsurprising considering their geographic proximity to the region.
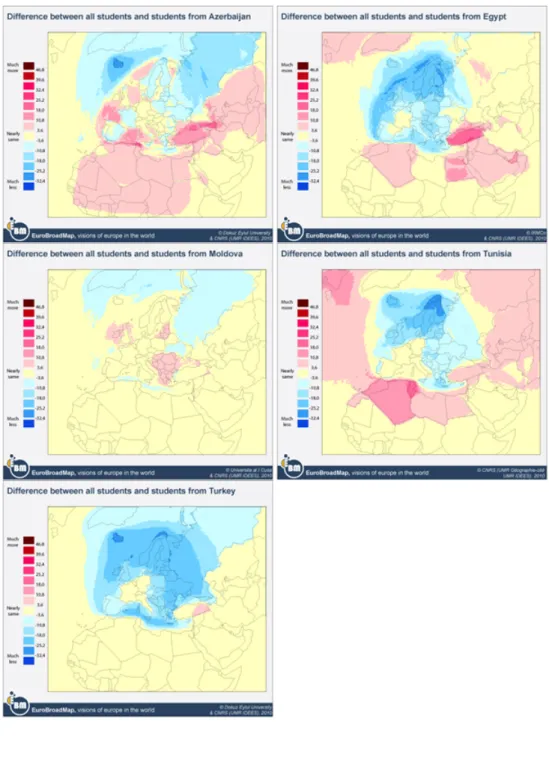
Southern and eastern neighbours
The southern and eastern neighbours’ maps present generally three kinds of configuration with more and less intensity. The vision of the students creates spaces where the membership in Europe is much more ambiguous.
The first configuration is represented by the Turkish students. Countries (in yellow) such as Italy, France, Belgium, the Netherlands, and Germany, are included at nearly the same rate as by the Eurobroadmap sample stu-dents. Iceland and the northern coast of Norway are less considered to be in Europe by the Turkish students than by the whole sample. The eastern lands of Turkey are more often included in Europe by the Turkish students than by the Eurobroadmap sample. This means that some of the Turkish students evaluated Turkey as a whole, while the sample of Eurobroadmap divides Turkey into two parts: one being European, the other Asiatic. The rareness of the number of countries in dark colour indicates that the Turkish students have nearly same vision as the sample of Eurobroadmap. Also, at
the eastern and northern borderlines, the level of difference between Turkey and Eurobroadmap increases.
The second configuration, represented by the Moldavian students, is more neutral. The small differences do not necessarily mean a unity of the percep-tions. The nature of the European vision of Moldavian students, close to the average of all students interviewed, can be explained more by the position in between spaces of the country and less by other parameters that can be taken into consideration (distance, ideology, spatial practice). The relatively lower knowledge about the Atlantic and Mediterranean peripheries (with the exception of Ireland and the UK) is explained by the symbolic construction of the European space, focalised on the economical, cultural, and political heart of the continent (Western Europe). Eastern “peripherals” (Ukraine and the Russian Federation), less present in “the Moldavian Europe”, could indicate a pro-European attitude of the students, which would explain the slight over-representation of some of the new member states (the Baltic ones, Bulgaria, Hungary, Romania) and of the western Balkans.
The third configuration was drawn by the Tunisian, Egyptian, and Azer-baijani students. Europe is smaller in the high level of inclusion and larger in the low levels of inclusion. The area where these students match the rest of the sample is small concerning European countries. It is clearly limited to two or six European Union member states (France and a part of Spain). On the other hand, North African countries are very much more included in Europe and more particularly Tunisia, Turkey, the Arabian Peninsula, Central Asia, but also Algeria and Morocco. The eastern and western parts of the maps are also more included in Europe compared to the rest of the sample, showing perhaps a particularity of drawing limits in the Tunisian and Azerbaijani samples: it is possible that a significant number of students used the limits of the map to draw the limits of Europe. In the south, below the southern border of the North African countries, these samples match again the rest of the sample with a low level of inclusion in Europe, except for the Azerbaijani students.
In all other parts of Europe, and mainly in Northern Europe, these three samples are quite different from the EuroBroadMap sample: students include much less the eastern countries and more the northern ones. A difference exists for the Azerbaijani students: they excluded Iceland, Northern Europe, and the Russian Federation.
Remote countries
The remote countries’ maps present different visions, independently of the locality of the countries, more or less close to Europe.
The first group (Russia and India) has a reduced visualisation of the limits of Europe. In this regard, it is seen that the Indian and Russian students see Western Europe as the crucial part of Europe, in other words as the heart of Europe. Ireland and the UK are less often shown as European
Figure 56: Differences between southern and eastern neighbouring countries of the European Union and the entire sample
than by all students. The Russian and Indian respondents have a tendency to delimit Europe on the east along the eastern boundaries of the Baltic countries, Belarus, and Ukraine. Interestingly, the same share of students in other countries as in Russia sees Ukraine as a European country. All former socialist countries, the Balkans, the Baltic countries, and the northern countries (Scandinavia), are shown by these students within the limits of Europe with the same frequency as by the other respondents. Finally, the Russian and Indian students neglect more often than the others the maritime boundaries and islands belonging to large European countries.
The second group contains the Brazilian, Chinese, and Senegalese dents, which have drawn a larger European space than the rest of the stu-dents, with more and less intensity. They did not often follow the coast in their drawing, but included part of the water in a circle. These students match the rest of the sample in two different perspectives. First, concerning the European countries in yellow, these students agree with the rest of the sample. Outside Europe, the large yellow area marks the space for which the students agree with the rest of the sample: this space is, in all countries surveyed, not included in Europe.
As can be seen in the above map, the perception which Brazilian students have of the limits and extension of Europe is very similar to that of the whole sample, with few exceptions. The exceptions are very simple to describe and analyse: they appear on the map as two perfectly continuous blocks. The positive exceptions form an almost unbroken circle around Europe. The “gains” for Europe are however small, as the area concerned is mainly sea, the lines have been drawn including wide expanses of water and include only a few countries, some of which being not EU members (Iceland, Norway, part of Russia) but also Malta, Ireland, and the United Kingdom, which are part of it. The map of the Senegalese students even tends to a bigger extension of Europe. This area concerns the Mediterranean Basin countries, and the western coast of the Atlantic Ocean. The Senegalese students consider that the Mediterranean countries belong to Europe, particularly Morocco, Alge-ria, Tunisia, Turkey, and the Mediterranean islands. Senegalese students seem to include Greenland and very much more Russia. The explanation of this Russian extension is the reflection of the school education in Africa where Russia is always joined to Europe.
As expected, for the Chinese students, Europe is more extended to the north, east, and southeast, including Greenland, the new EU member states, as well as the rest of the Balkans. They are more willing to put Russia, Belarus, Ukraine, Sardinia, Corsica, and Turkey within the European domain than are the students in other countries. Negative exceptions are much more limited, they relate only to Turkey and Cyprus for the Brazilian students and Iceland for the Senegalese students.
of Europe of the Cameroonian students differs from that of all the students mainly by an over-insertion of Eastern Europe. Last but not least, if the position inside the hinterland influences somehow the students’ vision of the inclusion or not of countries in Europe, it has no real effect on the perception of the sub-Saharan countries. The opinions of Cameroonian students are quite the same as those of the students of the whole sample. At this level of comparison, the map in this aspect shows also the existence of a noticeable sub-inclusion of the underdeveloped Arabic countries of the Middle East, the landlocked African countries such as Western Sahara, Niger, Mali, Sudan, all of which are frequently the theatres of a renewal of religious and socio-political troubles.
Global variation in the drawing of Europe
In order to check how the vision of Europe varies according to the country of survey, an ascending hierarchical classification was made on the frequen-cies of inclusion of the pixels of the grid to realise a global typology. The map presents seven major groups. The majority of them differentiate coun-tries according to the intensity of the inclusion of councoun-tries in Europe. The inclusion average level in those classes increases regularly. However, this global trend hides some slight differences inside the class that will be anal-ysed here. Two classes are particular: they characterised places where an opposition between the countries of the survey in the inclusion pattern can be observed between students (Figure 58).
Class one represents all the squares of the grid excluded from the limits of Europe with three main orientations: towards the west, the south, and the east. The frequencies of inclusion are generally low but the average levels of inclusion by French and Belgium students are particularly low (they nearly never include the southern shore of the Mediterranean Sea: 0.7%), while the average frequency of inclusion of Tunisian student is highest (6.5%).
In class two, the average level of inclusion rises but it is still not very high (14%). This class has a vision contrasted between the countries of the sample with an opposition between Swedish, Chinese, and Hungarian students who tend to include more those countries in Europe, and the rest of the sample who tend to include it less. This space covers a large part of the Atlantic Ocean and covers Greenland and the north of the map. It exhibits two main trends. The first one is the already noticed behaviour of Swedish and Hungarian students to very often include the northern part of the map. The second one is more linked to the way of drawing of Chinese students who generally traced a large circle including both land and sea.
Class three, with an average level of inclusion of 19%, marks an inter-esting difference about the membership of Russia in Europe. The students of the countries which are non-members of the European Union (especially African students) more often include the Russian space in Europe. But the students of the European countries and the neighbouring countries (which are cooperating with the EU) have included less often this space in Europe. Other classes group the squares of the grid which are included in Europe, with a progressive increase of the intensity of the average frequencies of inclusion in Europe between the fourth (36%) and the seventh class (88%). Some light trends regarding the countries behaviours can be observed in those classes. For example, class four covers a large part of Turkey, the Russia Federation, and Georgia. The students from Belgium, France, and Turkey less often include this space in Europe than the other students of the EuroBroadMap sample. Classes 5 and 6 mainly stress a gradation in the inclusion of the Atlantic Ocean. The Indian students tend to exclude more often this space than the other students from the sample because most of them draw the limit of Europe following the coast lines. The Swedish and Chinese students tend to include it more than the rest of the sample, and for class 6, the Portuguese students also tend to include a part of the Atlantic Ocean.
This analysis can also been conducted in more detail: on the places of survey rather than on the countries. In this case, the analysis has been conducted on the inclusion level of countries rather than on the grid. The figure obtained is quite similar (Figure 59) with an opposition between the countries the most included (blue) and those least included (yellow). The main factor of differentiation between the classes is the frequency of inclusion of countries in Europe. On this map, the Europe drawn by students seems
Figure 59: Typology of countries by places of survey
larger than in the previous figure (as the Russian Federation and Turkey for example belong to the most included spaces), but globally the figure is the same.
What is most interesting in this analysis is to observe how the places of survey show similar trends or not when building those maps. This allows checking whether we can observe a country effect (the places of survey from a same country would be gathered in the same class), and if some groups emerge in the drawing of Europe. The figure of inclusion according to places of survey within the classes from the previous analysis is quite coherent and the variations of trends observed between places of survey within the class are not very important. This confirms the fact that the drawing of Europe enjoys a firm consensus.
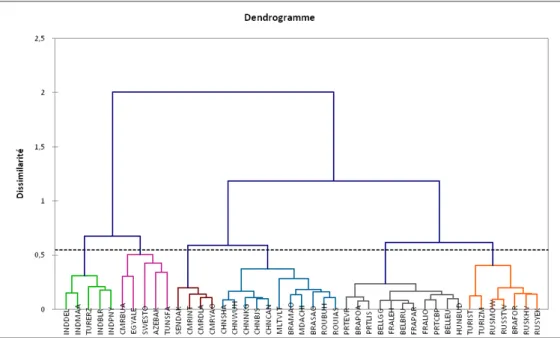
However, in order to deepen the analysis, we can make a complementary one trying to directly classify the places of survey according to how they include the countries proposed on the map in Europe. A first exploration by building a correlation matrix confirmed that even when observed at the place of survey, the students possess quite a consensus in the drawing of Europe, because the correlations indicators values are quite high: the minimum value is observed between Chennai in India and Stockholm in Sweden, but the value is still high (+0.941).
A typology conducted on places of survey (the variables describe the inclusion level of countries in Europe) grouped the places of survey according
Figure 60: Places of survey grouped according how they included countries in Europe
to how the students from those places draw Europe (Figure 60).
A first class (in pink, Figure 60) gathers some interface countries between Europe and the rest of the world or peripheral ones: Egypt, Sweden, Azerbai-jan, Tunisia, but also Buea (Cameroon). Those places are also characterised by a relatively small sample. Indeed, this could be the main cause of the building of this class: the main trend observed in this class is the relatively low level of inclusion of the European Union countries and countries of East-ern Europe in the drawing of Europe. However the students of those places are also characterised by the relatively high level of inclusion of interface or peripheral countries toward the southeastern part of the Mediterranean Sea: Egypt, Lebanon, Libya.
A second class (in green, Figure 60) gathers all Indian cities and Erzu-rum (Turkey). In those places, the samples conform more to the objectives and show a relatively low level of inclusion of countries of Northern Eu-rope (Finland, Norway, Sweden) and more of a very low level of inclusion of European island such as the United Kingdom, Ireland, Malta, and Iceland. This stresses the particular trend observed mainly with Indian students to draw the limits of Europe following the coast lines, excluding de facto many islands. These places of survey are also characterised by a relatively high level of inclusion of Middle East countries (Iraq, Jordan, Israel, Saudi
Ara-bia) and Central Asian countries within the limits of Europe (Kyrgyzstan, Uzbekistan, Turkmenistan). This trend has been particularly observed with the Erzurum students who tend to include their city in Europe and the countries neighbouring Turkey.
The following classes (grey and orange in Figure 60) show small differ-ences from the entire sample. Both show however a similar trend to drawn a relatively small Europe.
The grey class gathers mainly all “old European Union” countries: all the places of survey in France, Belgium and Portugal. It also included Budapest (Hungary) and Porto Alegre (Brazil), the most “European” of the Brazilian cities of our sample. The grey class is characterised by a really “European Union” vision of Europe as none of the island countries belonging to the UE are forgotten, and therefore are more included than in the other places of survey: Malta, Ireland, and Cyprus. This trend leads also to the fact they draw a relatively smaller Europe than other places of survey: as the countries of North Africa, the Middle East, and Central Asia are relatively less included in Europe.
The orange class gathers all the Russian places of survey, two Turkish cities (Izmir and Istanbul), plus Fortaleza in Brazil. We could suggest that these places of survey belong to former neighbouring empires of Europe. They share with the previous class a relatively small vision of Europe, and even a smaller one: they are characterised by the low level of inclusion of Mediterranean islands (Cyprus, Malta) and North African countries (Mo-rocco, Tunisia), but also the low level of inclusion of Balkan countries such as Albania, Macedonia, Bosnia, and Greece, and Eastern European countries (Hungary, Estonia, Lithuania, Latvia, Moldova, Ukraine). Indeed, the stu-dents from those places of survey tend not to include in Europe the countries that formerly belonged to the same geographical space: the Soviet Union and the Ottoman Empire.
The last two classes are characterised by relatively higher level of inclu-sion of some countries, i.e., the students from these places tend to draw a larger Europe.
The brown class gathers all African places of survey in Senegal and Cameroon except Buea. They tend to include very much more the Cau-casian countries in the limits of Europe: Azerbaijan, Georgia, and Armenia, but also Mongolia, Central Asian countries, and all the countries that be-longed to the Soviet Union. African students share a vision of a very large Europe from Brest in France to Vladivostok that is quite unusual in the rest of the sample.
The last class gathers together all the Chinese places of survey, two “new” European Union members’ places of survey (Malta and Romania), one close neighbour (Moldova), and two Brazilian cities (Sao Paulo and Manaus).
They are characterised by a very much higher level of inclusion of all pe-ripheral countries of the European Union, including themselves (except for the Chinese and Brazilian cities of course), in the limits of Europe. Neither the Scandinavian countries, the islands, nor the Eastern European countries are left out from their drawing of Europe. This could be explained by two main trends: that of the Chinese students’, who mainly use a large circle to draw the limits of Europe, and that of the other countries who include themselves in the limits of Europe. As most of them are in a peripheral situation (Romania, Malta, Moldova), this tends to enlarge the drawing of Europe.
This analysis allows of showing that, if the drawing of Europe enjoys a global consensus, some differences can be observed between the places of survey. What is striking is that:
• There is a strong national coherence, as in most of the cases, the places of survey from the country are gathered in the same class. The main exception is Brazil, where the places of survey are different in terms of population: the share of population of European origin in those countries varies very much and this could be an explanation;
• There is also some quite coherent geographical groupings with spatially close countries are gathered in the same class. We can therefore ob-serve a high correlation of the vision of Europe of old European Union member states, of neighbour and interface countries, and also of remote countries.
Conclusion
The drawing of Europe shows a consensus representation of Europe with the same trend of inclusion. The students agree on the heart of Europe and on the excluded spaces (southern Sahara, Arabian Peninsula). This trend could be explained partly by the conflation we observed between the European Union and Europe: the general trend is to assimilate Europe to the Euro-pean Union, with variations which correspond to the progressive extension. Another explanation could be the trend observed in the drawing. Generally the shape of a circle is privileged because Europe is more privileged as an idea than as a territorial fact. Globally, the students respect the state bor-ders, and some of them follow coast lines (Indian students). However the observation of the maps shows that the borders of Europe are fuzzy. The fuzziness however is very strong in the northeastern, northwestern, and west-ern directions, but not at all in the southwest-ern direction where the frequency of inclusion decreases brutally at the Mediterranean Sea. The Straits of Gibraltar and the Dardanelles seem to function as clear borders of Europe as a mental object for all students when some hesitations can be observed in the north with even clear opposition between some countries of the sample.
5.2 Representations of Europe in the world: Textual analysis
5.2.1 The vision of Europe according to the characteristics of stu-dents
The specific vocabulary according to the gender of students The responses of students have been analysed through their gender. The comparison of the specific vocabulary of each category (men and women) highlights some differences between their visions of Europe. In the case of women, Europe appears as dominated by words belonging to the seman-tic fields of leisure (“fashion”, “travel”, “clothes”, “tourism”, “vacation”), with enhancing consumption (“commercial”, and “fashion” which are the most over-represented words). Then, young women seem to have a more idealist and glamorous image of Europe (“romantic”, “beauty”, “love”, “gentleman”). They also point out an aesthetic culture’s perception (“monuments”, “archi-tecture”, and “museums”, “art”). The other most quoted words seem to refer to a dimension of social integration (“different”, “aid”, “mixed”, “community”, “included”, “equality”) and to a lesser extent, to the level of development (“modern”, “commercial”, “resources”, “developed”, “high”). At least the word “home” is more important for women (67% add this word). It represents 0.18% of the total of women’s vocabulary, in comparison with 0.13% of the words used by all the people).
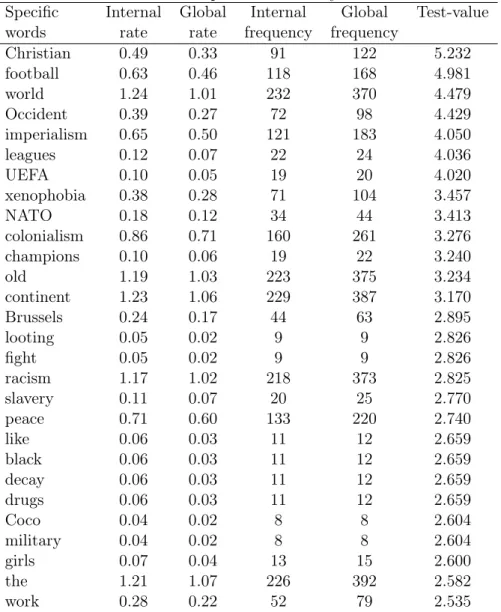
On the other hand, the words over-represented in the specific vocabulary of men belong to a very different semantic field. Europe is mainly seen by men through political and cultural issues (“Christian”, “world”, “Occident”, “continent”). Geopolitical relations of domination (“imperialism”, “colonial-ism”, “NATO”, “master”, “looting”, “slavery”, “military”) are also very present, and sometimes very negative (“xenophobia”, “racism”, “black”). In this con-text, connections through sport competition (“football”, “leagues”, “UEFA”, “champions”, “fight”) are more important in the men’s vision. Lastly, words about entertainment (“Coco” (Chanel), “girls”, “drugs”) expressed by some students in a pejorative way (“decay”, “old”) are over-represented.
Overall, the feminine vision of Europe is more positive and enjoyable, oriented to aesthetic issues and leisure, and sensitive to social inclusion goals. In opposition, the vision of men is imbued with a certain severity, as if Europe would be the result of a culture based on political domination and “struggle for life”. We’ll see in the next section that this perception is especially the one of South countries. The gender vision may correspond to larger contrasts between men and women concerning social construction even if an economic thematic is absent. Therefore, this opposition also refers to various ways of considering the geopolitical dimension of Europe: the masculine vision of Europe seems to be closer to the realistic paradigm of international relations, based on confrontation and relations of domination between rival powers. The feminine vision emphasises what makes Europe attractive (aesthetic
Table 8: Specific vocabulary of women
Specific Internal Global Internal Global Test-value
words rate rate frequency frequency
fashion 0.83 0.60 149 220 5.571 travel 0.45 0.32 80 116 4.269 monuments 0.11 0.05 19 20 4.196 architecture 0.22 0.15 40 54 3.618 romantic 0.74 0.59 132 215 3.605 beauty 1.73 1.50 310 548 3.557 culture 3.22 2.91 577 1063 3.500 museums 0.08 0.04 14 15 3.376 different 0.26 0.18 46 66 3.285 modern 1.08 0.92 194 335 3.246 gentleman 0.06 0.03 10 10 3.160 love 0.13 0.09 24 32 2.816 aid 0.06 0.03 11 12 2.800 commercial 0.08 0.05 15 18 2.760 mixed 0.08 0.05 15 18 2.760 community 0.43 0.34 77 125 2.753 included 0.04 0.02 8 8 2.717 art 0.60 0.50 107 182 2.593 resources 0.15 0.10 27 38 2.592 some 0.07 0.04 12 14 2.563 clothes 0.07 0.04 12 14 2.563 Eurovision 0.07 0.04 12 14 2.563 population 0.23 0.17 42 64 2.560 high 1.09 0.95 195 349 2.549 equality 0.04 0.02 7 7 2.472 home 0.18 0.13 33 49 2.452 order 0.18 0.13 33 49 2.452 developed 2.93 2.72 525 994 2.443 tourism 0.61 0.51 109 188 2.413 vacation 0.07 0.04 13 16 2.387
Table 9: Specific vocabulary of men
Specific Internal Global Internal Global Test-value
words rate rate frequency frequency
Christian 0.49 0.33 91 122 5.232 football 0.63 0.46 118 168 4.981 world 1.24 1.01 232 370 4.479 Occident 0.39 0.27 72 98 4.429 imperialism 0.65 0.50 121 183 4.050 leagues 0.12 0.07 22 24 4.036 UEFA 0.10 0.05 19 20 4.020 xenophobia 0.38 0.28 71 104 3.457 NATO 0.18 0.12 34 44 3.413 colonialism 0.86 0.71 160 261 3.276 champions 0.10 0.06 19 22 3.240 old 1.19 1.03 223 375 3.234 continent 1.23 1.06 229 387 3.170 Brussels 0.24 0.17 44 63 2.895 looting 0.05 0.02 9 9 2.826 fight 0.05 0.02 9 9 2.826 racism 1.17 1.02 218 373 2.825 slavery 0.11 0.07 20 25 2.770 peace 0.71 0.60 133 220 2.740 like 0.06 0.03 11 12 2.659 black 0.06 0.03 11 12 2.659 decay 0.06 0.03 11 12 2.659 drugs 0.06 0.03 11 12 2.659 Coco 0.04 0.02 8 8 2.604 military 0.04 0.02 8 8 2.604 girls 0.07 0.04 13 15 2.600 the 1.21 1.07 226 392 2.582 work 0.28 0.22 52 79 2.535
values, cultural patterns, ways of living). Then, it tends to be closer to the vision of the neoliberal international relations theory, recognising the importance of soft power and the possibility of a free cooperation between actors.
The specific vocabulary according to the domain of studies One of the hypotheses of the Eurobroadmap survey concerns the influence of the domain of studies on the vision of Europe developed by students. The students surveyed belong to various domains of study: arts, business, engineering, health, politics, and the social sciences (e.g., geography). The analysis of the specific vocabulary of each category highlights contrasting images.
Unsurprisingly, the specific words associated with Europe by arts stu-dents (see Table 10) are more connected with the semantic field of aesthetic creation, in a cultural sense (“art”, “music”, “fashion”, “Eurovision”, “culture”, “picture”, “architecture”, “leisure”) or in a sensory direction (“pretty”, “fine”, “love”), and often linked with a temporal dimension (“antiquity”, “classical”, “evolution”). This relation between Europe and the artistic dimension ap-pears relatively vague. We can notice the absence of any specific masterpiece, artists, monuments, museums, or any particular place of interest. Another semantic field refers to the political dimension. Except for “terrorism” and the negation “not”, words positively connoted refer to concrete abilities (“pos-sibilities”, “mobility”, “human” “rights”), for a better situation (“new”, “first”). Finally, an economic vision (“euro”, “expansive”, “capitalism”), expressed in a general way, is also a little more present for these students.
But students in Arts tend to ignore abstract concepts such as “mul-ticultural”, “developed”, “imperialism”, “xenophobia”, “science”, “liberalism” and “globalisation”. Words implying identity issues, in relation with a place (“continent”, “union”, “country”), a characteristic (“diversity”, “united”, “Euro-pean”), a claim (“identity”), or even with a relationship of opposition (“xeno-phobia”, “imperialism”, “selfish”) are also under-represented. Aspects which are usually associated with Europe, such as economics words (“income”, “liberalism”, “developed”, “development”) or flows (“immigration”, “integra-tion”, “circulation”), have been less pointed out by those students. Sportive and religious dimensions are also absent (“football”, “champions”, “Christian”, “god”).
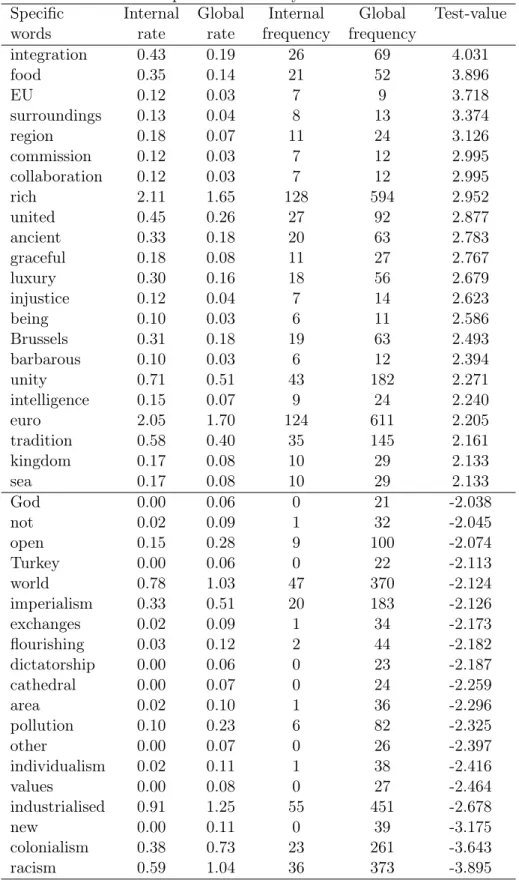
Students in Business (Table 11) more often focus on the European con-struction process (“integration”, “EU”, “surroundings”, “commission”, “collab-oration”, “united”, “Brussels”, “unity”, “euro”), even if they point out Europe’s roots and heritage: “ancient”, “tradition”, “kingdom”. They seem to asso-ciate Europe with prosperity (“food”, “rich”, “luxury”) or with vague qualities (“graceful”, “intelligence”). Moreover, some students in Business point out faults such as “injustice” or “barbarous”.
Table 10: Specific vocabulary of Art students
Specific Internal Global Internal Global Test-value
words rate rate frequency frequency
art 1.55 0.51 78 182 9.420 pretty 0.24 0.04 12 15 5.518 music 0.42 0.11 21 41 5.506 fashion 1.19 0.61 60 220 5.082 fine 0.18 0.04 9 15 3.907 terrorism 0.20 0.05 10 19 3.776 Eurovision 0.16 0.04 8 14 3.537 euro 2.32 1.70 117 611 3.480 possibilities 0.16 0.04 8 15 3.367 culture 3.71 2.96 187 1063 3.263 picture 0.14 0.04 7 13 3.143 mobility 0.20 0.07 10 24 3.133 rights 0.65 0.38 33 136 3.097 human 0.65 0.39 33 140 2.907 architecture 0.32 0.15 16 54 2.832 antiquity 0.20 0.08 10 28 2.706 classical 0.44 0.24 22 87 2.676 evolution 0.28 0.14 14 49 2.508 leisure 0.32 0.16 16 59 2.508 capitalism 0.81 0.56 41 200 2.434 expensive 0.18 0.08 9 27 2.367 love 0.20 0.09 10 32 2.331 first 0.24 0.12 12 42 2.302 girls 0.12 0.04 6 15 2.251 united 0.12 0.26 6 92 -2.057 football 0.28 0.47 14 168 -2.120 income 0.00 0.08 0 29 -2.242 liberalism 0.06 0.19 3 67 -2.287 European 1.47 1.88 74 677 -2.345 union 2.64 3.23 133 1160 -2.564 immigration 0.02 0.14 1 51 -2.641 development 1.96 2.51 99 901 -2.681 continent 0.71 1.08 36 387 -2.736 xenophobia 0.10 0.29 5 104 -2.849 imperialism 0.24 0.51 12 183 -3.045 developed 1.98 2.76 100 994 -3.748 multicultural 0.00 0.25 0 89 -4.692
But this negative perception is not very present for students in Business. Actually, they turn away from words implying negative political judgments such as “racism”, “colonialism”, “individualism”, “pollution”, “dictatorship”, or “imperialism”.
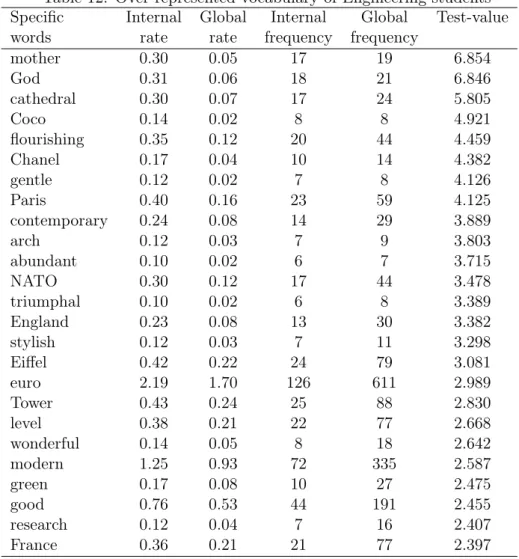
The vision of Europe shared by students in Engineering (Tables 12 and 13) is very specific, essentially related to British and French places (“Paris”, “England”, “Eiffel” “Tower”, “France”, “Triumphal” “Arch”, “Notre Dame” “cathedral”) and to positive appreciations, in an idealistic way (“flourishing”, “gentle”, “contemporary”, “abundant”, “stylish”, “level”, “wonderful”, “mod-ern”, “green”, “good”). The over-representation of “Coco” “Chanel” indicates a vision sensitive to luxury and consumption.
We can notice here that words related to the aesthetic dimension are omitted (“elegant, “classical”, “architecture”, “fashion”, “art”, “environmen-tal”). Except for “NATO” and “euro”, semantic fields connected to geoeco-nomic and geopolitical issues are systematically under-utilised.
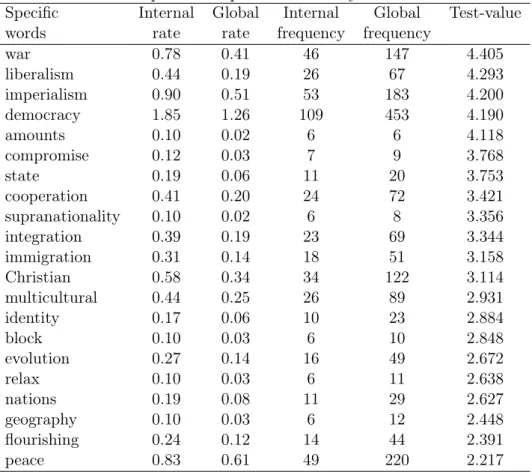
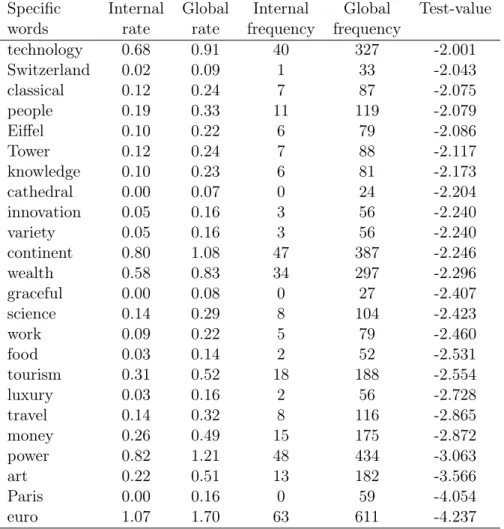
Students in the field of politics (Tables 14 and 15) develop a vision of Europe opposed to the previous one, notably influenced by their academic origin: their vocabulary evokes a vision very highly conceptualised around themes related to governance (“democracy”, “state”, “cooperation”, “suprana-tionality”, “integration”, “immigration”, “peace”), geopolitical issues (“war”, “compromise”, “block”, “us”, “nations”, “Christian”), and political doctrines (“liberalism”, “imperialism”, “multicultural”, “identity”). Curiously, the word “power” is under-represented (this word represent 0.82% of the total words used by students in political fields, but 1.21% for the students as a whole), while a geopolitical thematic is emphasised.
On the other hand, students in Politics avoid words belonging to the regis-ter of daily life (“euro”, “money”, “people”, “wealth”, “work”, “food”,“natural”). A touristic vision also tends to be ignored (“tourism”, “travel”, “Paris”, “Swit-zerland”, “Eiffel” “tower”, “leisure”). Those students quoted less often words about culture (“art”, “classical”, “cathedral”, “variety”, “graceful”), the sciences (“technology”, “knowledge”, “innovation”, “science”), or seduction (“luxury”, “fashion”, “style”).
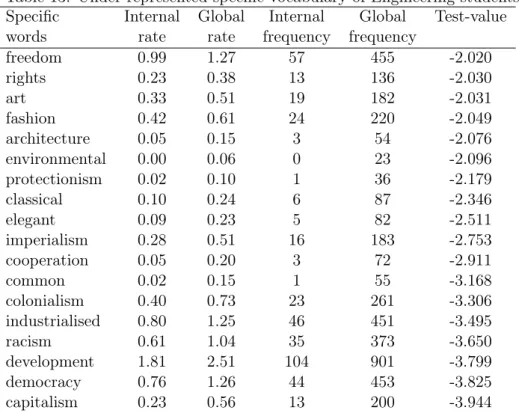
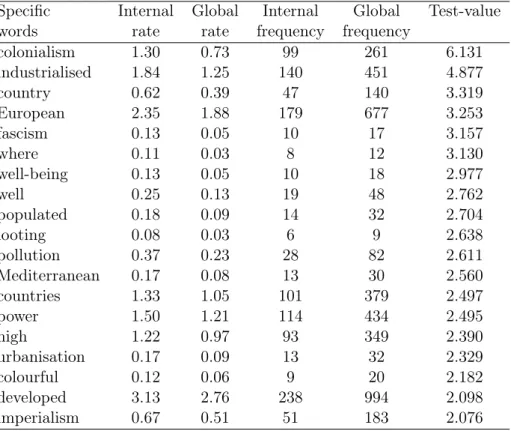
Students in the field of the social sciences (e.g., Geography) (Tables 16 and 17) have mostly a negative and a critical vision of Europe, with some very hard words such as “colonialism”, “fascism”, “looting”, “pollution”, “im-perialism”, even if a few words refer to positive ideas (“well-being”, “well”, “developed”, “high”). Neutral words appear to provide geographic informa-tion (“country”, “European”, “where”, “Mediterranean”, “countries”), and to characterise the society (“industrialised”, “populated”, “mechanised”, “urban-isation”, “colourful”).
Unlike other students, students in the social sciences tend to avoid words that may reveal a positive aspect (“good”, “pretty”), or those related to the
Table 11: Specific vocabulary of Business students
Specific Internal Global Internal Global Test-value
words rate rate frequency frequency
integration 0.43 0.19 26 69 4.031 food 0.35 0.14 21 52 3.896 EU 0.12 0.03 7 9 3.718 surroundings 0.13 0.04 8 13 3.374 region 0.18 0.07 11 24 3.126 commission 0.12 0.03 7 12 2.995 collaboration 0.12 0.03 7 12 2.995 rich 2.11 1.65 128 594 2.952 united 0.45 0.26 27 92 2.877 ancient 0.33 0.18 20 63 2.783 graceful 0.18 0.08 11 27 2.767 luxury 0.30 0.16 18 56 2.679 injustice 0.12 0.04 7 14 2.623 being 0.10 0.03 6 11 2.586 Brussels 0.31 0.18 19 63 2.493 barbarous 0.10 0.03 6 12 2.394 unity 0.71 0.51 43 182 2.271 intelligence 0.15 0.07 9 24 2.240 euro 2.05 1.70 124 611 2.205 tradition 0.58 0.40 35 145 2.161 kingdom 0.17 0.08 10 29 2.133 sea 0.17 0.08 10 29 2.133 God 0.00 0.06 0 21 -2.038 not 0.02 0.09 1 32 -2.045 open 0.15 0.28 9 100 -2.074 Turkey 0.00 0.06 0 22 -2.113 world 0.78 1.03 47 370 -2.124 imperialism 0.33 0.51 20 183 -2.126 exchanges 0.02 0.09 1 34 -2.173 flourishing 0.03 0.12 2 44 -2.182 dictatorship 0.00 0.06 0 23 -2.187 cathedral 0.00 0.07 0 24 -2.259 area 0.02 0.10 1 36 -2.296 pollution 0.10 0.23 6 82 -2.325 other 0.00 0.07 0 26 -2.397 individualism 0.02 0.11 1 38 -2.416 values 0.00 0.08 0 27 -2.464 industrialised 0.91 1.25 55 451 -2.678 new 0.00 0.11 0 39 -3.175 colonialism 0.38 0.73 23 261 -3.643 racism 0.59 1.04 36 373 -3.895
Table 12: Over-represented vocabulary of Engineering students Specific Internal Global Internal Global Test-value
words rate rate frequency frequency
mother 0.30 0.05 17 19 6.854 God 0.31 0.06 18 21 6.846 cathedral 0.30 0.07 17 24 5.805 Coco 0.14 0.02 8 8 4.921 flourishing 0.35 0.12 20 44 4.459 Chanel 0.17 0.04 10 14 4.382 gentle 0.12 0.02 7 8 4.126 Paris 0.40 0.16 23 59 4.125 contemporary 0.24 0.08 14 29 3.889 arch 0.12 0.03 7 9 3.803 abundant 0.10 0.02 6 7 3.715 NATO 0.30 0.12 17 44 3.478 triumphal 0.10 0.02 6 8 3.389 England 0.23 0.08 13 30 3.382 stylish 0.12 0.03 7 11 3.298 Eiffel 0.42 0.22 24 79 3.081 euro 2.19 1.70 126 611 2.989 Tower 0.43 0.24 25 88 2.830 level 0.38 0.21 22 77 2.668 wonderful 0.14 0.05 8 18 2.642 modern 1.25 0.93 72 335 2.587 green 0.17 0.08 10 27 2.475 good 0.76 0.53 44 191 2.455 research 0.12 0.04 7 16 2.407 France 0.36 0.21 21 77 2.397
Table 13: Under-represented specific vocabulary of Engineering students Specific Internal Global Internal Global Test-value
words rate rate frequency frequency
freedom 0.99 1.27 57 455 -2.020 rights 0.23 0.38 13 136 -2.030 art 0.33 0.51 19 182 -2.031 fashion 0.42 0.61 24 220 -2.049 architecture 0.05 0.15 3 54 -2.076 environmental 0.00 0.06 0 23 -2.096 protectionism 0.02 0.10 1 36 -2.179 classical 0.10 0.24 6 87 -2.346 elegant 0.09 0.23 5 82 -2.511 imperialism 0.28 0.51 16 183 -2.753 cooperation 0.05 0.20 3 72 -2.911 common 0.02 0.15 1 55 -3.168 colonialism 0.40 0.73 23 261 -3.306 industrialised 0.80 1.25 46 451 -3.495 racism 0.61 1.04 35 373 -3.650 development 1.81 2.51 104 901 -3.799 democracy 0.76 1.26 44 453 -3.825 capitalism 0.23 0.56 13 200 -3.944
economic level (“wealth”, “luxury”, “flourishing”, “comfort”), or with polit-ical values (“rights”, “freedom”). They refer less to Europe’s heritage, its seniority (“ancient”, “conservative”,), modernity (“modern”, “evolution”, “pos-sibilities”, “integration”), history (“history”, “tradition”, “renaissance”), and cultural specificities.
The specific vocabulary of students in Health Sciences (Table 18) is more heteroclitic, with a preference for words evoking exchanges (“commer-cial”, “exchanges”, “travel”, “opening”) and a quality of life seen as enjoyable (“sights”, “variety”, “climate”, “development”, “nice”, “weather”). But some other words tend to focus on bad performances (“faddish”, “neo-colonialism”), and on the strict attitude of Europeans (“rules, “discipline”).
The words under-represented refer to various semantic fields, such as po-litical and economic governance (“euro”, “integration”, “union”, “European”, “parliament”, “Brussels”, “market”), geopolitical issues (“mainland”, “colonial-ism”, “economy”, “individual“colonial-ism”, “war”, “imperial“colonial-ism”, “land”, “egoism”), and culture (“cathedral”, “unity”, “diversity”, “civilisation”, “Christian”, “contem-porary”).
The analysis of the specific vocabularies according to the field of study of the students shows that academic images strongly determine the way students envisage Europe. Thus, the theme of Europe seems mainly to
de-Table 14: Over-represented specific vocabulary of Politics students
Specific Internal Global Internal Global Test-value
words rate rate frequency frequency
war 0.78 0.41 46 147 4.405 liberalism 0.44 0.19 26 67 4.293 imperialism 0.90 0.51 53 183 4.200 democracy 1.85 1.26 109 453 4.190 amounts 0.10 0.02 6 6 4.118 compromise 0.12 0.03 7 9 3.768 state 0.19 0.06 11 20 3.753 cooperation 0.41 0.20 24 72 3.421 supranationality 0.10 0.02 6 8 3.356 integration 0.39 0.19 23 69 3.344 immigration 0.31 0.14 18 51 3.158 Christian 0.58 0.34 34 122 3.114 multicultural 0.44 0.25 26 89 2.931 identity 0.17 0.06 10 23 2.884 block 0.10 0.03 6 10 2.848 evolution 0.27 0.14 16 49 2.672 relax 0.10 0.03 6 11 2.638 nations 0.19 0.08 11 29 2.627 geography 0.10 0.03 6 12 2.448 flourishing 0.24 0.12 14 44 2.391 peace 0.83 0.61 49 220 2.217
Table 15: Under-represented specific vocabulary of Politics students Specific Internal Global Internal Global Test-value
words rate rate frequency frequency
technology 0.68 0.91 40 327 -2.001 Switzerland 0.02 0.09 1 33 -2.043 classical 0.12 0.24 7 87 -2.075 people 0.19 0.33 11 119 -2.079 Eiffel 0.10 0.22 6 79 -2.086 Tower 0.12 0.24 7 88 -2.117 knowledge 0.10 0.23 6 81 -2.173 cathedral 0.00 0.07 0 24 -2.204 innovation 0.05 0.16 3 56 -2.240 variety 0.05 0.16 3 56 -2.240 continent 0.80 1.08 47 387 -2.246 wealth 0.58 0.83 34 297 -2.296 graceful 0.00 0.08 0 27 -2.407 science 0.14 0.29 8 104 -2.423 work 0.09 0.22 5 79 -2.460 food 0.03 0.14 2 52 -2.531 tourism 0.31 0.52 18 188 -2.554 luxury 0.03 0.16 2 56 -2.728 travel 0.14 0.32 8 116 -2.865 money 0.26 0.49 15 175 -2.872 power 0.82 1.21 48 434 -3.063 art 0.22 0.51 13 182 -3.566 Paris 0.00 0.16 0 59 -4.054 euro 1.07 1.70 63 611 -4.237
Table 16: Over-represented specific vocabulary of students in human and social sciences
Specific Internal Global Internal Global Test-value
words rate rate frequency frequency
colonialism 1.30 0.73 99 261 6.131 industrialised 1.84 1.25 140 451 4.877 country 0.62 0.39 47 140 3.319 European 2.35 1.88 179 677 3.253 fascism 0.13 0.05 10 17 3.157 where 0.11 0.03 8 12 3.130 well-being 0.13 0.05 10 18 2.977 well 0.25 0.13 19 48 2.762 populated 0.18 0.09 14 32 2.704 looting 0.08 0.03 6 9 2.638 pollution 0.37 0.23 28 82 2.611 Mediterranean 0.17 0.08 13 30 2.560 countries 1.33 1.05 101 379 2.497 power 1.50 1.21 114 434 2.495 high 1.22 0.97 93 349 2.390 urbanisation 0.17 0.09 13 32 2.329 colourful 0.12 0.06 9 20 2.182 developed 3.13 2.76 238 994 2.098 imperialism 0.67 0.51 51 183 2.076
Table 17: Under-represented specific vocabulary of students in human and social sciences
Specific Internal Global Internal Global Test-value
words rate rate frequency frequency
Paris 0.08 0.16 6 59 -2.024 fashion 0.45 0.61 34 220 -2.058 conservative 0.03 0.09 2 33 -2.084 comfort 0.13 0.24 10 85 -2.093 renaissance 0.00 0.05 0 17 -2.109 mysterious 0.03 0.09 2 34 -2.158 evolution 0.05 0.14 4 49 -2.216 integration 0.09 0.19 7 69 -2.230 mother 0.00 0.05 0 19 -2.296 flourishing 0.04 0.12 3 44 -2.346 freedom 1.00 1.27 76 455 -2.348 rights 0.22 0.38 17 136 -2.496 culture 2.52 2.96 192 1063 -2.528 big 0.07 0.18 5 63 -2.633 cathedral 0.00 0.07 0 24 -2.717 good 0.33 0.53 25 191 -2.783 Spain 0.01 0.10 1 35 -2.807 art 0.30 0.51 23 182 -2.879 modern 0.64 0.93 49 335 -2.993 ancient 0.05 0.18 4 63 -3.029 Eiffel 0.08 0.22 6 79 -3.096 music 0.01 0.11 1 41 -3.199 Tower 0.08 0.24 6 88 -3.521 luxury 0.03 0.16 2 56 -3.536 wealth 0.49 0.83 37 297 -3.831
Table 18: Specific vocabulary of Health Sciences students
Specific Internal Global Internal Global Test-value
words rate rate frequency frequency
commercial 0.25 0.05 14 18 5.648 exchanges 0.27 0.09 15 34 3.796 sights 0.12 0.03 7 10 3.578 science 0.55 0.29 31 104 3.556 faddish 0.11 0.02 6 8 3.430 council 0.11 0.02 6 8 3.430 variety 0.34 0.16 19 56 3.263 climate 0.36 0.18 20 64 3.013 travel 0.55 0.32 31 116 2.978 development 3.07 2.51 172 901 2.815 nice 0.12 0.04 7 16 2.460 opening 0.12 0.04 7 16 2.460 rules 0.14 0.06 8 20 2.432 discipline 0.12 0.05 7 17 2.318 weather 0.11 0.04 6 14 2.200 history 1.69 1.37 95 491 2.195 neo-colonialism 0.16 0.08 9 27 2.107 war 0.25 0.41 14 147 -2.006 diversity 0.57 0.80 32 287 -2.067 unity 0.32 0.51 18 182 -2.113 cathedral 0.00 0.07 0 24 -2.118 many 0.04 0.13 2 47 -2.144 parliament 0.02 0.10 1 37 -2.177 European 1.52 1.88 85 677 -2.194 individualism 0.02 0.11 1 38 -2.234 economy 1.05 1.41 59 507 -2.488 colonialism 0.46 0.73 26 261 -2.548 union 2.66 3.23 149 1160 -2.638 integration 0.05 0.19 3 69 -2.698 mainland 0.02 0.13 1 47 -2.713 euro 1.12 1.70 63 611 -3.750
pend on student concerns, in relation to their academic branch: Europe is seen through the prism of culture for students in arts, through political doctrines for students in politics, through economic process construction for students in business. Students mobilise very spontaneously the conceptual fields they use in daily life to improve the level of their specific competen-cies. However, this tendency is more or less visible according to the domain of studies. For example, students in health and in engineering do not seem to export the mental world associated with their discipline to understand Europe. Likewise, students in geography tend to emphasise a little more geographic information, but in a very abstract way, and they never mention particular countries or problematics of Europe’s boundaries. The domain of study also influences the implicit judgements, positive or negative, un-derlying the words most frequently used by students. Students in art, in engineering, and in health tend to develop a positive vision of Europe, based on concrete words focusing on the quality of life, opportunities for tourism, leisure, aesthetic culture and heritage, and on the prosperity which can be found. On the contrary, the vision developed by students in the social sci-ences and politics is more abstracted, far from daily concerns. In those subjects, students theorise Europe, associating it with general concepts, in economic or political categories, such as “democracy”, “development”, “liber-alism”, “imperi“liber-alism”, and “ethnocentrism”. Thus, the assessment of Europe appears balanced, mixing negative words mainly linked to the past (“war”, “colonialism”, “fascism”) and positive words such as “integration”, “coopera-tion”, “peace”. Note that the themes of decline and loss of power which is a European concern till the end of the First World War seem to be omitted. Finally, the vocabulary preferentially used by students in Business is more pragmatic, focusing on processes and achievements of European construc-tion, and leaving out the negative vision. For students in the social and political sciences, Europe cannot be reduced to a “lovely” place, “peaceful”, “flourishing” and enjoyable. It is also seen as an ambiguous political model, carrying out a contradictory legacy that affects its relations with the rest of the world. The focus put on geopolitical and geoeconomic matters reveals that Europe is also seen as a political power, faced with social, economic, and institutional issues that privileges from the past will not be sufficient to help resolving them.
Consequently, there is no homogeneous representation of Europe from the students of the different fields of study. We’ll see that around the world, the vision of Europe differs also very strongly according to the geographic location of the students and beyond their academic origins.
The specific vocabulary according to student’s family level of income
It may be interesting to evaluate the relation between the students’ vision of Europe and their social level. The hypothesis may be as follows: the
higher the social level of the student, the more they would have opportunities to be open, to travel, to learn about Europe, and to have an empirical and contemporaneous experience and perception of Europe; in contrast, the weaker is the social level of the student, the less they would know about Europe, and the more they would tend to idealise it.
Here, the difficulties are about the means of estimating the social level of the student. We chose to let the students themselves declare the level of income of their family, with three consequences. First, as students choose themselves their social level, they may have declared a higher income in or-der to give a better image of themselves. Secondly, students had to register the income level of their family, and if generally, family situation looks like student’s one, sometimes, a family break-up might produce a gap between the student’s income and the family’s social level. Third, poverty and wealth have different meanings in different countries or regions. Thus it may be dif-ficult to compare social levels between different countries around the world. That is the reason why we introduced a qualitative scale of income, instead of an income value. Finally, the analysis of the specific vocabulary related to the level of income category allows us to underline contrasted perceptions.
Students who declare the lowest levels of income for their family show dif-ferent visions of Europe (Tables 19 and 20). If some of them described Europe with attractive words, in a utopian way (“centre”, “Eldorado”, “paradise”), or suggesting positive achievements (“many”, “immigration”, “income”, “high”, “democracy”, “advanced”, “developed”, “rich”, “industrialised”), others showed a negative perception of Europe, in reference to its history (“colonialism”, “Africa”, “African”, “slavery”, “racism”, “egoism”, “whites”) and the occidental complex of superiority (“exploitation”, “Occident”, “domination”, “thieves”, “pollution”).
On the other hand, students belonging to the lower social category tend to ignore geographical aspects of Europe, through places or touristic sites (“Germany”, “Eiffel” “Tower”) or words referring to its location (“borders”, “Western”). References to its history and cultural heritage are also less im-portant.
It’s also interesting to note that political or economical vocabulary does not form a part of the specific words of those students.
When students mention a low–medium income level (Table 21), their vi-sion of Europe looks more like an idealist country, but this time, through abstract qualities (“romantic”, “flourishing”, “liveable”, “comfort”, “possibili-ties”, “mysterious”, “learning”). At the same time, words meaning superiority of a sidelining are over-represented (“exclusion”, “bad”, “imperialism”). Then, those students pointed out more often Europe as a part of the world (“West”, “group”, “England”), to which they apparently do not have a feeling of be-longing (words as “us” or “home” are for example absent here), but which they look at with almost positive words (“developed”, “classical”, “rich”).
Table 19: Over-represented specific vocabulary of students with a low level of income
Specific Internal Global Internal Global Test-value
words rate rate frequency frequency
industrialised 2.52 1.24 132 451 8.101 colonialism 1.43 0.72 75 261 5.914 countries 1.75 1.04 92 379 5.042 exploitation 0.90 0.46 47 169 4.439 racism 1.58 1.03 83 373 4.016 Occident 0.57 0.27 30 98 3.995 rich 2.31 1.63 121 594 3.923 developed 3.59 2.73 188 994 3.905 advanced 0.86 0.49 45 177 3.775 democracy 1.81 1.25 95 453 3.740 domination 0.53 0.26 28 94 3.721 Africa 0.19 0.05 10 19 3.715 African 0.17 0.04 9 16 3.680 high 1.43 0.96 75 349 3.516 egoism 0.38 0.18 20 66 3.182 income 0.21 0.08 11 29 2.957 paradise 0.21 0.08 11 29 2.957 slavery 0.19 0.07 10 25 2.953 Eldorado 0.23 0.09 12 34 2.881 thieves 0.19 0.07 10 26 2.844 immigration 0.29 0.14 15 51 2.617 whites 0.13 0.04 7 16 2.616 many 0.27 0.13 14 47 2.563 pollution 0.40 0.23 21 82 2.551 people 0.53 0.33 28 119 2.551 centre 0.44 0.26 23 93 2.522