HAL Id: tel-01235141
https://hal.inria.fr/tel-01235141
Submitted on 28 Nov 2015
HAL is a multi-disciplinary open access archive for the deposit and dissemination of sci-entific research documents, whether they are pub-lished or not. The documents may come from teaching and research institutions in France or abroad, or from public or private research centers.
L’archive ouverte pluridisciplinaire HAL, est destinée au dépôt et à la diffusion de documents scientifiques de niveau recherche, publiés ou non, émanant des établissements d’enseignement et de recherche français ou étrangers, des laboratoires publics ou privés.
Topology Preserving Vascular Registration: Application
to Percutaneous Coronary Intervention
Thomas Benseghir
To cite this version:
Thomas Benseghir. Topology Preserving Vascular Registration: Application to Percutaneous Coro-nary Intervention. Signal and Image processing. Université de Nice-Sophia Antipolis, 2015. English. �tel-01235141�
Universite de Nice - Sophia Antipolis
ecole doctorale stic
SCIENCES ET TECHNOLOGIES DE L’INFORMATION ET DE LA COMMUNICATION
T H E S E
pour l’obtention du grade de
Docteur en Sciences
de l’université de Nice - Sophia Antipolis
Mention : Automatique Traitement du Signal et des Images
présentée et soutenue parThomas Benseghir
Topology Preserving Vascular
Registration: Application to
Percutaneous Coronary
Intervention
Thèse dirigée par Grégoire Malandain
soutenue le 7 juillet 2015
Jury :
Reviewers : Patrick Clarysse - CNRS (CREATIS)
Pascal Fua - EPFL
Advisors : Grégoire Malandain - INRIA (Morpheme) Régis Vaillant - GE Healthcare
Examinators : Nassir Navab - TUM
Remerciements
Mes premiers remerciements vont naturellement à mes deux encadrants qui m’ont accompagné pendant la totalité de cette thèse. J’ai appris énormément de ces deux personnages exceptionnels et ne saurai leur rendre hommage à la hauteur de ce qu’ils m’ont apporté. Toi Grégoire et tes nombreuses maximes qui résonnent maintenant dans ma tête dès que j’écris quelque chose:
• “Il faut prendre le lecteur1
par la main et le guider à travers un discours linéaire.”
• “Ce qui se conçoit bien s’énonce clairement; et les mots pour le dire arrivent aisément.”
Sans oublier bien-sûr ton goût pour l’excellence, aussi porté sur les cookies et les madeleines. Et toi Régis qui a su tempérer et canaliser mon énergie, toujours en me poussant à faire des choix pragmatiques et raisonnés. Tu as su m’ouvrir les portes de GE (au propre comme au figuré) et grâce à toi je me prépare à quelques belles années d’acronymes en tout genre. Je garde précieusement en mémoire ces réunions du lundi matin et ces ECM animés qui rythmaient mes semaines si bien remplies.
Alors que beaucoup voient la thèse comme un voyage, j’aime à la comparer à une grossesse. Et au delà de mes encadrants qui m’ont accompagné pendant mes nausées et mes envies de fraises, je remercie ceux qui ont aidé à l’accouchement. D’abord Patrick et Pascal pour leur travail profond de relecture grâce auquel j’ai pu améliorer la qualité de ce manuscrit. Plus largement, je remercie les membres du jury qui, grâce à leurs questions, ont ouvert de nombreuses perspectives à creuser dans de futurs travaux. Un remerciement tout particulier à Nassir qui a accepté d’assister à ma thèse à 5 heures du matin outre-atlantique, ainsi qu’à Xavier qui a présidé le jury et qui m’a permis de replacer mon travail dans un contexte plus large. Merci à vous d’avoir concrétiser l’aboutissement de ces années de recherche.
Rien de tout ceci n’aurait été possible sans ces nombreuses discussions au détour d’une machine à café, d’un bureau ou d’une salle de bloc. Au delà de l’intérêt scien-tifique, ces échanges ont aussi rendu cette “grossesse” bien plaisante. Merci d’abord à Aymeric, Ketan et nos deux Vincent pour leur pauses revigorantes à travers tout GE et leur soutien constant. A mon cher co-bureau Cyril et nos discussions souvent conclues par une friandise. Un merci sportif à François pour m’avoir aidé à trouver à la fois une place à GE et aussi la motivation de faire travailler mes jambes pour me vider la tête. Merci à Valérie pour avoir su croire en moi et de continuer à le faire. Un merci groupé pour toute l’équipe GE: Yves, Liliane, les Maximes (T. et C.), Dustin, Charlotte, les Laurences (G. et V.), Sophie, Pablo, Razvan, Giovani, Ben-jamin, Philippe, Isabelle, Kiem et tous les autres que j’oublie sûrement. J’ai aussi eu la chance de partager beaucoup de bons moments avec l’équipe ASCLEPIOS. Merci donc à mes chers co-bureaux temporaires Matthieu, Chloé, Nicolas, Krissy
1
ii
et Marine ; vous qui avez su m’accueillir avec tant de gentilesse. Une pensée parti-culière pour Isabelle qui s’est toujours pliée en quatre pour faciliter mes différents séjours et ma vie sur la côte d’azur. Lors d’une pause café, une soirée sushi ou un séminaire dans les montagnes, l’équipe a su me faire prendre le poids nécessaire à toute grossesse. Merci donc à Nicholas, Hervé (D. et L.), Xavier, Maxime, Marco, Alan, Hugo, Loïc (C. et L.F.), Hakim, Florian, Vikash, Mehdi, Bishesh, Rocio, Jan, Nina, Anant, Marc-Michel, Sophie, Thomas et Roch-Philippe.
Initialement prévue comme un partenariat GE / ASCLEPIOS, j’ai eu l’occasion de partager quelques bons moments avec l’équipe MORPHEME. Merci à Agustina, Marine, Gaël, Jane et à toute l’équipe MORPHEME, sage-femmes et maïeuticiens d’une semaine, pour leur aide pendant la dernière ligne droite. Grâce à vous tous, je me suis immédiatement senti à mon aise. J’ai particulièrement apprécié cette réunion d’équipe en bord de mer qu’il sera malheureusement difficile à instaurer côté GE... Durant cette thèse, j’ai beaucoup apprécié ces quelques voyages en conférences ou écoles d’été (souvent difficilement acceptés par mes proches comme périodes de “travail”). Parmis toutes ces rencontres, je fais un clin d’oeil barcelonais à Marta, Veronika, Oliver et Nazim.
Naturellement une thèse représente beaucoup d’investissement personnel et je remercie mes proches pour leur soutien et leur compréhension face à mon manque de temps. Merci à ma mère et ma grand mère qui m’ont appris le goût de l’effort et qui m’ont tout donné. Merci à Bernard, mon beau-papa, et Baptiste, mon frère, pour ces beaux moments remplis de jeux et discussions passionnées. Merci à Julien et Antoine pour notre trio inconditionnel, maintenant complété par nos trois drôles de dames. Un gros merci à ceux qui ont pu faire le déplacement à Nice et assister à mon réglage de climatisation : Mon père, Patrick et Andrée. Plus largement merci à toute ma famille pour leur compréhension et pour m’avoir laissé le temps de me concentrer sur cette fin de thèse. Merci à mes amis de longue date. Ceux qui ont su braver la distance et le manque de temps: Flore et banban, Thomas et la famille Guilment et bien sûr Cindy et Momo. Merci aussi à ma chère belle-maman Christine ainsi qu’à Philippe pour m’avoir toujours accueilli comme si j’étais de la famille. Un petit clin d’oeil sportif aux amis de l’escalade pour m’avoir accompagné dans la découverte de ce sport tellement prenant.
Enfin, je remercie ma plus belle aventure du quotidien... Celle par qui TOUS commencent et avec qui je finirai.
iii
Acronyms
AVM ArterioVenous Malformations CABG Coronary Artery Bypass Grafting
CT Computed Tomography
CTA Computed Tomography Angiography
CTO Chronic Total Occlusion
DICOM Digital Imaging and COmmunications in Medicine
DoF Degrees of Freedom
DRR Digitally Reconstructed Radiograph DSA Digitally Subtracted Angiogram
ECG Electrocardiogram
EM Expectation Maximization
FFD Free Form Deformation
FFR Fractional Flow Reserve
GMM Gaussian Mixture Model
GT Ground-Truth
ICC Iterative Closest Curve ICP Iterative Closest Point LAD Left Anterior Descending
MI Mutual Information
MIP Maximum Intensity Projection MPD Mean Projective Distance
MR Magnetic Resonance
NCC Normalized Cross Correlation
NMS Non-Maximum Suppression
PCI Percutaneous Coronary Intervention PDF Probability Density Function
iv
QCA Quantitative Coronary Analysis RoI Region of Interest
SOD Source Object Distance SSD Sum of Squared Difference SVD Singular Value Decomposition
TACE Trans-Arterial Chemo-Embolization (also called Transcatheter Arterial ChemoEmbolization)
TP-ICC Tree-topology Preserving Iterative Closest Curve
TPS Thin Plate Spline
TRE Target Registration Error WHO World Health Organization
Contents
1 Introduction 1
2 Clinical Context 5
2.1 Pathologies and Treatments . . . 5
2.1.1 Atherosclerosis, Stenosis and Occlusion. . . 5
2.1.2 Minimally Invasive Surgical Procedure . . . 7
2.2 Angiography . . . 12
2.2.1 C-arm System. . . 12
2.2.2 Angiography and Guidance . . . 15
2.3 Computed Tomography Angiography . . . 18
2.3.1 X-ray Scanner System . . . 18
2.3.2 Pathology Diagnosis and Therapy Planning . . . 19
2.4 Complementarity between Modalities . . . 22
2.4.1 Clinical Application Propositions . . . 23
2.4.2 Registration Necessity . . . 25
3 State of the Art 27 3.1 Registration Problem Overview . . . 27
3.2 Intensity-Based Methods . . . 30
3.2.1 “Pure” Intensity-Based Methods. . . 31
3.2.2 RoI Intensity-Based Methods . . . 32
3.3 Feature-Based Methods . . . 33
3.3.1 Vasculature as a Set of Points . . . 34
3.3.2 Vasculature as a Spatial Distribution . . . 36
3.3.3 Vasculature as a Set of Local Vessel Portions . . . 38
3.3.4 Vasculature as a set of Curves. . . 40
3.3.5 Vasculature as Trees and Graphs . . . 41
3.4 Thesis Point of View . . . 42
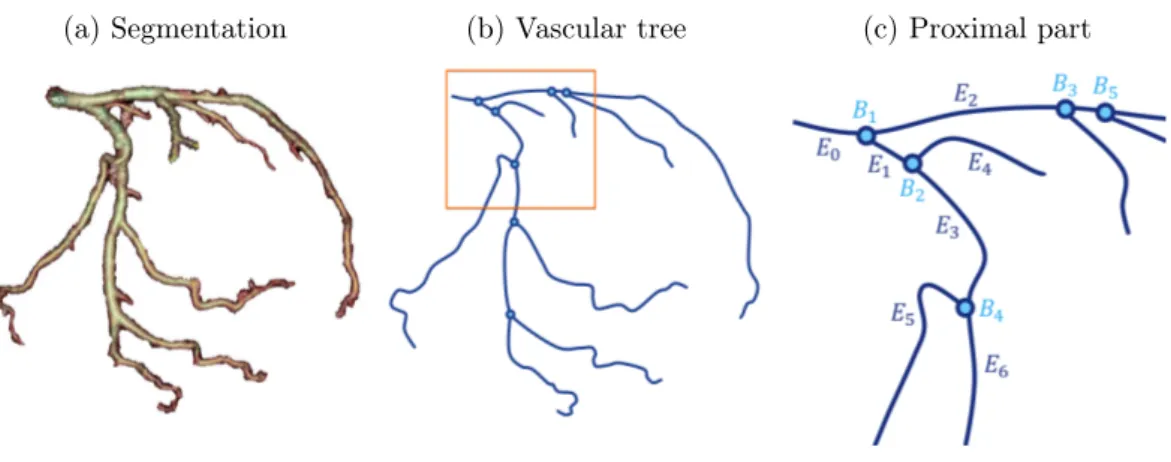
4 Sparse Geometrical Representation of the Vasculature 45 4.1 Model: 3D Coronary Vessel Tree . . . 45
4.1.1 Vessel Segmentation . . . 46
4.1.2 Geometrical Representation of the 3D Vasculature . . . 49
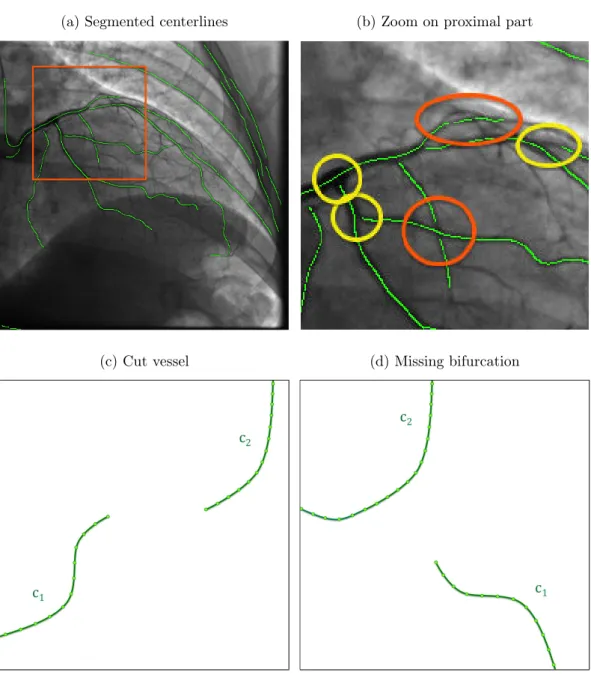
4.2 Data: 2D Projected Vasculature. . . 51
4.2.1 Vessel Enhancement . . . 52
4.2.2 Centerline Extraction . . . 56
4.2.3 Vascular Graph Extraction . . . 60
vi Contents
5 The Iterative Closest Curve Framework 69
5.1 General Principle . . . 70
5.1.1 The Fréchet Distance. . . 70
5.1.2 The Iterative Closest Point Algorithm . . . 76
5.1.3 The Iterative Closest Curve Algorithm . . . 79
5.1.4 Framework Discussion . . . 81
5.2 Application to 3D/2D Vasculature Registration . . . 81
5.2.1 Choice of Curves to be Matched . . . 82
5.2.2 Candidates Selection . . . 84 5.2.3 Pairing Procedure . . . 87 5.2.4 Transformation Optimization . . . 88 5.3 Experiments. . . 90 5.3.1 Qualitative Results . . . 90 5.3.2 Limitations . . . 93
6 Tree-Topology Preserving Pairing 97 6.1 Definitions and Challenges . . . 98
6.2 Building a Tree Pairing . . . 100
6.2.1 Improved Candidates Selection . . . 102
6.2.2 A Top-Down Approach . . . 106
6.3 Rating a Tree Pairing . . . 110
6.3.1 Curve Pairing Score . . . 110
6.3.2 Tree Pairing Score . . . 112
6.4 Tree Pairing Algorithm. . . 113
6.4.1 Optimal Substructure Formulation . . . 114
6.4.2 Divide-and-Conquer Algorithm . . . 115
6.5 Tree-Topology Preserving Iterative Closest Curve . . . 118
7 Registration Quality Evaluation 121 7.1 Literature on Registration Errors . . . 122
7.1.1 Errors based on Gold-Standard Transformation . . . 122
7.1.2 Errors based on Ground-Truth Correspondences. . . 124
7.1.3 Necessity of new Error Measures . . . 125
7.2 Ground-Truth . . . 127 7.3 Errors Definition . . . 128 7.3.1 Alignment Error . . . 130 7.3.2 Pairing Error . . . 132 7.4 Validation . . . 134 8 Experiments 141 8.1 Clinical Database Description . . . 141
8.2 Pairings at Initial Position . . . 143
8.2.1 Imposing Coherence Improves Pairings . . . 145
Contents vii 8.3 Accuracy Assessment . . . 150 8.4 Robustness Study . . . 150 8.5 Discussion . . . 156 9 Conclusion 163 9.1 Main Achievement . . . 163 9.2 Contributions . . . 164 9.3 Perspectives . . . 166 9.3.1 Automatic Initialization . . . 166 9.3.2 Outlier Rejection . . . 169 9.3.3 Non-Rigid Registration. . . 173
9.3.4 Applicability to Other Fields . . . 177
A List of Publications 181 A.1 Journal and Conference (with review committee) . . . 181
A.2 Supervised Master’s Thesis . . . 181
B Top-10 Causes of Death Globally 183 C X-ray Image Formation and Background Removal 185 D Vascular Graph Extraction 189 E Compute Least Squares Non-Rigid Alignment 193 F The French Touch 195 F.1 Introduction . . . 195
F.2 Conclusion. . . 197
F.2.1 Principaux aboutissements. . . 197
F.2.2 Contributions . . . 198
Chapter 1
Introduction
This Ph.D. thesis takes root in the image-guided interventions field. In this vast domain, we will focus on the world of percutaneous procedures inside the arterial network. Imaging systems are used to help a physician, often called an intervention-alist, in delivering therapeutic treatment through very specific tools inserted inside the patient. The technical challenge is to provide images adapted to the clinical task, which depends on the type of intervention performed. The work presented in this manuscript is focused on Percutaneous Coronary Intervention (PCI). Images (also called frames) acquired by the interventional guiding system show the tools navigated inside the patient’s vasculature with respect to the anatomy. Their ca-dence can reach 30 frames per second with a spatial resolution of 0.2mm. Such performances fulfill most of the clinical expectations but interventionalists are now addressing more complex cases demanding new visualization capabilities. It is now very common that multiple images acquired on different types of equipments are available prior to the clinical procedure. Combining them with the frames guiding the intervention is seen as a potential way to propose a complete visualization of the information available along the procedure. Guiding images provided by the in-terventional system are projections of the patient anatomy onto a plane. They are produced by the attenuation of the X-ray beam by anatomical tissues and other ob-jects in the field of view. In these images, vessels can be superimposed, which does not facilitate their interpretation. Additional difficulties arise with the presence of total occlusion of an artery branch.
Occluded portions are not visible in the live two dimensional (2D) modality because the lumen1
X-ray absorption cannot be modified by the use of contrast agent. Fusing a pre-operative scanner acquisition with the live projective images could improve the intra-operative guidance. The Computed Tomography Angiogra-phy (CTA) scan allows to assess the patient’s vasculature in three dimensions (3D). This type of acquisition is mostly performed for diagnostic purposes, helping to determine whether the patient needs a revasculariation procedure or not. Interest-ingly, the reconstructed volume includes not only the lumen of the vessel, but also additional information such as the type of material constituting the vessel wall. A typical information available in this modality is the presence of calcification along the arteries, which is characteristic of the presence of a lesion and interacts with the therapy delivery. Moreover, for patient suffering from a complete occlusion, the occluded channel is formed of a specific material that can be seen in the CTA volume. Both types of information are crucial during the navigation phase of the
1
2 Chapter 1. Introduction intervention and the cardiologist could benefit from a fused visualization of these elements extracted from the pre-operative CTA and the live navigation images. This requires to bring them into the same referential. Description of this procedure and associated clinical needs is the main goal of Chapter 2.
These two acquisitions represent the patient at two different times (before and during the intervention) on two imaging systems without pre-defined link between them. Aligning two modalities representing the same reality is referred in the liter-ature as the registration problem. To find the transformation between the 3D CTA and the 2D guiding image, 3D/2D registration algorithms generally optimize an objective function quantifying the distance between structures of interest. Most of the methods from the literature, classified in Chapter3, involve a segmentation step to create a geometrical representation of the vasculature (feature). Feature-based algorithms rely on correspondences between segmented structures, called pairings. The success of a registration algorithm depends on the relevance of the pairings.
Building relevant pairings is one of the major axes of research regarding feature-based registration. By taking into account the nature of the segmented structures to be matched, several articles from the literature claim to increase accuracy and robustness of their algorithms. Prior knowledge on the vessels can be used to define local information, such as the tangent or local curvature, to improve the pairing pro-cedure or to penalize non-coherent pairings between neighbors along the structure. However, most of the literature algorithms do not consider the vasculature globally. We deeply explain in Chapter 4 how features are extracted and which geometrical representation best fits for each modality. We then define a framework dedicated to the registration of curves that ensures to preserve the curvilinear structures along the iterations. This proposed framework extends the Iterative Closest Point (ICP) algorithm to curves.
The algorithm we propose, which is called the Iterative Closest Curve (ICC) al-gorithm, has a general formulation that can be applied to situations where the key features are curves. The ICC algorithm, which is the subject of Chapter 5, alter-nates two steps: building pairings between curves extracted from the two modalities; and finding the transformation that minimizes the Fréchet distance between paired curves. The Fréchet distance is a curve-to-curve distance based on a point pairing set between curves that preserves order along them (and thus the curve topology). By matching entire curves and optimizing the Fréchet distance, the ICC framework allows to take into account the curvilinear structure of the features in a global way. In a further step, we consider that the coronary arteries are arranged as a tree: vessels are “connected” to each other at bifurcations. This particular arrangement is composed of two types of connectivities defining the vasculature topology: con-nectivity along curves and concon-nectivity at bifurcation points.
In Chapter6, we create a tree pairing procedure preserving both types of con-nectivities. This constitutes a challenge because of the projective nature of the 2D modality. Actually, most of the tree matching methods from the literature assume that nodes of the tree (in our case bifurcations) can be identified in both modal-ities. This assumption is not satisfied in our 3D/2D application because of vessel
3 superimpositions in the 2D image. We thus define what is a pairing preserving the tree-topology in the 3D/2D case and consider a top-down approach to pair the 3D vasculature, starting from the root curve pairing and progressively continuing the recursion in the branches of the tree. A given tree pairing is evaluated using a score that takes into account the geometrical distances between paired curves but also their resemblances. Finding the best tree pairing is expressed as an optimization problem. It is solved by a divide-and-conquer algorithm avoiding the combinato-rial explosion that would be induced by trying all possible tree-topology preserving pairings.
The tree pairing procedure can be easily introduced in the ICC framework, forming the Tree-topology Preserving ICC (TP-ICC). To evaluate this algorithm, we designed two error measures relative to each output expected from a registration algorithm: the resulting alignment and pairings. Particular efforts have been made in Chapter 7 to design measures that are intuitive, clinically relevant and based on a single ground-truth (which can be obtained without impacting the standard clinical procedure). The alignment error quantifies the distance between the 3D structure projection at the registered position and where it should be accordingly to the ground-truth. The quality of the pairings formed by the registration algorithm is assessed by the pairing error. These two measures demonstrate good correlation with visual assessment and are used in Chapter 8 to evaluate the proposed registration algorithm.
Chapter 2
Clinical Context
Contents
2.1 Pathologies and Treatments . . . 5
2.1.1 Atherosclerosis, Stenosis and Occlusion . . . 5
2.1.2 Minimally Invasive Surgical Procedure . . . 7
2.2 Angiography . . . 12
2.2.1 C-arm System . . . 12
2.2.2 Angiography and Guidance . . . 15
2.3 Computed Tomography Angiography . . . 18
2.3.1 X-ray Scanner System . . . 18
2.3.2 Pathology Diagnosis and Therapy Planning . . . 19
2.4 Complementarity between Modalities . . . 22
2.4.1 Clinical Application Propositions . . . 23
2.4.2 Registration Necessity . . . 25
2.1
Pathologies and Treatments
According to the World Health Organization (WHO), the ischaemic heart disease is the number 1 cause of death both globally and for the high income countries (see Figure B.1 of Appendix B). Also known as coronary artery disease, it represents 13.2% of all deaths around the world. This Ph.D. thesis is made in the context of interventional cardiology, which is a key treatment option for coronary artery disease. In this section we shortly present the atherosclerosis pathology and its clinical consequences. We have focused our interest on coronary heart disease and the minimally invasive treatment that is at the center of this thesis.
2.1.1 Atherosclerosis, Stenosis and Occlusion
Atherosclerosis is the main syndrome responsible for cardiovascular diseases. It is characterized by a progressive deposit, called plaque, on the inner wall of arteries. This atheromatous plaque is composed of fat, cholesterol and calcium deposit. In a fist stage, the vessel wall enlarges to include the presence of plaque, while maintain-ing a normal cross section size. In a later stage, the plaque starts to progressively narrow the artery lumen1
and can eventually impact the blood flow (see Figure2.1).
1
6 Chapter 2. Clinical Context Atherosclerosis is a chronic disease that remains asymptomatic for decades until this narrowing, also called stenosis, limits the blood supply to organs.
Figure 2.1: Atherosclerosis process illustrated by [National Heart, Lung, and Blood Institute,2015b]. (Top) healthy vessel, (bottom) plaque deposit in an artery forming a stenosis that decreases the blood flow.
Depending on the anatomy impacted by the blood flow reduction, atherosclerosis can induce several different diseases. A complete blockage of cerebral vessels can induce death of neurons due to the lack of nutrients and oxygens contained in the blood. This phenomenon is known as a stroke. Like every organ, the heart has its own vascularization composed of the coronary arteries and the cardiac veins. Coronary arteries constitute the only blood supply of the myocardium (the heart muscle). A narrowing of these vessels, also called a stenosis, can create imbalance between demand and supply regarding oxygen and nutrients. It can induce chest pain, especially during activity and stress, when the demand is high, which stops at rest. These symptoms usually feel like a pressure or squeezing in the chest called angina.
Over time, plaque can harden and even rupture that causes a thrombus (or blood clot). If a thrombus completely blocks an artery, a whole part of the myocardium is cut off any supply and may lead to a heart attack. Non-irrigated cardiac cells will die eventually if the blood flow is not restored soon enough, creating scars in the muscle that can induce severe clinical complications. If the blockage occurs slowly, the heart muscle may develop small collateral vessels, or detours, in order to re-root the blood flow. These small created vessels may not be able to supply enough the heart muscle demands and thus angina symptoms can be felt.
A Chronic Total Occlusion (CTO) is a total blockage of a coronary artery that has been present at least for 3 months. If the blockage is present for less than 3 months it is called a total coronary occlusion. The CTO is generally formed of the
2.1. Pathologies and Treatments 7 atheromatous plaque (as in the stenosis) and an old thrombus. Older occlusions have higher concentration of fibro-calcific material (also called hard plaque). However, dating a CTO is a challenging task. According to [Branislav,2013], one third of the patients undergoing a stenosis diagnosis suffers from CTO. In case of CTO, multiple revascularization strategies can be used, all involving strong skills from the clinician. 2.1.2 Minimally Invasive Surgical Procedure
Well known risk factors of atherosclerosis are: lack of physical activities, smoking, unhealthy diet, high cholesterol level and diabetes. Playing on these causes con-stitutes the first treatment of atherosclerosis and can be achieved by a change of lifestyle or drugs. For more severe states, two medical procedures can be performed to treat consequences and re-vascularize properly the myocardium.
The older and less and less used approach is the Coronary Artery Bypass Graft-ing (CABG). It is an open-heart surgery where an artery or a vein from another area of the patient’s body is taken and used to re-orient the flow. This bridge from the aorta or the left internal thoracic artery to a place distal to the occlusion, com-plements the restricted blood flow (see Figure 2.2b). It is still the most common open heart surgery in the US and involves an opening of chest bone to access the heart and stop it during the intervention. After this (ultra) invasive procedure, the patient typically spends 2 days in an intensive care unit and then around 5 days in a less intensive care area of the hospital. Full recovery is expected between 6 to 12 weeks after the intervention.
An alternative to open heart surgery is a minimally invasive treatment proce-dure that allows the patient to go home the day after the intervention and return to work after only one week. Actually, the patient generally remains awake during the intervention. This procedure is called angioplasty or Percutaneous Coronary Intervention (PCI) and involves the navigation of clinical tools inside the patient’s vasculature. This minimally-invasive procedure is performed in a cardiac catheter-ization laboratory, also called a “cath-lab”, where an X-ray system (presented in Figure2.3) allows the cardiologist to visualize the tools inside the patient. This in-terventional system is at the center of this Ph.D. thesis and will be further described in Section 2.2.1.
The PCI treatment consists in opening narrowed or blocked coronary arteries from the inside under the X-ray guidance. A presentation of the overall procedure is provided in [National Heart, Lung, and Blood Institute,2015a], which illustrates nicely the following steps. A needle is used to make a small hole in the blood vessel, usually the groin, to introduce a thin wire into the artery. This guide-wire helps the clinician to position a tapered tube correctly, which is also called a sheath or introducer. A thin flexible tube, called a catheter, is then inserted in the femoral artery via the sheath. The catheter is then navigated through the patient’s vasculature up to the aorta and the entry of coronary arteries, as illustrated in Figure2.4a. A dedicated X-ray dye, called contrast medium, can be injected through the arteries via this catheter. Coronary arteries are usually not X-ray visible, but
8 Chapter 2. Clinical Context
(a) Typical vasculature (b) Bypass graft
Figure 2.2: Illustration of Coronary Artery Bypass Graft (CABG) extracted from [Johns Hopkins Medicine,2015a]. (a) shows typical healthy coronaries around the heart, (b) presents different bypass constructed using veins (in blue) and arteries (red).
Figure 2.3: Interventional system in the cath-lab. Interventional Guiding System, IGS-520 from GE Healthcare during a PCI intervention.
2.1. Pathologies and Treatments 9 filling them with iodine contrast product allows to temporary visualize them until the contrast product is flushed. This procedure is called an angiography and allows the clinician to diagnose any blockage or narrowing along the arteries, as illustrated in Figure2.4b.
(a) Catheterization (b) Angiography
Figure 2.4: Illustration of the angiography procedure. (a) shows the path of the catheter from the groin to the aorta and (b) is the angiography obtained from an injected sequence recorded by an interventional system. The orange circle highlights a stenosis.
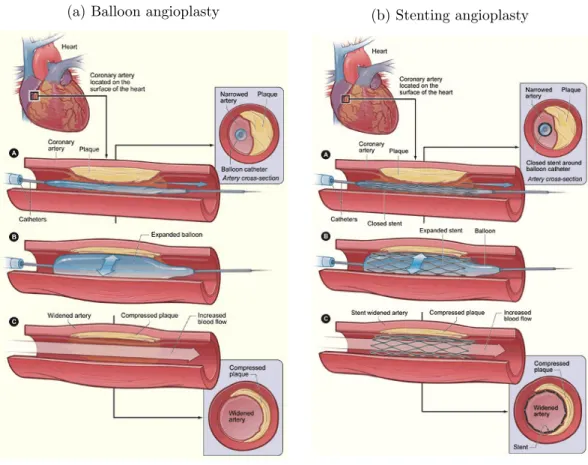
Until now the previously described angiography procedure serves a diagnostic purpose, but does not intend to cure the narrowing problem. To this aim, a guide wire is slided into the catheter to reach the stenosis or occlusion. Then, a balloon (with an elongated shape) is threaded over the guidewire up to the lesion. When its placement with respect to the lesion has been checked, by using the marker-balls at the balloon extremities, a pump is used for the inflation. The balloon is kept inflated to compress the plaque (see Figure 2.5a) during several seconds with a pressure depending on the type of balloon and the type of lesion2. After deflation
the artery opening is controlled by an angiography and then the balloon is removed if the blood flow is correctly restored. Otherwise, this operation can be repeated. Balloon angioplasty is safer than the CABG, but arteries are more frequently re-narrowed over time.
The risks of re-stenosis can be greatly decreased by using a fine mesh tube of wire,
2
The pressure applied to the balloon is counted as multiple of the atmosphere pressure (e.g. 10 atmospheres).
10 Chapter 2. Clinical Context
(a) Balloon angioplasty (b) Stenting angioplasty
Figure 2.5: Illustration of an angioplasty procedure. (a) and (b) respectively illus-trate the balloon angioplasty procedure and the stenting procedure.
2.1. Pathologies and Treatments 11 called a stent, that prevents the artery walls to collapse again after the procedure (two examples are provided in Figure2.6). The metal structure of the stent supports the artery walls and prevents the artery to be narrowed or blocked again. The stent is wrapped around the deflated balloon and when the balloon is inflated to compress the plaque, the stent expands and apposes the artery walls. After balloon deflation the stent remains in the artery as illustrated in Figure 2.5b. The correct deployment of the stent can be controled using elaborated techniques called “digital stent enhancement”. It consists in combining images with a low contrast to noise ratio in order to boost the stent visibility in the image. If no further medical action is needed, the balloon and guide wire are removed, then the catheter is pulled back. Over time, cells in the artery grow to cover the stent mesh creating an inner layer identical to normal artery walls.
(a) Cypher stent [Cardiovascular News,2004] (b) Xience V [Diagnostic and Interven-tional Cardiology,2014]
Figure 2.6: Example of stents.
The procedure usually takes from thirty minutes to three hours depending on the difficulty of the case. In case of complete blockage of the blood flow, which corresponds to a total occlusion, a “digging”-step that is also called crossing is nec-essary to go through the occlusion. When the guide-wire has dug its way through the entire occlusion, a balloon can then be introduced and the clinical procedure steps that follows are the same as in stenosis treatment. While the PCI technique to treat stenosis is well established by the community, optimal clinical approaches regarding Chronic Total Occlussion (CTO) procedures are still discussed. Several examples are:
• Antegrade approach: from the aorta, the guide-wire follows the blood flow and the occlusion is attacked from the anterior side. A schematic representation is provided in Figure2.7.
• Parallel wire technique: two guide-wires are used to penetrate the occlusion. They are slided alternatively to dig a way through the occlusion.
12 Chapter 2. Clinical Context • Retrograde approach: this technique takes advantage of the collateral vessels3
to pass the occlusion from the posterior side.
Chronic Total Occlusion (CTO) treatment requires greater skills from the cardiolo-gist and increases the procedure duration as well as the complication risks.
Figure 2.7: Digging through a CTO.
2.2
Angiography
The previous section was focused on the clinical side of the atherosclerosis pathology and treatment. In this section, we depict the Percutaneous Coronary Intervention (PCI) from the imaging point of view. Angiography can be used for diagnostic purposes in order to asses the size and length of a lesion. It is crucial to decide if a stenosis should be treated or not. Angiographic images are also involved during the navigation of the guide-wire in the patient’s vasculature.
2.2.1 C-arm System
As it has been mentioned earlier, the C-arm system is the central element of an interventional room called a “cath-lab”, which stands for catheterization laboratory. This system allows to visualize the patient’s anatomy by the mean of X-rays to perform minimally invasive interventions. Interventional tools are navigated under live control of the imaging system, which provides real-time X-ray video when the clinician presses the X-ray pedal. The main components of the cath-lab are presented in Figure2.8. The core of the cath-lab is the C-arm system, which acquires the X-ray images of the patient.
The denomination “C-arm” comes from the shape of the structure supporting the X-ray source and detector (see Figure 2.9). The X-ray tube generates a cone beam in the direction of the flat-panel detector. The beam direction is controlled by two perpendicular rotation axes, indicated in blue in Figure 2.9, that allow the system to image the anatomy in every possible angulation4
. To image the anatomy of interest, translational degrees of freedom are necessary to position the patient correctly in the X-ray beam. The patient lies on his back on a table that is able to translate along three axes.
X-ray are produced by a beam of electrons traveling from the cathode to the anode inside the source part of the C-arm (also called the X-ray tube). X-photons
3
Collateral vessels are “bridges” between the left and right coronary artery trees that are created to re-root the blood flow to non-irrigated myocardium regions.
4
2.2. Angiography 13
Figure 2.8: Interventional Guiding System, IGS-520 from GE Healthcare, presenting main components of the cathlab: the C-arm system, the table and the large display monitor.
Figure 2.9: Interventional Guiding System, IGS-740 from GE Healthcare. The detector and X-ray source are linked by a C-shape structure. Blue arrows indicate the two rotational articulations of the system that allows to attain any possible angulation.
14 Chapter 2. Clinical Context are produced in random directions at the surface of the anode, modeled by a point, called the X-ray source. All photons are absorbed by the tube except for a small opened window limiting the X-ray beam to a given solid angle in the space. Several metal filters are applied to the beam as well as a square shape collimator that cuts off the beam outside a given region of interest. X-rays are attenuated by the anatomy of the patient according to the Beer-Lambert law that is further detailed in Section 4.2.1. Remaining photons are caught by the detector and are transformed into an electric signal by a matrix of photo-diodes. Capacitors gather intensity created by these photo-diodes that is then converted into pixels intensity that will form the resulting image. Historically, fluorescent screens were used to convert X-ray photons, which have given the name of ‘fluoroscopy’ to the resulting image. The same principle is still used in several detectors, where a scintillator layer converts X-photons into visible photons.
This fluoroscopic image corresponds to the conic projection of the patient anatomy onto the image plane. The corresponding projective operator is a 3 × 4 matrix that allows to project a point in the three-dimensional (3D)-space of the interventional room into the 2D image plane. These matrices can be determined us-ing a model of the C-arm system and the set of parameters describus-ing the machine configuration during the acquisition. An alternative is to perform a calibration of the system geometry for many angulations. In both cases, the parameters needed to retrieve the system state are transfered simultaneously with the images. Multiple acquisition modes are available in an imaging system, resulting in different frame rates (up to 30 images per second), dose levels, post-processing and so on. These settings may depend on:
• The clinical application: C-arm systems are used to guide cerebral aneurysm treatment in neuroradiology, chemoembolization of liver tumors in interven-tional oncology or stent placement in Percutaneous Coronary Intervention (PCI).
• User preferences and patient’s size: a compromise between image quality and radiation dose must be found, following the ALARA principle (As Low As Reasonably Achievable).
• The moment of the procedure: in PCI the expectations in terms of image quality are not constant at each step of the procedure. For example, a low-dose acquisition mode, is called fluoro, is generally used during the guide-wire navigation phase to limit the patient’s exposure to radiations. On the con-trary, diagnostic angiograms and controls of the stent deployment necessitates optimal image quality. This latter acquisition mode is called record or cine5.
In this Ph.D. thesis, only cine angiography sequences, which were performed during the procedure, will be used. In the following, we will most of the time refer
5
As indicated in the name “record”, images acquired with this mode are always recorded and then transfered automatically using the DICOM standard.
2.2. Angiography 15 to the X-ray images by the general term of fluoroscopy. This term is the mostly used in the image processing community and we decided to follow.
2.2.2 Angiography and Guidance
The C-arm system allows to visualize clinical tools inside the patient in real time, which opens the way to minimally invasive procedures. An example is provided in Figure2.10awhere the patient’s heart is imaged. One would note that even if some anatomical parts are visible, both the heart and coronary arteries cannot be seen in the image. Actually, the X-ray image formation is based on the attenuation of the beam by the patient’s anatomy. This property is often called “radio-opacity”. Contrasts in the image are thus due to the difference between the attenuation co-efficient of penetrated structures. The attenuation coco-efficient of the bones, which are composed of a dense arrangement of calcium, is much higher than soft tissues (such as muscles). Therefore, ribs can be well distinguished in the image. Actually, images presented here have been automatically processed by the system to make the bony structure less apparent since they are not important for the targeted clinical application. However the attenuations of fat, muscle tissues and blood are quite similar to each other and thus the coronary arteries cannot be distinguished in the image.
In order to visualize these structures of interest an iodine injection is performed into the patient’s arteries via the catheter. Iodine, by nature, has much higher attenuation coefficient than the surrounding tissue. When it fills the vasculature, vessels becomes well contrasted in the projected image as shown in Figure 2.10b. For this reason the iodine product is also called contrast medium. The clinical exam that involves to inject contrast medium in order to reveal the vasculature is called an angiography. It allows to diagnose atherosclerosis and decide on the recommended type of treatment. This modality allows to assess the gravity of a stenosis by measuring the degree of occlusion (which can be done with a tool called Quantitative Coronary Analysis, or QCA). However, the distinction between soft tissues and calcified plaque cannot be made in the angiography contrary to the X-ray scanner imaging (see Section 2.3).
Besides this diagnostic application, contrast medium injections are also crucial during the navigation phase of the minimally invasive treatment. The guide-wire navigation down to the pathologic area is performed under X-ray guidance because its extremity is built of a material with a high radio-opacity. The guide-wire tip is well identified in fluoroscopic images (see Figure 2.11a) but an injection of contrast medium is necessary to visualize its position with respect to the vasculature (Fig-ure2.11b). Angiography is also often recorded after a stent implantation to assess if the blood flow has been correctly restored.
Angiography allows live guidance during the intervention. By visualizing the guide-wire with respect to the vasculature, the clinician is able to adapt his/her gesture to reach the pathology location. However, three major limitations due to the nature of this modality have been identified:
16 Chapter 2. Clinical Context
(a) Non-injected acquisition (b) Angiography acquisition
Figure 2.10: Fluoroscopic images with (b) and without (a) contrast medium injec-tion. Arrows in (a) point out the injection catheter (orange), ribs (yellow) and the diaphragm boundary (white).
(a) Non-injected navigation phase (b) Injected navigation phase
Figure 2.11: Guide-wire navigation in the coronary arteries under X-ray guidance (fluoro acquisition mode). (a) shows a non-injected image where the guide-wire tip is visible but not the arteries. (b) injected image where the position of the guide-wire with respect to the patient’s vasculature can be seen.
2.2. Angiography 17 • Because of the projective nature of the fluoroscopy, the angiogram may be difficult to interpret at some locations. Vasculature superimpositions shall be limited as much as possible around the vessel of interest since it leads to indetermination in guide-wire position. It is the physician that is in charge to place the C-arm to reach this desirable situation.
• A displacement along the projective direction cannot be well assessed in the projective image. Thus, the navigation inside a given vessel is facilitated if the projection axis is orthogonal to a plane containing the vessel. This lack of depth perception imposes the cardiologist to adapt the C-arm angulation to the step of the intervention and the coronary of interest.
• In case of total occlusion, contrast medium cannot fill the occluded vessel that remains invisible in the angiography (see Figure 2.12a). The navigation through the occlusion is performed without visualizing the vessel and is so called “blind”-navigation.
The two first problems often impose the clinician to change angulation of the system along the intervention. Some cardiologists prefer to deal with complicated clinical cases using two simultaneous different views of the patient anatomy by using a bi-plane system (as the one presented in Figure2.13). However, this practice is quite marginal in the interventional cardiology community and is beyond the scope of this thesis.
(a) Before stenting angioplasty (b) After stenting angioplasty
Figure 2.12: Chronic Total Occlusion (CTO) treatment by stenting angioplasty. In (a) despite the contrast medium injection the occluded part, visible in (b) after treatment, remains invisible in the angiography.
18 Chapter 2. Clinical Context
Figure 2.13: Example of bi-plane system: Innova IGS 630 from GE Healthcare. The secondary plane acquisition is provided by a ceiling mounted system.
2.3
Computed Tomography Angiography
The Computed Tomography Angiography (CTA) can complement the interventional angiography. It consists in a 3D reconstruction of the patient’s anatomy by the mean of X-rays while contrast medium is injected intra-venously to reveal the vasculature. The fine resolution in terms of contrast is a strong advantage of the scanner and allows to see and quantify calcifications in the atheromatous plaque.
2.3.1 X-ray Scanner System
The Computed Tomography scanner, or CT-scan, is used to image the patient’s anatomy in three dimensions. It produces a set of images called slices6
that consti-tute a 3D matrix of voxels called a volume. A slice can be seen as the intersection between a plane and the patient anatomy. A scanner is composed of a table, where the patient is lying, and the imaging system with a cylindrical hole in its center (an example is provided in Figure 2.14). The imaging system is constituted of a ring structure on which is attached a generator producing X-rays inside the ring. On the other side, photons are received by a detector attached to the ring struc-ture. The underlying physical principle is quite similar to the one involved in the C-arm system presented in Section 2.2.1. The X-ray beam is attenuated by the anatomy depending on the attenuation coefficient of the anatomy. But contrary to the interventional angiography procedure, the source and detector of the CT-scan are continuously rotating around the patient during the acquisition.
From this set of rotational X-ray projections a volume can be reconstructed using tomography theory. The CT-scan acquires a set of projections at different angula-tions that allows to reconstruct the imaged volume in 3D. Details on reconstruction
6
2.3. Computed Tomography Angiography 19
Figure 2.14: Revolution CT from GE Healthcare.
theory can be found in [Langet, 2013], even if the subject was about Cone-Beam CT reconstruction. Theoretical requirements to ensure an analytical solution of the reconstruction problem can also be found in the same Ph.D. thesis. This work highlights the importance of acquiring enough data (sub-sampling problem) from a static object (motion artifacts7) in order to produce a relevant reconstruction. In
the case of heart anatomy reconstruction, the main issue is the motion induced by the beating heart. Historically, CT-scanners only acquired very few slices such as single slice CT, where the detector was composed of a 1D array of cells. To acquire the multiple slices composing the volume, the table where the patient is lying is translated during the acquisition.
In cardiac-CT, the main goal is to provide a static reconstruction of the anatomy of the heart and not a dynamic (3D+t) reconstruction of the moving heart. Electro-cardiogram (ECG)-gated acquisitions allow to synchronize the X-ray measurements with the heart movement in order to limit artifacts due to motion. CT reconstruc-tions of the heart are usually performed to represent the heart during the diastolic phase, when the myocardium is quite stable. Thanks to the ECG, X-ray are gener-ated during diastole phase until enough data have been acquired to reconstruct the heart. This technique also limits the irradiation of the patient by avoiding X-ray emission during cardiac phases that are not used in the reconstruction (such as the systolic phase). Recent advances in CT technology allows to perform an acquisi-tion of the whole heart in less than 0.3 seconds as in the revoluacquisi-tion CT from GE Healthcare presented in Figure 2.14.
2.3.2 Pathology Diagnosis and Therapy Planning
Besides a slightly different technology, the underlying physical principal of the CT-scan imaging is the same as the interventional fluoroscopic system. It is based on the
7
The term artifact denotes structures in the reconstructed volume that does not correspond to the patient anatomy but to errors in reconstruction.
20 Chapter 2. Clinical Context X-ray attenuation of the anatomy and the resulting intensities of the reconstructed volume elements (called voxels) are linked to the X-ray attenuation coefficient. As mentioned in Section 2.2.2, vessels present quite similar X-ray transparency than muscle tissues, which make them hard to distinguish. To make them appear, a con-trast medium similar to the one used intra-operatively is injected in the patient’s vasculature. However, contrary to interventional angiography, the Computed To-mography Angiography (CTA) does not involve intra-arterial injection and thus avoid catheterization. The iodine contrast medium is injected intra-venously to be diluted in the patient’s vasculature, revealing thus arteries and veins in the result-ing reconstruction. This CTA exam allows to detect coronary artery blockage in a non-invasive way, contrary to the catheterization procedure depicted in Section2.2.2
that is a minimally but still invasive procedure. It thus results into a faster and safer exam that can be handled by a nurse or a radiologist.
Even if the reconstructed volume allows to assess the patient’s anatomy in 3D, vessels are curvilinear structures that are not best visualized by a slice scrolling. Ac-tually, the vasculature mostly appears as white dots and small tubular sections in the standard axial, coronal and sagittal views (see Figure 2.15). Several workstations propose to fully take advantage of the reconstructed volume by providing software tools adapted to the vessel visualization. The Volume Viewer application presented in Figure 2.15 allows easier understanding of the anatomy. By automatically seg-menting the coronary artery trees, the Auto-Coronary-Analysis tool (Volume Viewer from GE Healthcare) presents a 3D rendering of the coronary arteries that can be rotated to see the anatomy from different points of view. This rendering allows the clinician to find optimal angulations to visualize best some vessels of interest, which can be pushed to the interventional C-arm system in order to retrieve the same point of view during the intervention.
Besides this planning purpose, the cardiac CTA acquisition is mostly performed for the diagnosis of coronary artery disease. The interventional angiography, de-scribed in Section 2.2.2, allows to assess the significance of the stenosis based on the estimation of the diameter reduction of the artery at the lesion location. A de-crease of less than 50% between the vessel diameter outside and inside the stenosis is usually declared as non-significant. When the lumen of the vessel is reduced by more than 70% (of the diameter) the artery becomes obstructed enough to decrease blood flow. A CTA acquisition can be performed to visualize calcifications in the atheromatous plaque. Calcifications are calcium deposit along artery walls that are important to be taken into account in the classification of a lesion. Degree of calci-fication of a lesion impacts several choices made during the stent placement such as the type of balloon used, the pressure applied and the time of inflation. Example of calcified arteries are presented in Figure 2.16 in a so called curve-view (provided by the Volume Viewer application). Calcifications appear as a white deposit along the vessel border.
The CTA modality is also of great interest in case of Chronic Total Occlusion (CTO) where the artery down the occlusion are not visible in interventional angiog-raphy. Two reasons allow the visualization of the occlusion in CTA:
2.3. Computed Tomography Angiography 21
Figure 2.15: Volume Viewer from GE Healthcare interface on coronary visualization. In reading order: coronary volume rendering, coronal slice, axial slice and sagittal slice.
Figure 2.16: Curve-views of Left Anterior Descending (LAD) coronary arteries of two patients presenting calcified plaque. Calcifications are the hyper-intense signal at the border of the vessel.
22 Chapter 2. Clinical Context • Intra-venous contrast product injection. Contrary to intra-arterial injection, the diluted intra-venous injection allows to visualize all the vasculature re-ceiving flow. As highlighted in Section 2.1.1, collateral vessels can grow to irrigate parts of the myocardium that have been cut from the occlusion. In these vessels the flow is very limited and a sudden intra-arterial (retrograde) injection usually fails at showing vessels down the occlusion. However, in the case of intra-venous injection the whole vasculature receives a proportion of contrast medium for a while. Contrast medium has time to reach vessels down the occlusion by collaterals and contrasts the occluded vessel as shown in Figure 2.17.
• Better contrast sensitivity. The CTA modality allows to distinguish smaller contrast differences than the interventional modality and particularly the cal-cifications. If a stent has already been implanted in the patient’s arteries, its location, deployment and interaction with the surrounding vessels are also visible in the reconstructed volume.
Therefore, this pre-operative CTA allows to characterize the composition of the occlusion as well as its length and tortuosity. Knowing the nature of the occlusion is very important during the crossing phase of minimally invasive CTO treatment.
Figure 2.17: Lumen view of an occluded vessel (the occlusion is delimited by the orange lines). Calcifications in the plaque are visible as well as the length of the occlusion (between the two orange boundaries).
Reconstructing the coronary vasculature of the patient via CTA provides im-portant inputs for the diagnosis of the pathology and the planning of an upcoming intervention. Dedicated visualization tools greatly facilitates these two goals by presenting the content of the reconstruction in a comprehensive manner8
.
2.4
Complementarity between Modalities
The previously described interventional angiography (Section2.2) and cardiac CTA (Section2.3) are showing great complementarity in the scope of atherosclerosis
dis-8
Such tools necessitate a robust segmentation of the coronary arteries, which are depicted in Section4.1
2.4. Complementarity between Modalities 23 ease. At least, the following three points have been identified:
• Easy depth perception versus superimposition and foreshortening. The interventional angiography shows the vasculature of the patient projected into an image plane. By nature, this projected image lacks of depth perception and creates ambiguities at vessel superimposition. Bifurcations9
often leads to such superimpositions and necessitates experience from the clinician to navi-gate though. In CTA all bifurcations are well defined and the 3D segmentation of the coronary tree allows to understand easily the patient anatomy.
• Visible occlusion versus blind navigation. In case of Chronic Total Oc-clusion (CTO), the 3D angiography allows to characterize the ocOc-clusion in terms of length and tortuosity. CTA also allows to assess the degree of calcifi-cation of an atheromatous plaque that is important to consider when treating both stenosis and total occlusion. All the previous types of information are not visible intra-operatively and the navigation in case of total occlusion must be achieved without seeing the surrounding vessel.
• Static observation versus live guidance. Surely the pre-operative CTA provides crucial information. However, the guidance of tools in the patient’s vasculature must be controlled in real time. In the 2D live angiogram, the clinical tool position with respect to the current state of the vasculature allows the cardiologist to attain the pathology location.
The interventionalist could benefit from a fused visualization of CTA and live an-giography and thus taking the best of the two modalities.
2.4.1 Clinical Application Propositions
In the CTO summit of 2015 [Escaned,2015], several fusion applications have been raised to take advantage of the two complementary modalities. In case of total occlusion, the projection of the volume on top of the fluoroscopic image can give an idea on the progression of the guide-wire inside the occlusion. Figure 2.18gives an idea on what could be a 2D roadmap application in case of occlusion. A variant of this 2D roadmap can be to only highlight calcifications, which may also be useful in the case of simpler lesion such as standard stenosis.
A 3D roadmap application can also be imagined, where the tip of the guide-wire is segmented and is shown in the 3D vessel of interest. Intra-operative presentation of the 3D roadmap can be of different natures:
• Adding a sort of progress bar on the lumen view of Figure2.17. • Adding guide-wire tip positioning in the curve-view of Figure2.16.
• Providing a reconstruction of the guide-wire positioned in the 3D vasculature that is seen from an interesting point of view (that may be non-reachable by the system due to collisions).
9
24 Chapter 2. Clinical Context (a) Fusion CTA angiogram (b) Guide-wire tip zoom
Figure 2.18: Example of 2D roadmap fusion during a CTO treatment while the guide-wire is entering the occlusion. The location of the occluded vessel (pointed by orange arrows) is visible thanks to the projection of the coronary tree extracted from the CTA.
Pre-operative CTA reconstruction can also be used to propose optimal angulations to the clinician during the procedure. Thanks to the 3D vasculature, one is able to predict superimposition of vessels that may occur and find system positioning that limits their number. If the guide-wire tip is localized (by segmentation) the system can also adopt automatically the angulation minimizing the projective foreshorten-ing of the vessel currently navigated.
From a patient perspective, the fusion application could lead to multiple benefits: • Fusion may facilitate the gesture of the clinician by increasing its confidence, which may lead to decrease the procedure duration. Faster procedures are synonymous of less X-ray exposure for the patient and thus less risks induced by radiations.
• After a recorded angiography sequence used to perform the registration, the cardiologist can benefit from the fusion application to save contrast medium injections. In fact, some small injections used to confirm the guide-wire posi-tion with respect to the vasculature could have been avoided if 3D registered vessels projection is available during the procedure. Saving contrast medium is of interest for the patient since a large amount of contrast material may induce complications after the procedure.
2.4. Complementarity between Modalities 25 2.4.2 Registration Necessity
All applications of the previous Section 2.4.1 necessitate to bring the two different modalities into correspondence. Actually, both acquisitions represent the patient anatomy at two different states: before the intervention inside the X-ray scanner; and during the intervention imaged by the C-arm system. Each state refers to its own three-dimensional system of coordinates, denoted Spre for the CT-scanner and
Sintra for the C-arm system, and the relation between them is unknown. In order to fuse these two complementary modalities, a step of registration is necessary.
To be used in a 2D roadmap application, the registration algorithm should pro-vide a transformation ˆT from Spre to Sintra that aligns correctly the pre-operative
volume with the patient. This transformation must compensate the absence of ge-ometrical pre-defined link between the two systems and the relative displacement of the patient. It may also compensate a temporal change such as the respiratory motion and the heart beat. For this role, the alignment is not expected to require more complex model than a standard rigid transformation. Finding this optimal transformation may be sufficient to propose a roadmap in the image plane. But correspondences between the two modalities must be provided to build a 3D appli-cation. Actually, for a given position of interest in the 2D vasculature we are looking for the corresponding vessel portion in 3D. Thus, in addition of a correct alignment, a registration algorithm must also provide relevant correspondences between the pre-operative and intra-operative acquisitions.
Chapter 3
State of the Art
Contents
3.1 Registration Problem Overview. . . 27
3.2 Intensity-Based Methods . . . 30
3.2.1 “Pure” Intensity-Based Methods . . . 31
3.2.2 RoI Intensity-Based Methods . . . 32
3.3 Feature-Based Methods. . . 33
3.3.1 Vasculature as a Set of Points. . . 34
3.3.2 Vasculature as a Spatial Distribution . . . 36
3.3.3 Vasculature as a Set of Local Vessel Portions . . . 38
3.3.4 Vasculature as a set of Curves. . . 40
3.3.5 Vasculature as Trees and Graphs . . . 41
3.4 Thesis Point of View . . . 42
3.1
Registration Problem Overview
The literature on medical image registration is quite huge and involves a wide variety of applications. Multiple reviews have been published on this topic, such as [Maintz and Viergever,1998;Zitová and Flusser,2003; Sotiras et al., 2013], which provide an interesting lecture grid to classify different registration algorithms. In this thesis, we will restrict the literature description to the 3D/2D registration case, which is a topic of its own, as shown in the review of [Markelj et al., 2012]. But before, we propose an overview of the registration problem and the key points of its resolution in order to familiarize the reader with the topic of registration in general and the major challenges to overcome.
In the example of our application, the 3D pre-operative Computed Tomography Angiography (CTA) and the 2D angiography performed during the intervention give complementary information that influences the therapy strategy. The intervention-alist could benefit from a fused visualization of CTA and live angiography but it necessitates bringing them into the same referential. Actually, both modalities rep-resent the patient anatomy at two different states: before the intervention inside the X-ray scanner; and during the intervention imaged by the C-arm system. Each state refers to its own three-dimensional system of coordinates and the relation between them is unknown. Integrating the pre-operative anatomical information into the
28 Chapter 3. State of the Art live guiding image to provide a guidance application necessitates to bring these two referential into correspondence.
This alignment is represented by a transformation that compensates the absence of geometrical pre-defined link between the two systems, the relative displacement of the patient between the two acquisitions and the change in anatomical states. Finding the optimal transformation that best aligns the pre-operative 3D anatomy with the 2D intra-operative one refers to the registration problem. It is generally expressed as solving the following equation:
ˆ
T = argmin
T ∈Ω D (T (Y), X )
(3.1) where ˆT is the sought transformation aligning the two complementary modalities Y and X , Ω is the set of admissible transformations, and D is called the objective function and quantifies the distance or dissimilarity between structures.
As mentioned in different survey of medical image registration, such as [Maintz and Viergever, 1998;Zitová and Flusser, 2003;Markelj et al., 2012; Sotiras et al., 2013], choosing the objective function D, the set of admissible transformations Ω and the minimization approach to compute Equation (3.1) constitute the major chal-lenges of a registration problem. Moreover, to be used in a roadmap1
application, a registration algorithm should provide correspondences between the two structures to be matched. Actually, for a given 2D position x ∈ X of interest to the clinician, a roadmap application should be able to provide the 3D corresponding point y ∈ Y. Besides its importance regarding the clinical application, the notion of pairing is strongly related to the problem of registration.
Objective Function: The objective function D quantifies the quality of the align-ment between the two structures to be matched Y and X . Its definition is crucial since D constitutes the core of Equation (3.1) and thus determines the registration problem. It is assumed that the objective function reaches its minimum for a per-fect alignment. Multiple properties are appreciated regarding an objective function such as a limited number of local minima (even the convexity), its linearity or the efficiency of its computation. Two types of objective function can be distinguished depending on the information representation. Intensity-based objective func-tion, also called similarity measure in the literature, refers to a direct comparison of two images. In the case of CT-to-X-ray registration, since the physical principle of the two acquisitions is the same, efforts to bring the two modalities into compa-rable images are relatively low compared to MR-to-X-ray for example. This class of objective functions is usually preferred when structures to be matched are not sparse in the image or challenging to segment. They can involve direct pixel inten-sity comparison, estimations based on image gradients or enhanced version of the original image. Feature based objective function involves a sparse geometric representation of the information contained in both modalities to evaluate the qual-ity of the registration. These approaches are independent of the type of modalqual-ity
1
3.1. Registration Problem Overview 29 involved but strongly depend on the segmentation accuracy. The objective function corresponds to the distance between the two structures and depends on the feature representation. Features can be a set of non-connected points, curves composed of connected points or even more complex structures such as trees or graphs.
Admissible Transformations: The set of admissible transformations Ω consti-tute the set over which the optimization will be run. Its dimension is called the number of degrees of freedom (DoF) allowed by the transformation and corresponds to the minimal number of parameters necessary to define the transformation (for example a rigid transformation in the 3D space is a 6 DoF transformation). The more Degrees of Freedom are allowed in the registration, the better fit can be ob-tained during the registration. However, the difficulty to converge to the correct registration transformation during the optimization procedure is increased with the number of DoF. Usually registration algorithms progressively increase the number of DoF along the iterations, starting from a translation only (3 DoF or 2 DoF in the case of 3D/2D registration), then a rigid registration (6 DoF). Non-rigid regis-tration algorithms can involve a global affine transformation (9 DoF) optimization, or more local deformation fields based on interpolation theory such as spline-based deformation field. When the number of DoF becomes large, as in Free Form Defor-mation (FFD) where a displacement vector is attached to every point of interest in the structure, a regularization term is often added to the objective function in order to keep a plausible deformation fields.
Optimization Procedure: The optimization procedure aims at finding the global optimum of the objective function D over the set of admissible transfor-mations Ω. It can be based on an iterative best displacement in Ω such as the nearest neighbor or the downhill simplex method. Other optimization procedures are based on the gradient of function D such as the gradient descent or the Newton method. While the first type of methods is best suited when the local gradient estimation is not easily available, the latter is usually faster to converge toward the closest local minimum. A third type of methods relies on pairings between the two structures and generally consists in alternating the estimation of the pairing and the optimization of the transformation based on this pairing set. All these methods can be robustified by integrating them into a multiple initialization framework, where multiple starting positions are evaluated to run the registration.
Pairing Procedure: In this manuscript, we use equivalently the terms “pairings”, “correspondences” and “matches” to refer to the association of two different modal-ities. The pairing procedure refers to the construction of a set of pairings that is crucial to build a roadmap application and is used in most of feature based registra-tion methods. In clinical applicaregistra-tion of 3D/2D registraregistra-tion, providing the posiregistra-tion in the 3D pre-operative modality that corresponds to the current location of the navigated tool in the 2D guiding image is called a roadmap application.
Correspon-30 Chapter 3. State of the Art dences between 3D and 2D locations are given by the pairing set resulting from a registration algorithm. Thus, the pairings between structures is of great importance in an interventional application scope even if it is rarely addressed in the literature on 3D/2D vascular registration.
The registration problem is sometimes solved in the literature following an ex-trinsic approach: using calibration tricks, synthetic markers or manual anatomical point-of-interest identification. These methods may have an impact on the clinical procedure and will not be considered in the scope of this state of the art. Our study is focused on approaches relying on the informative content extracted from both modalities that are qualified in [Markelj et al., 2012] as intrinsic methods. Intrin-sic registration algorithms can be classified in two classes: intensity-based and feature-based. The first class of methods directly uses image contents to build the objective function to be optimized. Both modalities are thus considered as im-ages (volume of voxels and grid of pixels) that will be compared with a similarity measure comparing their respective intensities. On the contrary, feature-based al-gorithms involve a sparse representation of the vasculature to be matched. Each modality is no more considered as a set of pixels (or voxels) but as a geometrical representation of the information contained in the image. Several intensity-based approaches use segmentation to restrict the computational time as well as focusing the objective function into informative parts. Such methods will not be classified as feature-based if no sparse geometric representation is involved. In the following sections we will be interested in both types of registration techniques, focusing our classification onto 3D/2D registration of vascular structures that only involves single plane acquisition.
3.2
Intensity-Based Methods
Intensity-based registration methods address the registration problem, expressed in Equation (3.1), by minimizing a dissimilarity criterion (or maximizing a similarity criterion) D based on voxels and pixels intensities. In the case of 3D/2D registration, comparing both modalities requires to bring them into the same dimensional space. As mentioned in [Markelj et al.,2012], one can either compare the volume projection into the image plane, or reconstruct a volume from the 2D modality. The latter is beyond the scope of this work since we expect single view acquisition that is not sufficient to provide a 3D reconstruction. Thus, in the following we will consider dissimilarity criterion between two images: IY related to the fluoroscopic image and
IX obtained from the projection of the 3D volume VX. We distinguish two classes of
methods: “pure” intensity-based methods that use all pixels and voxels information to run the registration; and Region of Interest (RoI) focused intensity-based method that involve a step of segmentation to restrict pixels that will contribute to the similarity measure.