HAL Id: hal-01365234
https://hal.archives-ouvertes.fr/hal-01365234
Submitted on 11 Oct 2017
HAL is a multi-disciplinary open access
archive for the deposit and dissemination of
sci-entific research documents, whether they are
pub-lished or not. The documents may come from
teaching and research institutions in France or
abroad, or from public or private research centers.
L’archive ouverte pluridisciplinaire HAL, est
destinée au dépôt et à la diffusion de documents
scientifiques de niveau recherche, publiés ou non,
émanant des établissements d’enseignement et de
recherche français ou étrangers, des laboratoires
publics ou privés.
Photoluminescent polysaccharide-coated germanium(IV)
oxide nanoparticles
V. Lobaz, M. Rabyk, J. Pánek, E. Doris, F. Nallet, P. Štěpánek, M. Hrubý
To cite this version:
V. Lobaz, M. Rabyk, J. Pánek, E. Doris, F. Nallet, et al.. Photoluminescent polysaccharide-coated
germanium(IV) oxide nanoparticles. Colloid and Polymer Science, Springer Verlag, 2016, 919 (1-3),
pp.Online �10.1007/s00396-016-3882-y�. �hal-01365234�
Photoluminescent polysaccharide-coated germanium(IV)
oxide nanoparticles
V. Lobaz1&M. Rabyk1&J. Pánek1&E. Doris2&F. Nallet3&P.Štěpánek1&M. Hrubý1
Abstract In current biomedically oriented research, the de-velopment of a biomimetic nanoparticle platform is of interest to provide a molecular toolbox (i.e., allowing easy modular exchange of its parts depending on actual needs while being nontoxic and allowing real-time recognition and tracking using various methods, such as fluorescence). We report the development of germanium(IV) oxide-polysaccharide com-posite particles possessing these properties. The nanoparticles are based on a crystalline germanium oxide core with a size range of 20–30 and 300–900 nm. Two new simple coating techniques were compared for the preparation of the photoluminescent polysaccharide-coated germanium(IV) ox-ide nanoparticles. The germanium(IV)-based core allows for in situ polysaccharide attachment via direct chelation. In ad-dition, the nanoparticles were coated with thin layer of silicon oxide. After coating, 3-(triethoxysilyl)propyl isocyanate was grafted onto the surface, and the polysaccharides were immobilized on the particle surface via a covalent urethane linkage, which allows for an even more stable polysaccharide coating than that obtained via chelation. This approach
provides access to a new material platform for biological track and image applications.
Keywords Germanium oxide nanoparticles . Polysaccharide coating . Photoluminescent label
Introduction
In vitro and in vivo noninvasive imaging with nanoparticles will play a crucial role in biomedical research and applications in the near future [1–3]. Solid tumors spontaneously accumu-late biocompatible polymers, polymer micelles, liposomes, and nanoparticles that are smaller than 200 nm in size due to the leaky nature of the newly formed tumor neovasculature and poor or missing lymphatic drainage in the solid tumor tissue. This so-called enhanced permeation and retention (EPR) effect is relatively universal for many solid [4,5]. Due to their subcellular size, nanoparticles allow labeled liv-ing cells to be implanted into tissue for noninvasive imagliv-ing of the tissue repair process [6,7]. Nanoparticles can be used as trackers inside the cells in spatial [8] and in situ determination modes (intracellular sensors [9], e.g., for pH monitoring [10] or drug release [11]). For most biomedical applications, the nanoparticles are coated with biocompatible polymers (e.g., poly-(ethylene glycol) is the most frequently studied) as well as natural polysaccharides to make them invisible to the im-mune system [12].
Germanium oxide is a dielectric material with a refractive index of 1.7 [13], which is much higher than those of other transparent dielectric oxides. Bulk germanium oxide is trans-parent in visible and infrared spectra and has a band gap of 5 eV [14]. However, in the nanoparticulate state, germanium oxide exhibits violet and blue photoluminescence due to the oxygen vacancies on the surface of the crystals [15–17].
* V. Lobaz lobaz@imc.cas.cz
1
Institute of Macromolecular Chemistry AS CR, Heyrovsky Sq. 1888/2, 162 06 Prague 6, Czech Republic
2
CEA, iBiTecS, Service de Chimie Bioorganique et de Marquage, 91191 Gif-sur-Yvette, France
3 Centre de recherche Paul-Pascal–CNRS, Bordeaux University, 115
Germanium oxide is sparingly soluble in water making biodegradation possible due to the formation of germanate ions [18]. Depending on the pH, germanates can form polyatomic ions and precipitate as insoluble hydroxides or oxides [19]. Based on the pH-dependent solubility, ger-manium oxide nanoparticles have been synthesized in wa-ter solutions at acidic pH values. Inwa-terestingly, in equilib-rium with the solution, only submicrometer particles with a cubic shape are formed. The smaller sizes were extracted from the reaction mixture during the early stages of the reaction. The particle size varied depending on the nature of the anion in the acids, and smaller sizes were achieved with phosphoric acid [20]. Alternatively, the incubation of GeO2 powder with hydrochloric acid solution and then,
subsequently, with polyvinylpyrrolidone (PVP) solution under hydrothermal conditions results in cubic submicron particles, containing up to 2 wt% of polymer [21]
Better control of the nanoparticle size was obtained during the hydrolysis of germanium(IV) ethoxide (TEOG). The reaction was carried out either by addition of TEOG to water or water-ethanol mixtures [22,23]. A small-angle X-ray scattering study of TEOG hydrolysis in water demonstrated that (Ge–O)xoligomers were formed
at all of the studied mole fractions of germanium. However, their crystallization into GeO2 particles only
occurred when the molar concentration of germanium exceeded its solubility [24]. The morphology of the parti-cles changed from hexagonal to cubic with dominant growing (111), (011), and (101) faces [20]. The addition of lysine to water inhibits the crystallization of germani-um oxide due to the formation of complexes between germanate poly-ions and the amino acid. Additionally, deviations from the cubic shape have been observed be-cause the presence of lysine complexes on the surface alters the growth rates of different crystal faces. A similar inhibition trend of the crystallization along with alteration of the crystal shape has been reported by Boix et al. [25] for the mineralization of TEOG in water with citrate buff-er, silk protein, and Ge28, which is a germanium-binding peptide. As it is demonstrated by Wysokowski et al., the hydrothermal hydrolysis of TEOG in the presence of chi-tin sponges results in the composite material where the crystalline GeO2 nanoparticles were grown exclusively
on the surface of chitin [26]. However, their dimension of around 200-nm size is in the same range, as reported by Javadi et al. for hydrolysis of TEOG in water/ethanol mixtures [23]. During the formation of colloidal particles by hydrolysis of TEOG, water plays a dual role as a re-actant for the hydrolysis and as a solvent for the germa-nium species at an excess stoichiometric ratio. The in-crease in the solubility triggers agglomeration or even ripening into big cubic monocrystalline particles that are similar to those obtained by synthesis in pure water [23,
24]. Another approach for controlling the size of germa-nium oxide particles involves performing the synthesis within the confined space of inverse micelles. The micelle core determines the size of the particle but the morpholo-gy of the particle changes from polycrystalline to mono-crystalline depending on the water content [27, 28].
Germanium(IV) has very low toxicity and forms strong complexes with 1,2-diols, 1,3-diols, and 1-amino-2-ols as polysaccharides, which have been used for germanium(IV) recovery from an aqueous solution in hydrometallurgy [29,
30]. Therefore, coating of germanium(IV)-containing nano-particles may be achieved by simple addition of a polysaccha-ride solution to the nanoparticle dispersion. To the best of our knowledge, this approach has not been previously described in the literature. We have developed a very straightforward technique for the preparation of these nanoparticles. This method is very versatile with regards to the choice of coating material. Imaging and tracking with these nanoparticles is feasible via photoluminescence of the germanium(IV) oxide core itself by incorporating the probes into the polysaccharide shell or by incorporating a suitable radionuclide (e.g.,66Ge,
68
Ge,69Ge,71Ge, or77Ge depending on half-life and decay type requested) into the inorganic core [31]. In addition, the low but non-negligible solubility of germanium oxide in water allows for the elimination of the material from the living or-ganism after use.
In this study, we demonstrate the preparation of polysaccharide-coated germanium(IV) oxide nanoparticles with controlled properties, and due to their potential biomed-ical applications, we critbiomed-ically compare the two techniques of polysaccharide attachment to the nanoparticle surface (i.e., direct chelation and binding via urethane linkage) (Scheme1).
Materials and methods
Chemicals
Germanium(IV) oxide powder (99.99 %), TEOG (99.95 %), silicon(IV) ethoxide (TEOS) (98 %), 3-(triethoxysilyl)propyl isocyanate (95 %), calcium hydride (98 %), anhydrous dimethylacetamide (99.8 %), poly(ethylene glycol)-3000 (PEG), polyvinylpyrrolidone 40,000 (PVP), dextran from Leuconostoc spp. (MW 450–650,000 Da), dextran from Leuconostoc spp. (MW 6000 Da), tetramethylrhodamine iso-thiocyanate dextran (TRITC-dextran, MW 65–85,000), anhy-drous lithium chloride (98 %), dextrin from maize starch, in-ulin from chicory, glycogen from oyster, and chitosan oligo-saccharide lactate were purchased from Sigma-Aldrich Ltd. (Prague, Czech Republic). Hydrochloric acid (35 % water solution), ammonium hydroxide (25 % water solution), etha-nol (99.8 %), isopropaetha-nol (99.7 %), and acetonitrile (99.5 %) were purchased from Lachner (Brno, Czech Republic). All of
the chemicals were used without additional purification. For synthetic purposes, the ethanol was dried by stirring with cal-cium hydride followed by distillation. For analytical purposes, the glycogen (GG) was labeled with fluorescein isothiocya-nate (FITC-GG) and Dy-615 (Dy-615-GG) [32].
Synthesis of GeO2nanoparticles in aqueous acidic
environment
In a typical synthetic procedure, germanium(IV) oxide (0.1 g) was dissolved in water (2 mL) with 25 % aqueous ammonium hydroxide (0.13 mL). Then, the polysaccharide solution in water (0.0036 to 0.1 g in 2.37 mL, more details are given in supporting information, Table S1) was mixed with the ammo-nium germanate solution. After addition of 35 % aqueous hydrochloric acid (1.69 mL), the particles were allowed to grow with stirring at ambient temperature for 24 h. The pre-cipitate was collected by centrifugation at 5000 rpm for 2 min and washed three times by repeated mixing with 0.5 mL of water followed by centrifugation and decantation. The puri-fied nanoparticles were stored as a water dispersion. For anal-ysis, an aliquot of the nanoparticle dispersion was dried under ambient conditions and then under vacuum at 60 °C for 3 h.
Synthesis of GeO2nanoparticles in ethanol
TEOG was mixed with anhydrous ethanol or a solution consisting of 0.03 g of PEG or PVP. A 0.5 or 25 % aqueous ammonium hydroxide solution was added, and the mixture was stirred in a closed vessel at ambient temperature for 24 h. The nanoparticles were collected by centrifugation at 18,000 rpm for 15 min and washed three times by repeated mixing with 0.5 mL of ethanol followed by centrifugation and decantation. The purified nanoparticles were stored as ethanol dispersions. For characterization, the nanoparticles were dried under ambient conditions and then under vacuum at 60 °C for 3 h. (For details, see the supporting information, Table S3.) Coating with SiO2
For the coating, an aliquot of GeO2nanoparticles in ethanol
was mixed with the TEOS solution in ethanol under sonica-tion. Aqueous ammonium hydroxide was promptly added dropwise or in gradually increasing doses during 60 min of sonication. Then, the mixture was sonicated for 120 min. After sonication, the nanoparticles were collected by centrifu-gation at 18,000 rpm for 15 min and washed three times by repeated mixing with aliquots of ethanol followed by
centrifugation. After purification, the particles were stored as ethanol dispersions. (For details, see the supporting informa-tion, Table S4.)
Functionalization with 3-(triethoxysilyl)propyl isocyanate
An aliquot of GeO2nanoparticles that were coated with SiO2
(0.5 mL, 4 × 10⁻⁴mol GeO2) in ethanol was transferred to
anhydrous dimethylacetamide by repeated centrifugation (10,000 rpm, 5 min), decantation of the supernatant, and re-dispersion. After three cycles of centrifugation/re-dispersion, the overall volume of the dispersion was adjusted to 10 mL, and 3-(triethoxysilyl)propyl isocyanate (50μL) was added. The reaction was carried out at 100 °C for 12 h. The nanopar-ticles were collected by centrifugation, washed three times by centrifugation, decantation, and re-dispersion, and stored as a dispersion in 1 mL of anhydrous dimethylacetamide. Binding of polysaccharides
0.1 g of the polysaccharide was dissolved in 5 mL of anhydrous dimethylacetamide containing 8 wt% LiCl. Then, 0.5 mL of isocyanate-functionalized nanoparticles (2 × 10⁻⁴mol GeO2) in
dimethylacetamide was added, and the mixture was stirred at ambient temperature for 12 h. The particles were purified from the unreacted polysaccharide by performing centrifugation, de-cantation, and re-dispersion three times in dimethylacetamide. The purified polysaccharide-coated particles were stored as dimethylacetamide dispersions (5 mL, 2 × 10⁻⁵ mol GeO2).
For characterization, the particles were dried under ambient conditions and then under vacuum at 60 °C for 3 h.
Characterization
Fourier transform infrared (FTIR) spectra were recorded on a PARAGON 1000 PC FTIR spectrometer (Perkin Elmer, USA) equipped with a Specac MKII Golden Gate Single Reflection ATR System. The sample powders were placed on a diamond crystal, and spectra in the 4000–400 cm−1range
with a step size of 4 cm−1were collected in reflection mode with an angle of incidence of 45°.
The Raman spectra were recorded on a NXR FT-Raman module using a 1064 nm NIR excitation laser attached to a Thermo Nicolet 6700 FTIR spectrometer (Thermo Scientific, USA). The sample powders were placed between two microscopy coverslips, and the spectra were collected using 128 scans in wavelength range of 12,500 to 350 cm−1 with an 8 cm−1step.
The UV-vis spectra of the nanoparticle dispersions were recorded on an Evolution 220 UV-Visible Spectrophotometer (Thermo Scientific, USA) in a quartz cuvette. Prior to the mea-surement, the baseline was recorded for the cuvette with pure solvent.
The photoluminescence spectra of the nanoparticles that were coated with labeled polysaccharides were recorded on a FP 6200 spectrofluorometer (Jasco Analytical Instruments). The carbon content of the GeO2-polysaccharide
nanoparti-cles was determined using a Perkin-Elmer CHNS 2400 analyzer.
The specific surface area was measured using a gas adsorp-tion technique on a Gemini VII 2390 (Micromeritics Instruments Corp., Norcross, USA) with nitrogen as the sor-bate. Prior to characterization, the sample powders were vacuum-dried at 100 °C for 10 h. The surface area was calcu-lated from the Brunauer-Emmett-Teller (BET) adsorption/ desorption isotherm using Gemini software.
The distribution of the hydrodynamic diameter and zeta po-tential of the GeO2nanoparticles were measured on a Nano-ZS
Zetasizer ZEN3600 Model (Malvern Instruments, UK). Scanning electron microscopy (SEM) was performed with a Vega TS 5135 microscope (Tescan, Czech Republic) using secondary electron imaging at 30 kV. All of the micrographs were recorded under high vacuum at an accelerating voltage of 30 kV using a secondary electron detector. A drop of the sample dispersion was placed on a microscopy glass, dried, and coated with a 4-nm layer of platinum. The particle size distributions were obtained by counting the dimension of 200 particles with ImageJ software. More details are available in the supporting information (Figures S1–S11, Table S2).
Transmission electron microscopy (TEM) was performed on a Tecnai Spirit G2 TEM (FEI Brno, Czech Republic). A drop of the sample dispersion was placed on a carbon-coated copper grid and dried under ambient conditions.
Thermogravimetric analysis (TGA) was carried out on a Perkin Elmer TGA 7 Thermogravimetric Analyzer (Norwalk, CT, USA) at ambient atmosphere with a heating rate of 20 °C/min.
The wide-angle X-ray scattering (WAXS) experiments of the nanoparticle dispersions were performed using a pinhole camera (Molecular Metrology System, Rigaku, Japan) at-tached to a microfocused X-ray beam generator (Osmic MicroMax 002) operating at 45 kV and 0.66 mA (30 W). The camera was equipped with a removable and interchange-able imaging plate (23 × 25 cm, Fujifilm). The experimental setup covered the momentum transfer (q) range of 0.25– 3.5 Å−1with q = (4π/λ)sin(θ), where λ = 1.54 Ǻ is the wave-length and 2θ is the scattering angle. The samples were mea-sured in transmission mode.
The X-ray diffraction (XRD) measurements were per-formed on a HZG/4A powder diffractometer (Seifert GmbH, Germany) in reflection mode. From the peak positions and broadening, the crystalline size was calculated according to Scherrer’s equation (d = kλ/βsinθ, where k = 0.9 is a constant, λ is the X-ray wavelength (λCuKα= 0.154 nm), 2θ is the
scat-tering angle, andβ is the full width at half maximum (FWHM) of the diffraction peak).
Discussion
The GeO2nanoparticles were synthesized in a water solution
using the pH-dependent solubility of germanium oxide. The commercial germanium oxide was dissolved in aqueous am-monium hydroxide to form an ionic amam-monium germanate solution. Then, the reverse reaction was carried out by the addition of the acid, which led to the protonation of the germanate anions and decreased the solubility of germanate species. The formation of the colloid started immediately after the acid was added, and the reaction mixture became turbid changing to milky white with time. To synthesize the germa-nium oxide nanoparticles with an in situ formed polysaccha-ride shell, the polysacchapolysaccha-ride solution was mixed with the ammonium germanate solution prior to the addition of the acid. In the presence of the polysaccharides in the solution, the rate of colloid formation decreased, and the mixture remained transparent for nearly 1 h. Two series of these syn-theses were carried out. First, the synthesis was performed with a low concentration of polysaccharides (estimated for tenfold excess to monolayer on hypothetic 100 nm particles; see supporting information for details). Second, the synthesis was performed at a high mass concentration of 1:1 with ger-manium oxide.
The GeO2nanoparticles were also formed by hydrolysis of
the TEOG solution in ethanol after the addition of a stoichio-metric amount of water with aqueous ammonium hydroxide. In contrast to the heterogeneous water/TEOG mixtures [22,23], TEOG forms a molecular solution in ethanol. Upon addition of aqueous ammonium hydroxide, insoluble germa-nium species were immediately produced and formed colloi-dal particles. Prior to purification, the dispersion of GeO2
nanoparticles in ethanol was examined using WAXS. Then, the nanoparticles were extracted from the reaction mixture, and the dried powders were examined by XRD and FTIR.
The GeO2nanoparticles, which were synthesized in water
with or without polysaccharides, exhibited diffraction patterns that are typical of crystalline germanium oxide with a hexag-onal structure (Fig.1). The sharp diffraction peaks indicate the crystallinity of the sample, and the absence of any additional peaks indicates the phase purity of the formed GeO2. The
FWHM of the diffraction peaks, which were substituted into Scherrer’s equation, yielded values of the crystalline size that were above the applicable limit of the equation (∼100 nm). Therefore, submicron crystals of germanium oxide were formed (more details in Table S5). For the nanoparticles that were synthesized in ethanol, the diffraction pattern confirmed the formation of pure hexagonal germanium oxide phase. In this case, the peaks were sufficiently broader (Fig.1) and the crystalline size, which was calculated using Scherrer’s equa-tion, was in the 23–59 nm range (Table S5). The reflections from the crystal planes of hexagonal GeO2were previously
recorded in the ethanol-based reaction mixture, and this result
indicated that the crystallization occurred in the liquid phase prior to purification and drying of the sample.
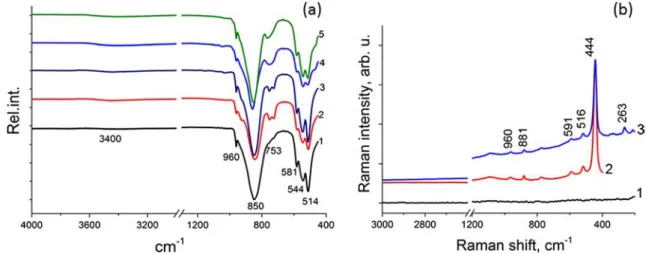
The FTIR analysis of the germanium oxide revealed the five characteristic absorption bands of α-GeO2[23], which
are identical for the commercial powder and synthesized nanoparticles (Fig. 2a). The Ge–O–Ge antisymmetric
stretching was observed at 850 and 960 cm−1, and the triplet was observed at 581, 544, and 514 cm−1and corresponded to the symmetric stretching of hexagonal GeO2. The band
locat-ed at 753 cm−1is typically attributed to the stretching of the Ge–O bond in soluble germanium species [28]. However, in our case, this band is present in the dry powders as a weak shoulder for commercial GeO2, and a more pronounced
sep-arate band was observed for the nanoparticles prepared in ethanol. In addition, this band was split into two, located at 753 and 729 cm−1for the nanoparticles prepared in water. Additionally, the broad band, which was centered at 3400 cm−1, is typically attributed to the vibrations of the– O–H bond and was observed for all of the synthesized GeO2
nanoparticles except for the commercial powder. The bands located at 753 and 3400 cm−1corresponded to vibrations of the Ge–O and O–H bonds, respectively, in the surface –Ge– OH groups. The spectrum of the GeO2nanoparticles calcined
at 600 °C contained all of the bands that are assigned to bulk crystalline germanium oxide. The FTIR spectrum of the germanium(IV) oxide particles synthesized with polysaccha-rides in an aqueous reaction mixture contained only adsorp-tion bands that are characteristic of GeO2without any
addi-tional bands that would correspond to the polysaccharide mol-ecules. Additionally, the germanium oxide nanoparticle pow-ders were examined using FT-Raman spectroscopy to identify ν(C–H) vibrations in the polysaccharide molecules at 3000– 2700 cm−1. However, only bands located at 959, 881, 591, 516, 444, and 263 cm−1, which are characteristic of GeO2
[33], were observed for all of the germanium oxide samples
Fig. 1 X-ray diffraction on GeO2nanoparticles: powder synthesized in a
(typical spectra are shown in Fig.2a(line 3), b, and more spectra are available in the supporting information, Figures S26–S27). Therefore, the polysaccharides most likely only form a lightweight-adhered surface monolayer, which is consistent with theoretical predictions and the intended architecture.
Investigation of the GeO2nanoparticles that were
synthe-sized in water by scanning electron microscopy (SEM)
revealed the significant influence of the polysaccharides on the size and shape of the GeO2particles. The representative
images and the number weighted size distributions of the GeO2particles are shown in Fig. 3 (the remaining images
and size distributions are provided in the supporting informa-tion, Figures S1–S11). The particle shape is a distorted cube with some crystal intergrowth. The length of the cubic side was used in the image analysis as the characteristic dimension.
Fig. 2 a FTIR spectra of GeO2nanoparticles: commercial powder (1),
synthesized in water (2), synthesized in water solution of dextrin (3), synthesized in ethanol (4), and synthesized in ethanol and calcined at
600 °C (5). b FT-Raman spectra of GeO2nanoparticles: glass substrate
(1), synthesized in water (2), and synthesized in water solution containing chitosan (3)
Fig. 3 SEM images and number weighted size distributions of
GeO2nanoparticles synthesized
in water solutions containing polysaccharides: a, c without polysaccharides and b, d
chitosan, 0.093 to 1 g of GeO2.
The values of the number average particle dimension are given for the first and second modes
The particle size distribution was bimodal with two overlap-ping modes of normally distributed particle sizes that corre-spond to homogeneous (smaller sizes) and heterogeneous (larger sizes) nucleation processes. In some cases, full confor-mity of the fit was achieved by addition of a third mode with a low weight at large particle sizes (see Figure S5for example). The latter was assigned to the aggregates, which were consid-ered uniform particles during image analysis. Without the polysaccharide, the particles had an average size of 884 ± 613 nm. Based on the particle size distribution (Fig.3c), the probability of heterogeneous growth was higher than that for homogeneous growth, which is in agreement with the ex-periment where a layer of GeO2was observed on the reactor
walls. The addition of the polysaccharide into the reaction mixture substantially decreased the nanoparticle size and in-creased the probability of homogeneous nucleation (Fig.3d). Along with a delay in colloid formation, this result indicates the interaction of polysaccharide molecules with germanium species, which alters the particle nucleation and growth pro-cesses. As stated by Jing et al. [20], during growth in water, the GeO2crystal changes from hexagonal bipyramidal to
trun-cated cubic and finally to perfect cubic due to the dominant growth of the (111), (101), and (011) crystal planes. The change in the particle morphology to more distorted cubes, without sharp edges in the presence of polysaccharides (Fig.3b, Figures S2–S11in the supporting information), indi-cates inhibition of the growth by adsorption of the polysac-charide molecules on the growing crystal planes. The reduced growth rate led to an increase in the nucleation rate and a decrease in the average particle dimension when the other reaction parameters were held constant. The glucose-based polysaccharides dextrin and low molecular dextran (MW 6000 Da) as well as cationic chitosan at low concentrations facilitated the largest decrease in the overall particle size. High molecular weight dextran (MW 450,000), which is composed of glucosyl and fructosyl moieties, and inulin exert only a
moderate influence on the particle formation at all concentra-tions (Table1). Moreover, at higher polysaccharide concen-trations, particles with similar or even slightly larger sizes were formed. Therefore, only a portion of the polysaccharide molecules was involved in particle nucleation and growth. However, the excess amount of polysaccharides in the solu-tion remained unused. Based on the BET surface measure-ments (Table1), the average dimension of the cubic GeO2
nanoparticles was in good agreement with the SEM character-ization for most of the samples (the values of the surface area are available in the supporting information, Table S2).
The measurements of the nanoparticleζ-potential were car-ried using the ethanol dispersions. The nanoparticles, which were obtained in water without polysaccharides, possess al-most no surface charge, which corresponds to fully protonated –Ge–OH groups on the surface. However, all of the samples synthesized with polysaccharides are strongly negatively charged. The polysaccharides, which were used in the synthe-sis are nonionic substances except chitosan, carry a positive charge. The measured negative zeta potentials of −22 to −38 mV most likely originated from the germanium-polysaccharide surface complexes, which are anionic. Remarkably, the particles that were coated with chitosan are positively charged, indicating the presence of a chitosan ad-sorption layer. Theζ-potential of these particles changes from +38 to +37 to +26 mV after the first, second, and the third cycle of washing, respectively, indicating stepwise release of the adsorbed chitosan to the solution. Additionally, the pres-ence of polysaccharides on the surface was studied using ele-mental analysis and TGA. The carbon portion in the washed and dried GeO2powders was in the 0.44 to 0.76 % weight
range, which is close to the measurement accuracy (±0.3 %) of carbon in the sample. The values of polysaccharide adsorption in mg/m2, which were calculated from the BET surface and elemental analysis, were compared to the values of the weight loss at 280–400 °C, where thermal decomposition of the
Table 1 Properties of GeO2nanoparticles synthesized in water solutions containing polysaccharides
Polysaccharide Amount of polysaccharide
per 1 g of GeO2 Average dimension (SEM), nm Average dimension (BET), nm Adsorption (BET surface, C-analysis) wt%
Weight loss (TGA) ζ-potential, mV
280–400°wt% Chitosan 0.0093 343 ± 210 1249 1.41 ± 0.73 0.30 +18.1 1 317 ± 242 213 1.85 ± 0.73 0.58 +26.4 Dextrin 0.0046 316 ± 210 338 1.25 ± 0.68 0.40 −30.5 1 429 ± 180 413 1.43 ± 0.68 0.42 −30.7 Inulin 0.0043 539 ± 417 776 1.07 ± 0.73 0.35 −38.3 1 437 ± 293 941 1.15 ± 0.73 0.47 −29.7 Dextran MW 450,000 0.0175 506 ± 274 415 1.61 ± 0.68 0.31 −37.9 1 474 ± 460 556 1.00 ± 0.68 0.61 −31.7 Dextran MW 6000 0.0037 392 ± 265 717 1.27 ± 0.68 0.30 −22.6 1 433 ± 270 452 1.07 ± 0.68 0.16 −35.3
polysaccharides is expected [34]. For the latter, which are more than twice as small, we consider the adsorption values that were calculated from the elemental analysis to be overestimated. Therefore, we assume that the polysaccharide adsorption values range from 0.16 to 0.61 wt%, which is an incomplete monolayer according to our estimates (for more details, see the supporting information, Tables S1and S2).
The GeO2nanoparticles that were synthesized in ethanol
exhibited a stepwise increase in size with reaction time. Selected samples were studied using TEM after ageing of the reaction mixture for different time intervals. The images of the GeO2particles that were extracted from the reaction
mixture after 3 h and after 30 days of ageing are shown in Fig.4(more figures and size distributions are available in the supporting information, Figures S12–S18). In the early stage, individual spherical particles with an approximate size of 25 nm were formed. The DLS study indicates that particles with an approximate size of 26 ± 5 nm were detected for a reaction time as long as 24 h (Fig.4d). Then, the hydrody-namic diameter increased to 78 ± 17 nm and remained con-stant for at least a month. The TEM image of the GeO2
nano-particles after ageing shows spindle-shaped objects with a complex morphology (Fig. 4b). The WAXS study of the spindle-shaped particles in the reaction mixture yields a crys-tallite size of 59 nm, which was calculated for the (101) crystal plane. This size is in good agreement with the size determined by TEM and DLS analyses. However, for other crystal planes,
the crystalline size was in the 23–39 nm range, which is be-tween that of the individual nanoparticles and that of the spindle-like structures (see Table S5 for details). Therefore, we suggest that aggregation of the initial nanoparticles oc-curred during ageing with formation of polycrystalline spindle-like aggregates followed by partial merging of crystals primarily along the (101) plane. To inhibit the aggregation of GeO2nanoparticles, weakly adsorbing PEG or chelating PVP
were dissolved in the reaction mixture prior to the addition of aqueous ammonium hydroxide. In the presence of PVP, based on turbidity of the reaction mixture, visually smaller GeO2
particles were formed and rapidly dissolved during the purifi-cation process. PEG forms a colloidal solution in ethanol and serves as a template for GeO2nucleation and growth, resulting
in larger particles (i.e., 227 ± 57 nm) and branched aggregates (Fig. 4c, d). Both individual and aggregated nanoparticles have a negative zeta potential of−38 mV in ethanol, which originates from the particle formation mechanism where the germanate anions that were obtained from the hydrolysis of TEOG molecules condense by dehydration into polyatomic anions and finally into solid GeO2nanoparticles bearing
ion-ized–Ge–O−groups on the surface.
The germanium(IV) oxide has low solubility in water, en-abling biodegradation. Therefore, the particles can only exist above the solubility limit in equilibrium with the dissolved species. The solubility of GeO2promotes ripening processes
during the nucleation and growth of nanoparticles, and the
Fig. 4 TEM images of the GeO2
nanoparticles that were extracted from the reaction mixture a after 10 min, b after 72 h, and c after 24 h in the presence of
poly(ethylene glycol) PEG-3000.
d Size distributions of GeO2
nanoparticles (DLS) after ageing
in the reaction mixture: 1–24 h,
2–30 days, and 3–24 h with the PEG-3000 additive
polysaccharide molecules provide only moderate control over the particle size distribution. In ethanol, the solubility of germanates and germanium oxide is significantly lower. Therefore, nucleation is favored over growth and ripening, yielding highly crystalline nanoparticles with a size range of tens of nanometers. One solution for application of GeO2
bio-medicine involves encapsulation of the GeO2core in a SiO2
shell that possesses a two order of magnitude lower solubility, which would sufficiently decrease the rate of dissolution of germanium oxide for practical applications. The encapsula-tion was carried out using a modified Stöber technique with the TEOS in ethanol and aqueous ammonium hydroxide. The amount of TEOS with respect to 1 mol of GeO2varied from
0.0168 to 1.57 mol, and aqueous ammonia hydroxide was added all at once or dropwise. In some cases, the coating was carried out in the presence of PEG or PVP to prevent aggregation. The details are given in the supporting informa-tion (Table S4). Coated GeO2nanoparticles were examined
using FTIR spectroscopy. In the spectra, the characteristic absorption bands of GeO2(i.e., 960, 850, and the triplet 581,
544, and 514 cm−1) remain unchanged, and only the band at 753 cm−1increased in intensity (Fig.5c). Along with the new band at 1440 cm−1, which was assigned to the ammonium ion, the results indicate the interaction between aqueous ammoni-um hydroxide and the surface of the GeO2nanoparticles as
well as the formation of ammonium germanate. Additionally,
two new bands appeared at 1045 and 460 cm−1due to asym-metric vibrations of the–Si–O–Si– bond and symmetric vi-brations of the–O–Si–O– bond, respectively, of amorphous SiO2[35]. To estimate the amount of SiO2with respect to
GeO2in the coated nanoparticles, the ratio of the areas under
the peaks of–Si–O–Si– at 1045 cm−1to the–Ge–O–Ge– bond at 850 cm−1was calculated (see details in the supporting in-formation, Figure S28–S30). For small amounts of TEOS with respect to GeO2(0.0168 and 0.0224 mol, Fig.5c, spectra
2 and 3), the ratio of the areas is of the same order (i.e., 0.0156 and 0.0069, respectively). During coating, we assume that most of the TEOS reacted to form SiO2. However, at a 1.57
molar excess of TEOS, the ratio was only 0.0533 (Fig. 5c, spectrum 4). Under coating conditions, the SiO2growth rate
was not dependent on the amount of TEOS but on the con-centration of aqueous ammonium hydroxide. The aqueous ammonium hydroxide was used sparingly to prevent dissolu-tion of the GeO2core particles due to the formation of
ammo-nium germanate. The hydrodynamic diameter of the coated particles and the polydispersity increased proportionally to the amount of TEOS (Fig.5d). The size distributions after coating remained unimodal, indicating the arrangement of the SiO2
material as well as the GeO2core particles (for the size
distri-bution plots and lognormal fits, see the supporting informa-tion, Figures S19–S25, Table S4). The TEM image (Fig.5a) shows the substantial changes in the particle morphology
Fig. 5 GeO2nanoparticles that
were coated with SiO2. a, b TEM
images. c FTIR spectra: not coated (1) as well as 0.0168 (2), 0.0224 (3), and 1.57 mol (4) of
TEOS to 1 mol of GeO2. d
Dependence of the
mean hydrodynamic diameter of
the GeO2@SiO2particle on the
molar ratio of TEOS to GeO2
particles in the coating reaction (error bar represents the standard deviation)
during the coating process. The polycrystalline aggregates were replaced with structures consisting of 20–30 nm objects with spherical to ellipsoidal shape (representative image shown in Fig.5a, more images are shown in the supporting information, Figures S19–S25). During the addition of corro-sive ammonium hydroxide, the polycrystalline aggregates disintegrated into the initial units. These units form loose ag-gregates, as shown in the TEM image. When the coating was carried out in the presence of PVP, the shape and morphology of the initial spindle-like structures were fully preserved (Fig. 5b). However, the hydrodynamic diameter increased from 67 ± 15 to 112 ± 32 nm, which indicates the formation of a SiO2shell around the entire particle.
Selected samples of the GeO2@SiO2core-shell particles
were functionalized with isocyanate groups by grafting 3-(triethoxysilyl)propyl isocyanate to the surface hydroxyls of the SiO2layer via the siloxane bonds. Then, the labeled
polysaccharides (i.e., Dy-615-GG (λe x c= 621 nm,
λem= 642 nm), FITC-GG (λexc= 495 nm, λem= 519 nm),
and TRITC-dextran (λexc= 522 nm,λem= 578 nm)) were
at-tached to the surface. The number average hydrodynamic di-ameter of the isocyanate-functionalized GeO2@SiO2particles
i n d i m e t h y l a c e t a m i d e w a s 1 2 1 ± 3 1 n m . A f t e r functionalization with labeled glycogens and purification, the hydrodynamic diameter remained nearly unchanged (i.e., 115 ± 28 nm for FITC-GG and 127 ± 35 nm for Dy-615-GG (Fig.6b)). The grafting of TRITC-dextran was accompanied by agglomeration, and only a portion of the polysaccharide/ particle composite, which had a hydrodynamic diameter of 66
± 9 nm, retained its dispersibility. Based on TGA, the weight fractions of polysaccharide were 12 % for Dy-615-GG, 25 % for TRITC-dextran, and 36 % for FITC-GG (details in supporting information, Figure S33), which is high and indi-cates the efficient functionalization of the isocyanate-functionalized nanoparticles.
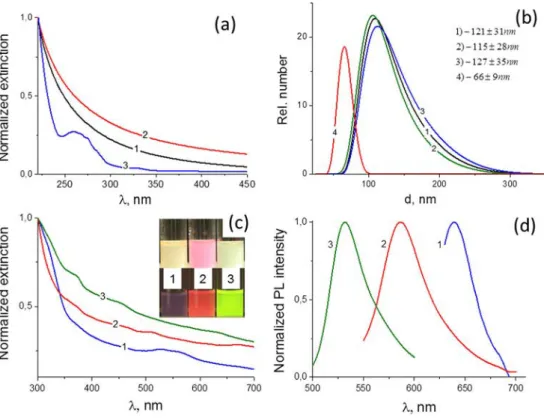
The absorption of electromagnetic radiation atλ = 260 nm by the pure GeO2nanostructures is usually attributed to the
crystal defects on the surface of the nanoparticles [17]. However, the exact mechanism remains unclear. A study of the UV absorption by GeO2was carried out using purified
samples in solvents with a UV cutoff less than λ = 210 nm. Under these conditions, the weak absorption at λ = 260 nm (Fig. 6a, curve 3) was unambiguously assigned to the germanium(IV) oxide nanoparticles that were synthesized in water. In addition, the GeO2nanoparticles that were obtained
in ethanol exhibited pure scattering (Fig.6a, curves 1 and 2), which depended only on the refractive index of the medium when all of the other conditions were equal. Despite the sur-face fraction in the GeO2nanoparticles that were formed in
ethanol being higher than that of the nanoparticles that were formed in water, their UV absorption was less than the detec-tion limit, indicating fewer surface defects. In addidetec-tion, the nanoparticles that were functionalized with labeled polysac-charides possessed a distinct color (Fig.6). Despite the strong scattering, the absorption of the labeled dyes was visible as a shoulder at the dye excitation wavelengths in the UV-vis spec-tra of the composite particles (Fig.6c). All of labeled nano-particles possess tangible photoluminescence with emissions
Fig. 6 UV-vis spectra of GeO2
nanoparticles: synthesized and measured in ethanol (1), synthesized in ethanol and measured in acetonitrile (2), and synthesized in water and measured in ethanol (3) (a). The number weighted distributions of the hydrodynamic diameter
(DLS): GeO2@SiO2-NCO
nanoparticles in
dimethylacetamide (1), grafted with FITC-GG (2), grafted with Dy615-GG (3), and grafted with TRITC-dextran (4) (b). UV-vis and photoluminescence spectra of
GeO2@SiO2nanoparticles (c, d)
with grafted polysaccharides: Dy615-GG (1), TRITC-dextran (2), and FITC-GG (3)
at 530, 585, and 639 nm for the FITC, TRITC, and Dy615 labels, respectively, which confirms the suitability of the novel nanoparticulate composite GeO2-polysaccharide material for
biological imaging multimodal imaging when the core con-sists of radioactive isotopes of germanium.
Conclusions
We developed and compared two new simple coating tech-niques to construct photoluminescent polysaccharide-coated germanium(IV) oxide nanoparticles. The GeO2nanoparticles
that were synthesized from ammonium germanate in water and TEOG in ethanol significantly differed in their colloidal properties. The polysaccharide molecules in the water solu-tions chelated with the surface of the growing GeO2crystals,
which reduced their size and resulted in the formation of an adsorbed layer on the submicron particles. In ethanol, the 25 nm GeO2nanoparticles self-assembled into 75 nm
poly-crystalline structures. These particles were coated with a SiO2
layer followed by functionalization with isocyanate moieties and fluorescently labeled with polysaccharides via urethane linkage. When comparing the direct chelation and silica-isocyanate strategies, the latter produces more hydrolytically stable nanoparticles with higher amounts of immobilized polysaccharides.
Acknowledgments The authors kindly thank Michal Pekárek and
Nikolay Kotov for the FTIR and FT-Raman spectroscopy; Jiřina
Hromádková, Alexandra Ostafinska, and Dr. Sabina Krejčíková for elec-tron microscopy; Alexandra Paruzel and Dr. Jana Kovářová for thermogravimetry; Eva Miškovská and Dr. Alexander Zhigunov for XRD and WAXS measurements; and Helena Hlídková and Dr. Daniel Horák for BET. Financial support from the Centre National de la
Recherche Scientifique—CNRS, France (project PICS no. 06130),
Ministry of Education, Youth and Sports of the Czech Republic (grant no. 7AMB14FR027), the Grant Agency of the Czech Republic (grant no. 13-08336S), the PHC-Barrande program (grant no. 31271XF), and the Ministry of Health of the Czech Republic (grant no. 15-25781A) is great-ly appreciated.
Compliance with ethical standards
Conflict of interest The authors declare that they have no conflict of
interest.
References
1. Rieffel J. Chitgupi U, Lovell JF (2015) Small 11(35):4445
2. Shanka W, Amitabha A (2015) Beilstein J Nanotechnol 6:546
3. Dobrucki LW, Pan D, Smith AM (2015) Curr Drug Targets 16(6):
560
4. Nakamura H, Jun F, Maeda H (2015) Expert Opin Drug Deliv
12(1):53
5. Prabhakar U. Maeda H. Jain R, Sevick-Muraca EM, Zamboni W,
Farokhzad OC, Barry ST. Gabizon A, Grodzinski P, Blakey DC (2013) Cancer Res 73(8):2412
6. Fidler F, Steinke M, Kraupner A, Gruttner C, Hiller KH, Briel A,
Westphal F, Walles H, Jakob PM (2015) IEEE Trans Magn 51(2)
7. Huang X, Wang Y, Sun X, Choi KY, Liu D, Choi J, Shin TH, Cheon
J, Niu G, Chen X (2014) ACS Nano 8(5):4403
8. Wu Y, Ermakova A, Liu W, Pramanik G, Vu TM, Kurz A,
McGuinness L, Naydenov B, Hafner S, Reuter R, Wrachtrup J, Isoya J, Förtsch F, Barth H, Simmet T, Jelezko F, Weil T (2015) Adv Funct Mater 25(42):6576
9. Kerr CA, de la Rica R (2015) Anal Methods 7:7067
10. Su S, Wei J, Zhang K, Qiu J. Wang S (2015) Colloid Polym Sci
293(4):1299
11. Chen P, Wang Z, Zong S, Zhu D, Chen H, Zhang Y, Wu L, Cui Y
(2016) Biosens Bioelectron 75:446
12. Sedlacek O, Monnery BD, Filippov SK, Hoogenboom R, Hruby M
(2012) Macromol Rapid Commun 33(19):1648
13. Fleming JW (1984) Appl Opt 23:4486
14. Peng M, Li Y, Gao J, Zhang D, Jiang Z, Sun X (2011) J Phys Chem
C 11:11420
15. Su Y, Liang X, Li S, Chen Y, Zhou Q, Yin S, Meng X, Kong M
(2008) Mater Lett 62:1010
16. Jiang Z, Xie T, Wang GZ, Yuan XY, Ye CH, Cai WP, Meng GW, Li
GH, Zhang LD (2009) Mater Lett 59:416
17. Wu XC, Song WH, Zhao B, Sun YP, Du JJ (2001) Chem Phys Lett
349:210
18. Laubengayer AW, Morton DS (1932) J Am Chem Soc 54(6):2303
19. Rimer JD, Roth DD, Vlachos DG, Lobo RF (2007) Langmuir
23(5):2784
20. Jing C, Hou J, Zhang Y (2008) J Cryst Growth 310:391
21. Wu W, Zou X, Li Q, Liu B, Liu Bo, Liu R, Liu D, Li Z, Cui W, Liu
Z, Li D, Cui T, Zou G (2010) J Nanomater 2011:1
22. Krishnan V, Gross S, Muller S, Armelao L, Tondello E, Bertagnolli
H (2007) J Phys Chem B 111(26):7519
23. Javadi M, Yang Z, Veinot JCG (2014) Chem Commun 50:6101
24. Davis TM, Snyder MA, Tsapatsis M (2007) Langmuir 23:12469
25. Boix E, Puddu V, Perry CC (2014) Dalton Trans 43:16902
26. Wysokowski M, Motylenko M, Beyer J, Makarova A, Stöcker H,
Walter J, Galli R, Kaiser S, Vyalikh D, Bazhenov V, Petrenko I,
Stelling A, Molodtsov S, Stawski D, Kurzydłowski K, Langer E,
Tsurkan M, Jesionowski T, Heitmann J, Meyer D, Ehrlich H (2015) Nano Res 8(7): 2288
27. Chiu YW, Huang MH (2009) J Phys Chem C 113:6056
28. Kawai T, Usui Y, Kon-No K (199) Colloids Surface A:
Physicochem Eng Aspects 149:39
29. Inukai Y, Kaida Y, Yasuda (1997) Anal Chim Acta 343:275
30. Inukai Y, Chinen T, Matsuda T, Kaida Y, Yasuda S (1998) Anal
Chim Acta 371:187
31. Chakravarty R, Valdovinos HF, Chen F, Lewis CM, Ellison PA,
Luo H, Meyerand ME, Nickles RJ, Cai W (2014) Adv Mater 26: 5119
32. Filippov SK, Sedlacek O, Bogomolova A, Vetrik M, Jirak D, Kovar
J, Kucka J, Bals S, Turner S, Stepanek P (2012) Macromol Biosci 12(12):1731
33. Khan MA, Hogan TP, Shanker B (2008) J Raman Spectrosc 39:893
34. Gekko K (1978) Agric Biol Chem 1978, 42(6):1287