HAL Id: inserm-02526763
https://www.hal.inserm.fr/inserm-02526763
Submitted on 31 Mar 2020
HAL is a multi-disciplinary open access archive for the deposit and dissemination of sci-entific research documents, whether they are pub-lished or not. The documents may come from teaching and research institutions in France or abroad, or from public or private research centers.
L’archive ouverte pluridisciplinaire HAL, est destinée au dépôt et à la diffusion de documents scientifiques de niveau recherche, publiés ou non, émanant des établissements d’enseignement et de recherche français ou étrangers, des laboratoires publics ou privés.
exercise in patients with Brugada syndrome
Daniel Romero, Nathalie Behar, Bertrand Petit, Vincent Probst, Frederic
Sacher, Philippe Mabo, Alfredo Hernández
To cite this version:
Daniel Romero, Nathalie Behar, Bertrand Petit, Vincent Probst, Frederic Sacher, et al.. Dynamic changes in ventricular depolarization during exercise in patients with Brugada syndrome. PLoS ONE, Public Library of Science, 2020, 15 (3), pp.e0229078. �10.1371/journal.pone.0229078�. �inserm-02526763�
Dynamic changes in ventricular depolarization
during exercise in patients with Brugada
syndrome
Daniel Romero1, Nathalie Behar1, Bertrand Petit2, Vincent Probst3, Frederic Sacher4, Philippe Mabo1, Alfredo I. Herna´ndezID1*
1 Univ Rennes, CHU Rennes, Inserm, LTSI - UMR 1099, Rennes, France, 2 Service Cardiologie, GH Sud.
Saint Pierre La Re´union, Saint-Pierre, France, 3 Service Cardiologie, CHU Nantes, Nantes, France, 4 Service Cardiologie, CHU Bordeaux, Bordeaux, France
Abstract
Brugada syndrome (BS) is a genetic pathological condition associated with a high risk for sudden cardiac death (SCD). Ventricular depolarization disorders have been suggested as a potential electrophysiological mechanism associated with high SCD risk on patients with BS. This paper aims to characterize the dynamic changes of ventricular depolarization observed during physical exercise in symptomatic and asymptomatic BS patients. To this end, cardiac ventricular depolarization features were automatically extracted from 12-lead ECG recordings acquired during standardized exercise stress test in 110 BS patients, of whom 25 were symptomatic. Conventional parameters were evaluated, including QRS duration, R and S wave amplitudes (AR,AS), as well as QRS morphological features, such as up-stroke and down-stroke slopes of the R and S waves (UR,DRandUS). The effects of physical exercise and recovery on the dynamics of these markers were assessed in both BS populations. Features showing significantly different dynamics between the studied groups were used alone and in combination with the clinical characteristics of the patients in a logistic regression analysis. Results show larger changes in the second half of the QRS complex throughASandUSmeasured in the right precordial leads for asymptomatic
patients, especially during recovery, when the vagal tone is more pronounced. Multivariate analysis involving both types of features resulted in a reduced model of three relevant fea-tures (DASin lead V2, Sex and heart rate recovery, HRR), which achieved a suitable dis-crimination performance between groups; sensitivity = 80% and specificity = 75% (AUC = 83%). However, after controlling the model for possible confounding factors, only one fea-ture (DAS) remained meaningful. This adjusted model significantly improved the overall dis-crimination performance by up to: sensitivity = 84% and specificity = 100% (AUC = 94%). The study highlights the importance of physical exercise test to unmask differentiated behaviors between symptomatic and asymptomatic BS patients through depolarization dynamic analysis. This analysis together with the obtained model may help to identify asymptomatic patients at low or high risk of future cardiac events, but it should be confirmed by further prospective studies.
a1111111111 a1111111111 a1111111111 a1111111111 a1111111111 OPEN ACCESS
Citation: Romero D, Behar N, Petit B, Probst V,
Sacher F, Mabo P, et al. (2020) Dynamic changes in ventricular depolarization during exercise in patients with Brugada syndrome. PLoS ONE 15(3): e0229078.https://doi.org/10.1371/journal. pone.0229078
Editor: Elena G. Tolkacheva, University of
Minnesota, UNITED STATES
Received: February 28, 2019 Accepted: January 29, 2020 Published: March 3, 2020
Copyright:© 2020 Romero et al. This is an open access article distributed under the terms of the
Creative Commons Attribution License, which permits unrestricted use, distribution, and reproduction in any medium, provided the original author and source are credited.
Data Availability Statement: All relevant data are
within the manuscript and its Supporting Information files.
Funding: This work was supported by a grant from
the French Ministry of Health (Programme Hospitalier de Recherche Clinique - PHRC Regional) 07/28-645. DR acknowledges Lefoulon-Delalande Foundation (URL: http://lefoulon- delalande.institut-de-france.fr/presentation-des-bourses-de-recherche) for financial support. The funders had no role in study design, data collection
Introduction
The Brugada syndrome (BS) is a genetic pathology associated with a high risk for sudden car-diac death (SCD) in patients with apparent structurally normal heart [1,2]. Brugada syndrome is diagnosed when ST-segment elevation �2 mm (type 1 morphology) is present in �1 lead in the right precordial leads V1, V2, positioned in the 2nd, 3rd, or 4th, intercostal space, occurring either spontaneously or after provocative drug test with intravenous administration of Na+ channel blockers [1,2]. According to the most recent international guidelines [1], the implan-tation of a cardioverter-defibrillator (ICD) is recommended (class I) in patients with a diagno-sis of BS who are survivors of an aborted cardiac arrest and/or have documented spontaneous sustained VT and should be considered (class IIa) in patients with a spontaneous diagnostic type I ECG pattern and history of syncope. However, the decision of implanting an ICD is more complex on asymptomatic patients, representing around 60% of the patients diagnosed with BS, since they have a much lower risk of arrhythmic events, recently estimated at less than 1% on the FINGER study [3]. Moreover, during a long-term follow-up, around 30% of implanted asymptomatic patients have suffered their first appropriate ICD shock in 10 or more years after the implantation time [4]. Likewise, the incidence of inappropriate ICD-shocks and other device-related complications increases with longer follow-up duration, mostly affecting young and active people with a live expectancy � 30 years. Thus, one of the main challenges today is to better identify which of the asymptomatic patients might benefit from an ICD implantation, using an appropriate risk stratification tool.
A number of depolarization disorders have been observed on BS patients, including a high prevalence of QRS late potentials (LP), fragmented QRS complexes [5], prolongation of PR/ QRS duration [6], wider S waves in inferolateral leads and rightward deviation of the axis in the terminal quarter of the QRS loop [7]. Moreover, the autonomic nervous system (ANS) function has been reported to have a significant role in unmasking differences in this pathol-ogy, particularly during exercise testing. Amin et al. [8] reported that exercise resulted in an increase of J-point amplitude in both BS and control groups. Makimoto et al. [9] evaluated the relationship between the post stress parasympathetic activation and the ST-segment change. It has also been reported that parasympathetic reactivation during early recovery, assessed through the heart rate recovery (HRR) index, tends to be higher only in BS patients with prior ventricular fibrillation (VF) episodes [8].
Recent works from our group have shown that symptomatic BS patients exhibit greater fluctuations in sinus node response to ANS in 24-h Holter recordings [10] and an increased parasympathetic modulation during incremental exercise and early recovery [11]. However, these results were mainly focused on the analysis of ANS response according to patients’ symp-tomatology. The inherent multifactorial nature of BS requires to consider other major players involved in the pathogenesis of the disease beyond the ANS. For instance, multivariate meth-ods that combine electrophysiological markers and traditional risk factors have recently dem-onstrated their usefulness for assessing the VF risk in BS patients [12]. Moreover, the
importance of multivariate approaches has been valued in [13], where the authors refer to major studies conducted in this context and suggest them as the future in BS. Therefore, the assessment of non-invasive risk markers using electrophysiological parameters in conjunction with autonomic-related markers during controlled autonomic maneuvers, appears to be of particular importance.
In this study, we propose a complementary analysis with respect to our previous works, in which advanced signal-processing methods are applied to extract quantitative markers of ven-tricular depolarization during exercise stress tests in patients with BS. The dynamic changes of these electrophysiological markers, which are associated with ventricular electrical conduction
and analysis, decision to publish, or preparation of the manuscript.
Competing interests: NO authors have competing
velocity, were then analyzed to assess differences between symptomatic and asymptomatic BS patients. Clinical characteristics of the population as well as the HRR index were finally inte-grated into a combined multivariate model to improve discriminative performance among these two groups of patients.
Materials and methods
Population
110 consecutive patients (85 males) diagnosed with BS were enrolled in a prospective, multi-centric study, led by the Cardiology department of the Rennes University Hospital (CHU de Rennes) between 2008 and 2013, in France. It was conducted in accordance with applicable good clinical practice requirements in Europe, French law, ICH E6 recommendations, and the ethical principles of the Helsinki Declaration (1996 and 2000). Participants were enrolled in 6 French hospitals located in Rennes, Saint Pierre de la Re´union, Nantes, Bordeaux, Brest and La Rochelle. The study protocol was approved by the respective local ethics committees: Comite´ d’E´thique du CHU de Rennes (ID RCB 2007-A00887-46), Comite´ d’E´thique du CHU Saint-Pierre, Comite´ d’E´thique du CHU de Nantes, Comite´ d’E´thique du CHU de Bordeaux, Comite´ d’E´thique du CHU de Brest and Comite´ d’E´thique du Centre Hospitalier de La Rochelle. All patients provided their written informed consent before participation.
Patients mean age was 44.6±13.7 years. BS was diagnosed when a coved ST-segment eleva-tion (�0.2 mV) was spontaneously observed in �1 right precordial leads located in the 2nd, 3rd or 4thintercostal space, or induced during a sodium channel-blocking administration, accord-ing to the current guidelines [1,2]. Twenty-five patients experienced syncope or aborted SCD related to VF, near syncope and palpitations. These patients were classified as symptomatic. The remaining 85 patients were thus classed as asymptomatic. Structural heart disease was excluded based on physical examination, patient’s history, resting and exercise ECG. Likewise, no significant left ventricular hypertrophy was observed on any patient during echocardio-graphic screening. ICDs had been implanted in 44 (38%) patients including the whole symp-tomatic group, and those asympsymp-tomatic patients who had a positive EPS (Electrophysiological Study) test for arrhythmia inducibility. From the total group, only 79 patients underwent a genetic testing, of whom 29 (7 symptomatic) were positive for the SCN5A mutation. The other patients were not genetically screened because no mutations were identified in their families. In this study, only SCN5A mutations were screened, according to the active guidelines and practice at the time of the protocol definition, in 2008.
Stress Test Protocol: A standard 12-lead ECG acquired at a sampling rate of 1000 Hz was recorded for each patient using a standardized exercise stress test performed on a cycle ergom-eter (Ergoline 900 Egamed, Piestany, Slovakia), defined by the following protocol:
• Exercise period (EX): Comprised of an initial workload of 2 minutes pedaling at 50 W (30 W for women) and followed by successive increments of 30 W (20 W for women) every 2 min-utes, until the patient reached at least 80% of the theoretical maximum HR (HRmax= 220– age).
• Recovery period (RE): It included two successive three-minute periods, one of active recov-ery with the patient pedaling at a workload of 50 W, followed by a passive recovrecov-ery at rest.
Data preprocessing
All ECG signals were preprocessed before the automatic extraction of the analyzed indices. This step included automatic QRS complex detection [14] and subsequent visual inspection to
avoid inclusion of abnormal beats, baseline drift attenuation via cubic spline interpolation, 4-th order bidirectional Butterworth low pass filtering at 45 Hz to remove high frequency (e.g., muscular noise) noise and, wave boundaries delineation using an evolutionary optimization approach [14].
Cardiac depolarization features extraction
Conventional depolarization markers. Conventional ECG markers associated with ven-tricular depolarization were assessed from the ECG signals: the amplitude of the R and S waves (AR,AS) and QRS duration (QRSd). QRSd was calculated by using a multilead-based approach
that determines the earliest QRS onset, and latest QRS end among the available ECG leads [15]. The above approach was applied to all precordial leads, V1-V6, while both theARandAS markers were extracted only from leads V1-V3.
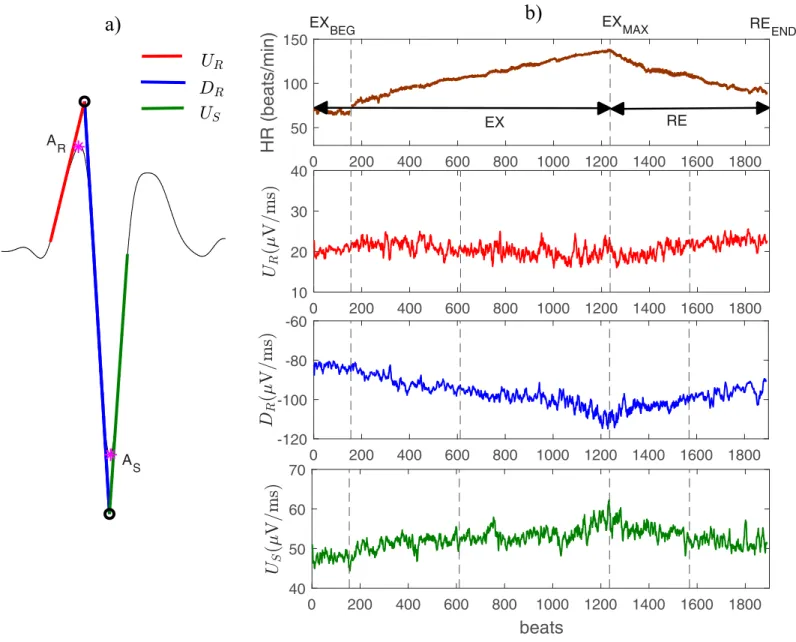
Novel depolarization markers. In addition to the above-mentioned conventional mark-ers, three morphological markers were also extracted from ECG signals (seeFig 1a): the upstroke (red line) and downstroke (blue line) slopes of the R wave (notedUR, andDR, respec-tively) and the terminal upstroke slope (green line) of the S wave (US). These markers are the result of fitting a straight line over the ECG signal in specific segments within the QRS com-plex as described in [16].Fig 1Bshows the evolution of heart rate and three of the proposed depolarization markers, throughout the whole exercise stress test, for a representative patient.
Depolarization dynamics analysis
In order to analyze the dynamics of cardiac depolarization during effort and recovery, mean values of the depolarization markers were first obtained at different phases of the exercise test. These phases were defined as follows (seeFig 1b): 1) the beginning of the exercise test or base-line exercise phase (EXBEG); 2) the time of maximum effort (EXMAX); 3) and the end of the com-plete recovery period, including both the active and passive recovery periods (REEND). The mean values were calculated in 15-s windows duration for each phase. Throughout the manu-script, these values will be referred as �Y, where Y 2 fQRSd;AR;AS;UR;DR;USg. Dynamic
changes, expressed as DY, were subsequently assessed as the difference observed during a tran-sition period defined by two specific phases from those previously described. In general, these changes can be expressed as: DYi;j ¼Yi Yj, in whichi and j represent the involved phases.
Two transition periods were thus analyzed: i) between the EXBEGand EXMAXphases, indicating the change occurred during the effort (denoted DYEX) and, ii) between the EXMAXand REEND phases (denoted DYRE), indicating the change occurred during the whole recovery period.
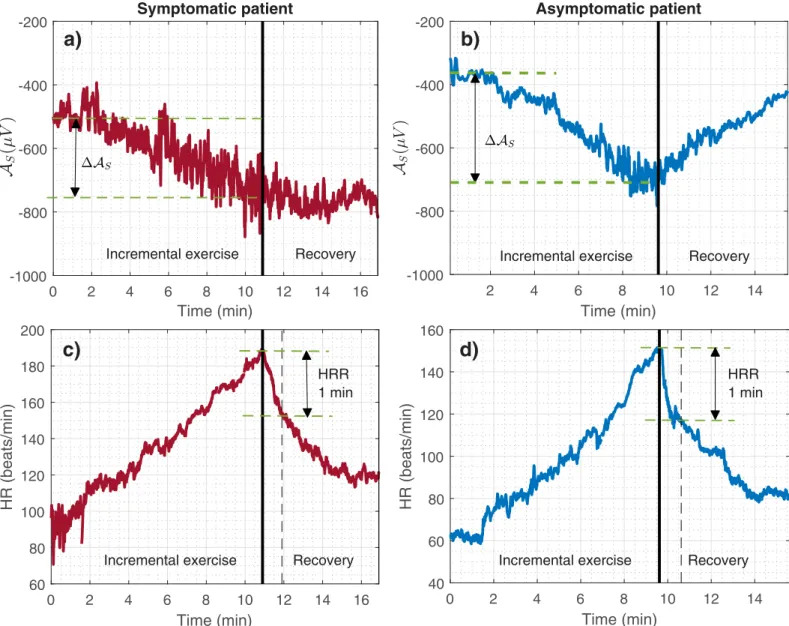
Fig 2shows the evolution ofASand its associated DASEX, for one representative male patient
of the symptomatic (Fig 2a) and asymptomatic (Fig 2b) groups.
Heart rate recovery
The heart rate recovery index (HRR), an autonomic-related measure resulting from a
combi-nation of the vagal activation and sympathetic withdrawal during the recovery period after effort, was also assessed in this study [17].HRR is defined as the heart rate decay occurred
dur-ing the first minute of recovery evaluated immediately after maximal effort, as illustrated in
Fig 2c and 2dfor two representative patients.
Statistical analysis
Results were expressed as mean± SD. Statistical analysis was carried out using the Wilcoxon rank-sum non-parametric test when comparing the inter-group differences. To compare
categorical variables, the Pearson’s chi-square test (X2
test) was used. In all the analyses the level of significance was set to 0.05.
The depolarization markers showing statistically significant differences between groups during the univariate analysis were used as input to a multivariate logistic regression analysis (MLRA). Two MLRA models were created: a first model (Model1) integrating only selected ventricular depolarization markers and a second model (Model2) integrating ventricular depo-larization markers and clinical features.
The LASSO L1-regularization technique was applied in both cases to find the most predic-tive features, while protecting against overfitting [18]. This method makes possible to obtain sparse models and thereby to better interpret the final outcomes. By varying the regularization strengthλ, different subsets of predictive variables can be selected. The larger the λ, the smaller
Fig 1. A) Example of a QRS complex and the three QRS slopes analyzed in this study (red, blue and green lines). B) Temporal evolution of heart rate (upper panel) and
the main extracted ECG markers (panels 2 to 4) evaluated in a representative BS patient during the whole exercise test. The major periods of the exercise test are marked in the upper panel of Fig 1B: exercise period (EX); recovery period (RE). Panel 1 also shows the phases at which the mean values were determined: the beginning of the exercise (EXBEG); the time of maximum effort (EXMAX); the end of the entire recovery period (REEND).
the number of selected variables. However, there is an optimalλ (the best predictive model) which is found with the smallest mean cross-validated error during the learning process. Nev-ertheless, any other model whose error is within one standard error (SE) around the best model would also be a suitable choice. Therefore, a sparse solution (Model1and Model2) meeting the above criterion was selected by splitting the entire population in 10 folds, and per-forming the cross-validation process that generates 10 testing errors, obtained from different, equally split population subsets not seen during learning.
The features selected according to the optimalλ were then used to obtain the final model applied to the whole dataset. In this last step, since standard statistical inference cannot be applied to LASSO coefficients, logistic regression was conducted without regularization, allow-ing for the detection of the most significant characteristics and further reducallow-ing the initial sub-set of predictive characteristics, yielding to even more reduced models denoted as ModelXR,
Fig 2. a) and c) Temporal evolution of the S-wave amplitude (AS) and heart rate (HR) during the exercise test for a male symptomatic patient; b) and d) for a male
asymptomatic patient. The heart rate recovery (HRR) estimate and the change ofASduring exercise (DASEX) are also shown. Thick vertical lines in black indicate the
time of maximum effort (EXMAX).
with X = {1, 2}. Moreover, potential confounding factors such as SNC5A mutation, ICD data and BMI values, were used for correcting the models, which were defined asModelfactorsXR .
Finally, receiver operating characteristics (ROC) curves were generated for all models to assess sensitivity, specificity and the area under the ROC curve (AUC).
Results
Population characteristics
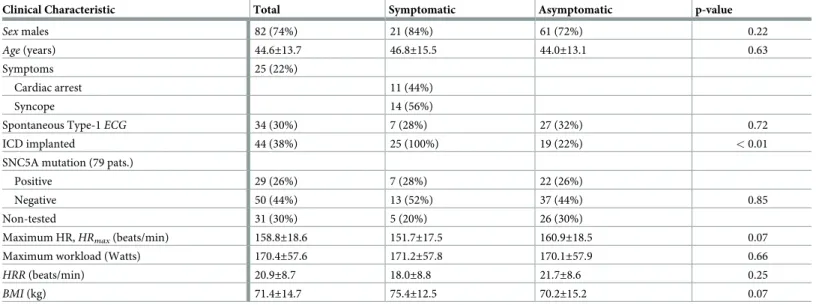
Table 1summarizes the main clinical characteristics of the BS population investigated in this
study. It also includes the inter-group comparison, showing no significant differences among them in all features.
Univariate analysis
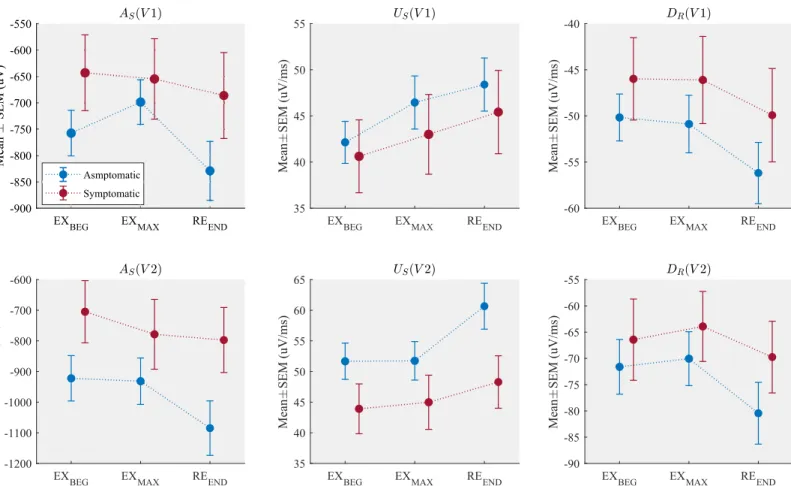
Fig 3shows the mean values ofAS,USandDRcomputed at different stages of the exercise test
for each patient group. Asymptomatic patients presented a larger S wave deflection (lower S wave amplitude values) as well as steeper upstroke and downstroke QRS slopes, when com-pared to the symptomatic group in all phases, even when it was measured at baseline (EXBEG). Moreover, the asymptomatic group showed significant variations from the maximal effort to the end of recovery, while little or negligible changes were observed during incremental exer-cise, particularly in lead V2. A complete table of the observed values of each marker is pre-sented in theS1 Table.
Dynamic changes quantified between the exercise and the recovery periods for all markers are presented inTable 2. Concerning the comparison between symptomatic and asymptomatic patients during incremental exercise, onlyASas observed in lead V1 showed significant differ-ences, being the dynamics of this marker higher for asymptomatic patients. Regarding the com-parison between symptomatic and asymptomatic patients during recovery, changes inAS,US andDRwere significantly different between both populations for leads V1-V3. More precisely, the asymptomatic group presented greater absolute values (greater dynamics) as compared to symptomatic patients. The remaining markers did not show statistically significant changes among groups, despite of the fact that their values were slightly higher in asymptomatic patients.
Table 1. Baseline clinical characteristics of the Brugada syndrome population at the time of diagnosis.
Clinical Characteristic Total Symptomatic Asymptomatic p-value
Sex males 82 (74%) 21 (84%) 61 (72%) 0.22
Age (years) 44.6±13.7 46.8±15.5 44.0±13.1 0.63
Symptoms 25 (22%)
Cardiac arrest 11 (44%)
Syncope 14 (56%)
Spontaneous Type-1ECG 34 (30%) 7 (28%) 27 (32%) 0.72
ICD implanted 44 (38%) 25 (100%) 19 (22%) < 0.01
SNC5A mutation (79 pats.)
Positive 29 (26%) 7 (28%) 22 (26%)
Negative 50 (44%) 13 (52%) 37 (44%) 0.85
Non-tested 31 (30%) 5 (20%) 26 (30%)
Maximum HR,HRmax(beats/min) 158.8±18.6 151.7±17.5 160.9±18.5 0.07
Maximum workload (Watts) 170.4±57.6 171.2±57.8 170.1±57.9 0.66
HRR (beats/min) 20.9±8.7 18.0±8.8 21.7±8.6 0.25
BMI (kg) 71.4±14.7 75.4±12.5 70.2±15.2 0.07
Multivariate analysis using clinical and depolarization features
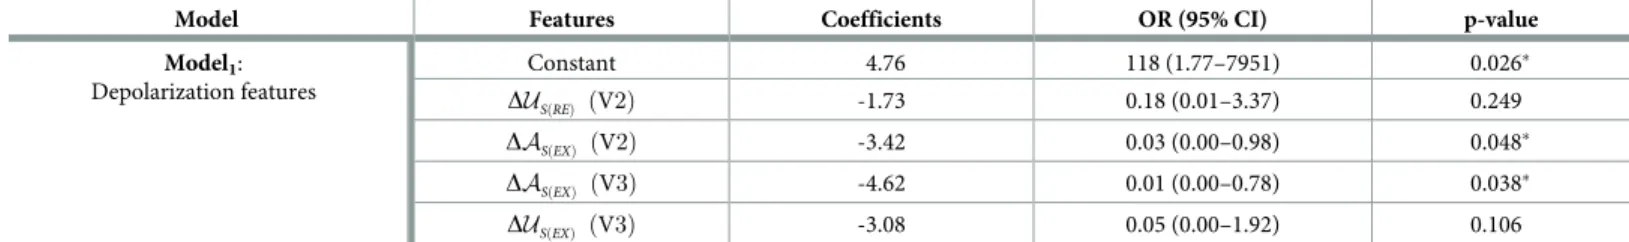
By using the most relevant variables reported inTable 2, Model1was obtained with the predic-tive parameters subset selected with the LASSO approach.Table 3summarizes the main prop-erties of this sparse model which is based solely on depolarization dynamic features.
According to the results, only four features were retained in this model, of whom two were sig-nificant. The negative sign of the coefficients and the odds ratios (OR) values suggest that the significant parameters act as protective factors rather than symptom-based risk factors (OR<1).
To assess the added value of depolarization dynamic features, Model2was obtained follow-ing the same strategy as for Model1. In this case, the clinical characteristics reported inTable 1 were added as input variables in the LASSO-based selection step, excluding genetic screening and ICD data.Table 4presents the summary of this second model after it was trained with the entire population.
As it can be seen fromTable 4, eight features, including three that were included in Model1, were retained for this combined model. The most relevant features were DASðEXÞin lead V2,
Sex and HRR, as reflected by their p-values. Concerning DASðEXÞandHRR, negative coefficients
indicate that for each one-unit increase in these features, the risk of being symptomatic decrease by a 0.01 and a 0.06-fold, respectively. This means that one-unit increase in DASðEXÞ andHRR, increases the odds of not being symptomatic over 100-fold and 16.7-fold,
Fig 3. Mean± SEM of the amplitude of the S wave (AS), the upstroke slope of the S wave (US) and the downstroke slope of the R wave (DR), measured in different
phases of the exercise test in leads V1 and V2.
respectively (1/0.01 = 100 and 1/0.06 = 16.7). Finally, concerning theSex variable, the
OR = 5.67 means that men have 5.67-fold higher risk of being symptomatic patients than women. By using only these three significant features, further reduced models were considered bellow, following the flowchart presented inFig 4.
Because the genetic screening was not performed in all patients, the multivariate analysis was separately applied to the subgroup of patients for which SNC5A mutation information was available (N = 79). Only significant parameters inTable 4were included in the model, denoted as Model2R_79. For this smaller subgroup, all markers remained significant, withSex having an OR of 13.33 (p = 0.036), while for HRR it was <0.01 (p = 0.003) and 0.01 (p = 0.010)
for DASðEXÞ. Indeed,p-values associated with HRR and DASðEXÞwere smaller than those of
Table 4. Afterwards, the model was adjusted for the mutation data as a potential confounding
Table 2. Dynamic changes of depolarization markers between the exercise and recovery periods for symptomatic and asymptomatic patients. Results are expressed
in mean±SD. Statistically significant p-values were highlighted as follows: when comparing both groups during exercise,�(p < 0.05); when comparing both groups during
recovery, † (p < 0.05), ‡(p < 0.01),§ (p < 0.005).
ECG index Symptomatic Asymptomatic Symptomatic Asymptomatic Exercise Exercise Recovery Recovery
DARðmVÞ V1 30±52 83±357 -10±66 -63±354 V2 -57±142 -57±132 29±94 47±113 V3 -27±78 -104±198 34±136 92±174 DASðmVÞ V1 -12±120 59±258� -31±158 -130±295§ V2 -73±172 -9±179 -19±206 -153±227‡ V3 -259±196 -239±229 50±202 9±227 DUSðmV=msÞ V1 2±9 4±14 2±9 2±13 V2 1±9 0±8 3±10 9±11§ V3 8±9 7±9 -1±8 3±10† DDRðmV=msÞ V1 0±6 -1±15 -4±10 -5±13 V2 3±15 2±12 -6±13 -10±14 V3 -16±16 -10±16 3±19 -3±18† DURðmV=msÞ V1 3±5 6±23 -2±5 -4±21 V2 -1±7 0±8 0±6 1±6 V3 5±7 2±10 -2±8 0±10 ΔQRSd (ms) 2±17 6±21 0±15 -6±19 https://doi.org/10.1371/journal.pone.0229078.t002
Table 3. Model1: Logistic regression model using depolarization features selected by LassoL1-regularization.
Model Features Coefficients OR (95% CI) p-value Model1: Depolarization features Constant 4.76 118 (1.77–7951) 0.026� DUSðREÞ ðV2Þ -1.73 0.18 (0.01–3.37) 0.249 DASðEXÞ ðV2Þ -3.42 0.03 (0.00–0.98) 0.048� DASðEXÞ ðV3Þ -4.62 0.01 (0.00–0.78) 0.038� DUSðEXÞ ðV3Þ -3.08 0.05 (0.00–1.92) 0.106 https://doi.org/10.1371/journal.pone.0229078.t003
factor, and results were not significantly affected as it is shown inTable 5(seeModelSCN5A 2R 79),
except forSex, whose OR increased from 13.3 to 20.6 (>50%). This suggests that association
between male gender and symptoms is enhanced by the presence of the SCN5A mutation. Since mutation data had no significant impact on two features of the reduced model, and the association ofSex with symptoms was strengthened rather than penalized, other possible
confounding factors such asBMI and ICD data were investigated to adjust the same model,
but now using the whole initial population (N = 110), including thus patients for which no
genetic screening was performed. Unlike the unadjusted model, Model2R_110, only DASðEXÞ
remained significant among the three involved features (seeModelBMI;ICD2R 110 inTable 5). For
instance, DASðEXÞhad an OR of 0.006 (p = 0.002) and its protective role was reinforced for the
adjusted model (OR = 0.002,p = 0.016). Conversely, BMI and ICD data confound the role of Sex (OR = 4.45, p = 0.033) as a potential risk factor as well as the protective role of HRR
(OR = 0.05,p = 0.016) in terms of symptoms association, which were no longer meaningful
after adjustment. Statistics about these two models are summarized inTable 5.
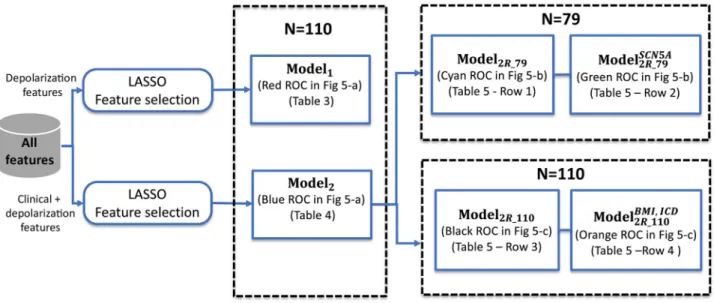
Fig 4. Flowchart diagram of the processing pipeline used to obtain the different models investigated in the study.
https://doi.org/10.1371/journal.pone.0229078.g004
Table 4. Model2: Logistic regression model using clinical and depolarization features selected by Lasso.
Model Features Coefficients OR (95% CI) p-value
Model2: Depolarization features + Clinical features Constant 4.76 371 (3.97–34739) 0.010� Sex 1.73 5.67 (1.31–24.5) 0.020� Type-1ECG -0.39 0.67 (0.20–2.22) 0.514 DUSðREÞ ðV2Þ -1.91 0.15 (0.01–3.39) 0.232 DASðEXÞ ðV2Þ -4.83 0.01 (0.00–0.39) 0.015� DASðEXÞ ðV3Þ -1.94 0.14 (0.01–3.68) 0.241 HRMAX -3.32 0.04 (0.00–1.09) 0.056 HRR -2.89 0.06 (0.00–0.93) 0.044� Age -1.99 0.14 (0.01–3.34) 0.222 �p<0.05 https://doi.org/10.1371/journal.pone.0229078.t004
Fig 5ashows the comparison between the two optimal models (obtained from LASSO) in terms of discrimination performance. ROC curves and their associated AUC values are dis-played. Sensitivity and specificity were determined from the points on the ROC closest to the upper-left corner. Results show that the model combining clinical and depolarization features
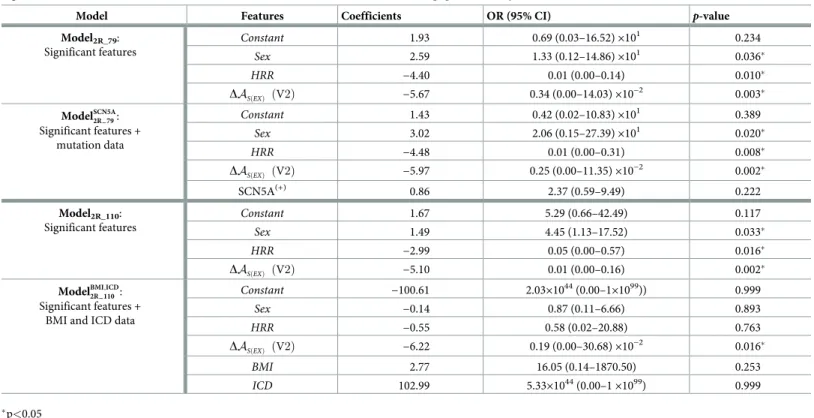
Table 5. Reduced models using only significant features fromTable 4, before and after adjusting by confounding factors. Only patients that underwent genetic
screen-ing were included (N = 79) in the first two models. The last two models included the whole population study (N = 110).
Model Features Coefficients OR (95% CI) p-value
Model2R_79: Significant features Constant 1.93 0.69 (0.03–16.52)×101 0.234 Sex 2.59 1.33 (0.12–14.86)×101 0.036� HRR −4.40 0.01 (0.00–0.14) 0.010� DASðEXÞ ðV2Þ −5.67 0.34 (0.00–14.03)×10 −2 0.003� ModelSCN5A2R 79: Significant features + mutation data Constant 1.43 0.42 (0.02–10.83)×101 0.389 Sex 3.02 2.06 (0.15–27.39)×101 0.020� HRR −4.48 0.01 (0.00–0.31) 0.008� DASðEXÞ ðV2Þ −5.97 0.25 (0.00–11.35)×10 −2 0.002� SCN5A(+) 0.86 2.37 (0.59–9.49) 0.222 Model2R_110: Significant features Constant 1.67 5.29 (0.66–42.49) 0.117 Sex 1.49 4.45 (1.13–17.52) 0.033� HRR −2.99 0.05 (0.00–0.57) 0.016� DASðEXÞ ðV2Þ −5.10 0.01 (0.00–0.16) 0.002� ModelBMI;ICD 2R 110: Significant features + BMI and ICD data
Constant −100.61 2.03×1044(0.00–1×1099)) 0.999 Sex −0.14 0.87 (0.11–6.66) 0.893 HRR −0.55 0.58 (0.02–20.88) 0.763 DASðEXÞ ðV2Þ −6.22 0.19 (0.00–30.68)×10 −2 0.016� BMI 2.77 16.05 (0.14–1870.50) 0.253 ICD 102.99 5.33×1044(0.00–1 ×1099) 0.999 �p<0.05 https://doi.org/10.1371/journal.pone.0229078.t005
Fig 5. a) Receiver operating characteristic (ROC) curves obtained for the two discriminative models summarized inTable 3(Model1) andTable 4(Model2), (b) for the
reduced models adjusted (ModelSCN5A
2R 79) and non adjusted (Model2R_79) by mutation data, applied on the screened 79 patients, and c) for the reduced model using
significant features fromTable 3, adjusted (ModelBMI;ICD
2R 110) and non adjusted (Model2R_110) by BMI and ICD data. Solid circles in black represent the optimal operating
points determining the sensitivity and specificity values from each ROC. AUC: area under the ROC curve (coloured areas); Se: sensitivity; Sp: specificity.
(Model2—Table 4) provided slightly better results than the model based solely on depolariza-tion parameters (Model1—Table 3). Note that Model1may still be suitable for discriminating between BS patient groups, using half the number of parameters with respect to Model2. Per-formance metrics remained similar when non significant features inTable 4were removed from Model2, in order to create the even more reduced model (Model2R_110). However, this reduced model with only 3 features, tested on the population subset that underwent genetic screening (N = 79), presented similar overall performances before (Model2R_79) and after (ModelSCN5A
2R 79) adjusting for the presence/absence of the mutation, as shown inFig 5b. Finally,
when Model2R_110was adjusted by BMI and ICD data (ModelBMI;ICD2R 110 ), these performance met-rics were significantly improved (seeFig 5c), withAUC = 94%, Sp = 84% and Se = 100%).
Discussion
Stratifying the level of risk in asymptomatic Brugada patients is still a major clinical challenge. Better discriminative markers are needed to improve prognosis and to optimize the therapy for a given patient. Apart from classical high-risk markers reported in previous BS-related studies, such as spontaneous type-I ECG pattern and VF history, the analysis of ventricular depolarization in this population may provide an interesting source of information, especially if combined with ANS-related parameters. In fact, it has been previously shown that the appli-cation of multivariate methods that combine clinical and electrophysiological analysis provide more robust estimations for risk stratification in BS [19,20].
Regarding depolarization analysis, many previous studies have reported noninvasive risk markers for arrhythmic events in patients with BS, related to the QRS complex. For instance, a longer QRS duration in symptomatic patients have been observed in lead V2 [21]. In fact, pro-longed QRS duration has been associated with increased risk of cardiac events [21,22], and values >120 ms were shown to predict ventricular arrhythmia and/or syncope [23]. Likewise, late potentials on signal-averaged ECG seem to be more common in symptomatic patients [24], but with limited prognostic value if considered alone. QRS fragmentation, expressed as multiple spikes within the QRS complex in leads V1-V3, was confirmed in the PRELUDE study as an independent predictor of arrhythmias [25]. The presence of the aVR sign (R-wave amplitude � 0.3 mV or R/q � 0.75 in lead aVR, may reflect more right ventricular conduction delay and consequently increased risk for development of arrhythmic events [26]. Finally, wider and/or large S-wave upstroke (� 0.1 mV and � 40 ms, respectively) in lead I, associated with delayed activation in the RVOT, was reported as a powerful predictor of ventricular arrhythmias [27].
In our study, we have investigated the potential usefulness of more robust and refined markers of ventricular depolarization, mainly related to conduction velocity and associated with the R and S waves shape. Unlike some previous studies [21,28], we did not find any statis-tical difference in QRS duration between symptomatic and asymptomatic groups. However, significant differences were found for indicesAS,DRandUSin the right precordial leads V1-V3 and mostly during recovery. These indices presented smaller values in symptomatic patients, and these findings may be associated with those reported in [27] about delayed depo-larization in the RVOT. Likewise, results obtained fromAS,US(second half of the QRS com-plex) may be correlated with those obtained from the analysis of late potentials [5]. The role of slow conduction as key indicator of SCD in BS has been supported by the observation of elec-troanatomic maps of the RV, where patients with recurrent VF episodes showed a prominent delayed depolarization accompanied with low voltage and fractionated electrograms over the anterior epicardial region of the RVOT [6,29]. Indeed, when radio-frequency ablation of epicardial sites displaying late potentials in the RVOT is applied, the arrhythmic risk and ECG
characteristics of BS disappear or are significantly reduced [30]. This fact supports the hypoth-esis that the elimination of the sites presenting slow conduction may be the basis for the ame-liorative effect of ablation therapy. Nevertheless, there is a competing hypothesis regarding the underlying mechanisms of late potentials and fragmented electrograms, based on results from a coronary-perfused canine RV wedge model of BS [31]. In that model, fractionated electrical activity was observed in RV epicardium as a consequence of heterogeneities in the appearance of the second upstroke of the epicardial AP, while discrete high-frequency spikes were a result of concealed phase-2-reentry.
The analysis of the dynamics of ventricular depolarization markers along the main phases of a stress test is another contribution of this work. In general, the major differences found between the two patient groups were associated with significantly larger modifications of depolarization markers through time (depolarization dynamics), observed in asymptomatic patients with respect to the symptomatic group. This large dynamicity in the asymptomatic group was even more pronounced during recovery, especially for markersASandUS, which might be related to the results reported by Makimotoet al. [9]. In that study, augmented ST-elevation and peak J-point amplitude during early recovery (1-4 minutes) after exercise cessa-tion, were associated with poor prognosis in patients with syncope alone or asymptomatic sub-jects. Specifically, changes occurring in the peak J-point amplitude, considered as a
depolarization parameter or at least combined parameter of both depolarization and repolari-zation, can directly affect the S-wave upstrokeUSevaluated in this study. Therefore, these find-ings postulate the exercise testing as a useful tool to unveil distinct electrophysiological responses in BS patients, trough the vagally-mediated accentuation of ECG patterns (i.e., J waves and ST elevation) that may contribute to arrhythmia initiation owing to decreasingICa [32]. The above is supported by the higher incidences of cardiac events at rest or during sleep in BS patients, when the vagal tone is normally increased as it happens during recovery effort.
In addition to the relevant parameters found when exploiting only the ventricular depolari-zation markers, the clinical characteristics of the population were also included in a multivari-ate logistic regression analysis. While none of the clinical parameters were significantly different between groups (seeTable 1), their combination with depolarization dynamic mark-ers yielded an optimal model of only eight features. This combined model (Model2) was able to discriminate among groups reaching a suitable performance outcome (AUC = 83%, Se = 80%, Se = 75%). Nevertheless, when only depolarization features were used, the perfor-mance of the model (Model1) was slightly smaller, despite the fact that only four features were included (AUC = 75%, Se = 76%, Se = 67%). This highlighted the significant contribution of dynamic depolarization properties in terms of discrimination between symptomatic and asymptomatic patients. Further multivariate analyses performed on the smaller subgroup screened for SCN5A mutations, and using only significant features from Model2, showed simi-lar results even after correcting by mutation data. Indeed, this characteristic did not have a strong impact on the overall performance of the model since all the involved features remained significant after adjustment. Only the sex’s association with the presence of symptoms was, in fact, positively impacted (see Model2R_79andModelSCN5A2R 79 inTable 5). Lastly, the above reduced model was tested on the whole population excluding mutation data, but considering other possible confounding factors. Interestingly, after correcting for the BMI and ICD data (ModelBMI;ICD2R 110 ), the model performance increased significantly, reaching metrics of:
AUC = 94%, Se = 84% and Sp = 100%. In that model, only one of the three relevant features
has remained significant, and it was related to the exercise-related dynamic ofASin lead V2, whose association with the absence of symptoms was strengthened through reinforcement of its protective role. The main outcome of the multivariate analyses was that most significant
parameters were, in fact, protective factors rather than risk factors. Therefore, they could serve as potential indicators of low-risk, especially in asymptomatic patients. The only marker that apparently was thought to be a major risk factor was the patient’s sex (see Model2R_110). How-ever, its association with the symptoms was dampened after controlling the model for potential confounding factors.
It is well-known that early recovery of the heart rate, occurring immediately after cessation of exercise, is due to parasympathetic reactivation. Such reactivation is somehow captured by the HRR marker, that turned to be a protective factor in our combined model before adjust-ment. To some extent, this finding may be linked to the results reported in [11], where a dis-tinct parasympathetic activity was found among BS patients’ groups during incremental exercise and early recovery. Nevertheless, its role as a protective factor was largely affected when controlling for BMI and ICD data.
Finally, as suggested by Postema et al. [6], repolarization abnormalities in Brugada syndrome are mostly induced by depolarization abnormalities. The latter were thought to be a result of the heterogeneity in the action potential duration with a ventricular endo-epi gradient [33]. However, in Meijborg et al. [34], repolarization abnormalities were thought to be related to an increased interventricular and LV-intraventricular dispersion in repolarization time, after dofe-tilide infusion in an experimental model of dofedofe-tilide-induced long QT syndrome type 2 (LQT2). Tokioka et al. [35] reported that combination of both repolarization and depolarization abnormalities enables potential identification of high- and low-risk Brugada patients. Hence, further studies involving both repolarization and depolarization analyses should be conducted to improve the discriminative capability of potential markers derived from the ECG.
Conclusions
Symptomatic and asymptomatic patients with Brugada syndrome studied in this work have shown significantly different ventricular depolarization dynamics during exercise and mostly during recovery. Such differences are mainly observed through the proposed novel depolariza-tion indices, associated with the second half and/or terminal part of the QRS complex. These findings may be useful to improve risk stratification for malignant arrhythmic events, specially in individual asymptomatic patients. Since the obtained results came from a retrospective data, further work is warranted to evaluate the proposed indices in a prospective study, with a larger patient population, and to assess the added value of a combined analysis of cardiac depolariza-tion and repolarizadepolariza-tion parameters, together with different clinical factors and genetic status.
Supporting information
S1 Table. Mean values of the ECG markers evaluated in this study. (PDF)
S2 Table. Raw values of the different markers extracted from ECG signals. (XLSX)
Acknowledgments
The authors thank David Matelot for his valuable technical assistance.
Author Contributions
Conceptualization: Daniel Romero, Alfredo I. Herna´ndez. Data curation: Daniel Romero.
Formal analysis: Daniel Romero.
Funding acquisition: Daniel Romero, Philippe Mabo, Alfredo I. Herna´ndez.
Investigation: Daniel Romero, Nathalie Behar, Bertrand Petit, Vincent Probst, Frederic Sacher, Philippe Mabo, Alfredo I. Herna´ndez.
Methodology: Daniel Romero, Alfredo I. Herna´ndez. Project administration: Philippe Mabo.
Resources: Nathalie Behar, Bertrand Petit, Vincent Probst, Frederic Sacher, Philippe Mabo, Alfredo I. Herna´ndez.
Software: Daniel Romero.
Supervision: Philippe Mabo, Alfredo I. Herna´ndez.
Validation: Daniel Romero, Nathalie Behar, Alfredo I. Herna´ndez. Visualization: Daniel Romero.
Writing – original draft: Daniel Romero.
Writing – review & editing: Daniel Romero, Nathalie Behar, Philippe Mabo, Alfredo I. Herna´ndez.
References
1. Priori SG, Blomstroe¨ m-Lundqvist C, Mazzanti A, Blom N, Borggrefe M, Camm J, et al. 2015 ESC Guidelines for the management of patients with ventricular arrhythmias and the prevention of sudden cardiac death. The Task Force for the Management of Patients with Ventricular Arrhythmias and the Prevention of Sudden Cardiac Death of the European Society of Cardiology (ESC) Endorsed by: Asso-ciation for European Paediatric and Congenital Cardiology (AEPC). Europace 2015; 17(11):1601– 1687.https://doi.org/10.1093/europace/euv319PMID:26318695
2. Priori SG, Wilde AA, Horie M, Cho Y, Behr ER, Berul C, et al. Executive summary: HRS/EHRA/APHRS expert consensus statement on the diagnosis and management of patients with inherited primary arrhythmia syndromes. Europace 2013; 15(10):1389–1406.https://doi.org/10.1093/europace/eut272 PMID:23994779
3. Probst V, Veltmann C, Eckardt L, Meregalli PG, Gaita F, Tan HL, et al. Long-term prognosis of patients diagnosed with Brugada syndrome results from the FINGER Brugada syndrome registry. Circulation 2010; 121(5):635–643.https://doi.org/10.1161/CIRCULATIONAHA.109.887026PMID:20100972
4. Herna´ndez J, Arbelo E, Borras R, Berne P, Tolosana JM, Gomez A, et al. Patients with Brugada syn-drome and implanted cardioverter-defibrillators: long-term follow-up. J Am Coll Cardiol, 2017; 70(16): 1991–2002.https://doi.org/10.1016/j.jacc.2017.08.029
5. Morita H, Kusano KF, Miura D. Nagase S, Nakamura K, Morita ST, et al. Fragmented QRS as a marker of conduction abnormality and a predictor of prognosis of Brugada syndrome. Circulation 2008; 118 (17):1697–1704https://doi.org/10.1161/CIRCULATIONAHA.108.770917PMID:18838563
6. Postema PG, van Dessel PF, Kors JA, Linnenbank AC, van Herpen G, van Eck HJR, et al. Local depo-larization abnormalities are the dominant pathophysiologic mechanism for Type-I electrocardiogram in Brugada syndrome: a study of electrocardiograms, vectorcardiograms, and body surface potential maps during ajmaline provocation. J Am Coll Cardiol 2010; 55(8):789–797https://doi.org/10.1016/j. jacc.2009.11.033PMID:20170818
7. Morita H, Kusano KF, Nagase S, Miyaji K, Hiramatsu S, Banba K et al. Sinus node function in patients with Brugada-type ECG. Circ J 2004; 68:473–476.https://doi.org/10.1253/circj.68.473PMID: 15118291
8. Amin AS, de Groot EA, Ruijter JM, Wilde AA, Tan HL. Exercise- induced ECG changes in Brugada syn-drome. Circ Arrhythm Electrophysiol 2009; 2:531–539.https://doi.org/10.1161/CIRCEP.109.862441 PMID:19843921
9. Makimoto H, Nakagawa E, Takaki H, Yamada Y, Okamura H, Noda T, et al. Augmented ST- segment elevation during recovery from exercise predicts cardiac events in patients with Brugada syndrome. J Am Coll Cardiol 2010; 56:1576–1584https://doi.org/10.1016/j.jacc.2010.06.033PMID:21029874
10. Behar N, Petit B, Probst V, Sacher F, Kervio G, Mansourati J, et al. Heart rate variability and repolariza-tion characteristics in symptomatic and asymptomatic Brugada syndrome. Europace 2016.https://doi. org/10.1093/europace/euw224
11. Calvo M, Romero D, Le Rolle V, Be´har N, Gomis P, Mabo P, et al. Multivariate classification of Brugada syndrome patients based on autonomic response to exercise testing. PloS One 2018; 13:e0197367. https://doi.org/10.1371/journal.pone.0197367PMID:29763454
12. Kawazoe H, Nakano Y, Ochi H, Takagi M, Hayashi Y, Uchimura Y, et al. Risk stratification of ventricular fibrillation in Brugada syndrome using noninvasive scoring methods. Heart Rhythm 2016; 13:1947– 1954.https://doi.org/10.1016/j.hrthm.2016.07.009PMID:27424075
13. Postema PG, Wilde AA. Risk stratification in Brugada syndrome: Where is the finish line?. Heart rhythm 2016; 13:1955–1956.https://doi.org/10.1016/j.hrthm.2016.08.008PMID:27498077
14. Dumont J, Herna´ndez A, Carrault G. Improving ECG beats delineation with an evolutionary optimization process. IEEE Trans Biomed Eng 2010; 57: 607–615.https://doi.org/10.1109/TBME.2008.2002157
15. Laguna P, Jane´ R, Caminal P. Automatic detection of wave boundaries in multilead ECG signals: vali-dation with the CSE database. Comput Biomed Res 1994; 27:45–60.https://doi.org/10.1006/cbmr. 1994.1006PMID:8004942
16. Romero D, Ringborn M, Laguna P, Pahlm O, Pueyo E. Depolarization changes during acute myocardial ischemia by evaluation of QRS slopes: standard lead and vectorial approach. IEEE Trans Biomed Eng 2011; 58:110–120.https://doi.org/10.1109/TBME.2010.2076385PMID:20840890
17. Cole CR, Blackstone H, Pashkow FJ, Snader CE, Lauer MS. Heart-rate recovery immediately after exercise as a predictor of mortality. New England Journal of Medicine 1999, 341(18), 1351–1357 https://doi.org/10.1056/NEJM199910283411804PMID:10536127
18. Tibshirani R. Regression shrinkage and selection via the lasso. Journal of the Royal Statistical Society. Series B (Methodological) 1996, 267–288.https://doi.org/10.1111/j.2517-6161.1996.tb02080.x
19. Delise P, Allocca G, Marras E, Giustetto C, Gaita F, Sciarra L, et al. Risk stratification in individuals with the Brugada type 1 ECG pattern without previous cardiac arrest: usefulness of a combined clinical and electrophysiologic approach. Eur Heart J 2010; 32:169–176.https://doi.org/10.1093/eurheartj/ehq381 PMID:20978016
20. Delise P, Allocca G, Sitta N, Di Stefano P. Event rates and risk factors in patients with Brugada syn-drome and no prior cardiac arrest: a cumulative analysis of the largest available studies distinguishing ICD-recorded fast ventricular arrhythmias and sudden death. Heart Rhythm 2014; 11:252–258https:// doi.org/10.1016/j.hrthm.2013.10.039PMID:24513918
21. Junttila MJ, Brugada P, Hong K, Lizzote E, DE Zutter M, Sarkozy A, et al. Differences in 12-Lead Elec-trocardiogram Between Symptomatic and Asymptomatic Brugada Syndrome Patients. J Cardiovasc Electrophysiol 2008; 19: 380–383.https://doi.org/10.1111/j.1540-8167.2007.01050.xPMID:18081770
22. Letsas KP, Weber R, Efremidis M, Korantzopoulos P, Astheimer K, Charalampous C, et al. Long-term prognosis of asymptomatic individuals with spontaneous or drug-induced type 1 electrocardiographic phenotype of Brugada syndrome. J Electrocardiol 2011; 44: 346–349.https://doi.org/10.1016/j. jelectrocard.2010.12.007PMID:21419423
23. Ohkubo K, Watanabe I, Okumura Y, Ashino S, Kofune M, Nagashima K, et al. Prolonged QRS duration in lead V2 and risk of life-threatening ventricular Arrhythmia in patients with Brugada syndrome. Int Heart J 2011; 52: 98–102.https://doi.org/10.1536/ihj.52.98PMID:21483168
24. Ikeda T, Takami M, Sugi K, Mizusawa Y, Sakurada H, Yoshino H. Noninvasive risk stratification of sub-jects with a Brugada type electrocardiogram and no history of cardiac arrest. Annals Noninvasive Elec-trocardiol 2005; 10: 396–403.https://doi.org/10.1111/j.1542-474X.2005.00055.x
25. Priori SG, Gasparini M, Napolitano C, Della Bella P, Ottonelli AG, Sassone B, et al. Risk stratification in Brugada syndrome: results of the PRELUDE (PRogrammed ELectrical stimUlation preDictive valuE) registry. J Am Coll Cardiol 2012; 59: 37–45.https://doi.org/10.1016/j.jacc.2011.08.064PMID: 22192666
26. Bigi MAB, Aslani A, Shahrzad S. aVR sign as a risk factor for life-threatening arrhythmic events in patients with Brugada syndrome. Heart Rhythm 2007; 4: 1009–1012.https://doi.org/10.1016/j.hrthm. 2007.04.017
27. CalòL, Giustetto C, Martino A, Sciarra L, Cerrato N, Marziali M, et al. A new electrocardiographic marker of sudden death in Brugada syndrome: the S-wave in lead I. J Am Coll Cardiol 2016; 67: 1427– 1440.https://doi.org/10.1016/j.jacc.2016.01.024PMID:27012403
28. Takagi M, Yokoyama Y, Aonuma K, Aihara N, Hiraoka M. Clinical characteristics and risk stratification in symptomatic and asymptomatic patients with Brugada syndrome: multicenter study in Japan. J Cardi-ovasc Electrophysiol 2007; 18: 1244–1251.https://doi.org/10.1111/j.1540-8167.2007.00971.xPMID: 17900255
29. Lambiase PD, Ahmed AK, Ciaccio EJ, Brugada R, Lizotte E, Chaubey S, et al. High-density substrate mapping in Brugada syndrome: combined role of conduction and repolarization heterogeneities in arrhythmogenesis. Circulation. 2009; 120:106–17.https://doi.org/10.1161/CIRCULATIONAHA.108. 771401PMID:19564561
30. Nademanee K, Veerakul G, Chandanamattha P, Chaothawee L, Ariyachaipanich A, Jirasirirojanakorn K, et al. Prevention of ventricular fibrillation episodes in Brugada syndrome by catheter ablation over the anterior right ventricular outflow tract epicardium. Circulation 2011; 123: 1270–1279.https://doi.org/10. 1161/CIRCULATIONAHA.110.972612PMID:21403098
31. Sze´l T, Antzelevitch C. Abnormal repolarization as the basis for late potentials and fractionated electro-grams recorded from epicardium in experimental models of Brugada syndrome. J Am Coll Cardiol 2014; 63:2037–2045.https://doi.org/10.1016/j.jacc.2014.01.067PMID:24657694
32. Yan GX & Antzelevitch C. Cellular basis for the Brugada syndrome and other mechanisms of arrhyth-mogenesis associated with ST-segment elevation. Circulation 1999; 100: 1660–1666.https://doi.org/ 10.1161/01.cir.100.15.1660PMID:10517739
33. Gussak I, Antzelevitch C, Bjerregaard P, Towbin J, Chaitman B. The Brugada syndrome: clinical, electrophysiologic and genetic aspects. J Am Coll Cardiol 1999; 33: 5–15.https://doi.org/10.1016/ s0735-1097(98)00528-2PMID:9935001
34. Meijborg VM, Chauveau S, Janse MJ, Anyukhovsky EP, Danilo PR, Rosen MR, et al. Interventricular dispersion in repolarization causes bifid T waves in dogs with dofetilide-induced long QT syndrome. Heart Rhythm 2015; 12:1343–1351.https://doi.org/10.1016/j.hrthm.2015.02.026PMID:25724833
35. Tokioka K, Kusano KF, Morita H, Miura D, Nishii N, Nagase S, et al. Electrocardiographic parameters and fatal arrhythmic events in patients with Brugada syndrome: combination of depolarization and repo-larization abnormalities. J Am Coll Cardiol 2014; 63: 2131–2138.https://doi.org/10.1016/j.jacc.2014. 01.072PMID:24703917