HAL Id: hal-02641435
https://hal.inrae.fr/hal-02641435
Submitted on 28 May 2020
HAL is a multi-disciplinary open access
archive for the deposit and dissemination of
sci-entific research documents, whether they are
pub-lished or not. The documents may come from
teaching and research institutions in France or
abroad, or from public or private research centers.
L’archive ouverte pluridisciplinaire HAL, est
destinée au dépôt et à la diffusion de documents
scientifiques de niveau recherche, publiés ou non,
émanant des établissements d’enseignement et de
recherche français ou étrangers, des laboratoires
publics ou privés.
Mélanie Thomas, Lise Pingault, Axel Poulet, Jorge Duarte, Mickaël Throude,
Sébastien Faure, Jean-Philippe Pichon, Etienne Paux, Aline Valeska Probst,
Christophe Tatout
To cite this version:
Mélanie Thomas, Lise Pingault, Axel Poulet, Jorge Duarte, Mickaël Throude, et al.. Evolutionary
history of Methyltransferase 1 genes in hexaploid wheat. BMC Genomics, BioMed Central, 2014, 15,
�10.1186/1471-2164-15-922�. �hal-02641435�
R E S E A R C H A R T I C L E
Open Access
Evolutionary history of Methyltransferase 1 genes
in hexaploid wheat
Mélanie Thomas
1,2, Lise Pingault
3, Axel Poulet
1, Jorge Duarte
2, Mickaël Throude
2, Sébastien Faure
2,
Jean-Philippe Pichon
2, Etienne Paux
3, Aline Valeska Probst
1and Christophe Tatout
1*Abstract
Background: Plant and animal methyltransferases are key enzymes involved in DNA methylation at cytosine residues, required for gene expression control and genome stability. Taking advantage of the new sequence surveys of the wheat genome recently released by the International Wheat Genome Sequencing Consortium, we identified and characterized MET1 genes in the hexaploid wheat Triticum aestivum (TaMET1).
Results: Nine TaMET1 genes were identified and mapped on homoeologous chromosome groups 2A/2B/2D, 5A/5B/5D and 7A/7B/7D. Synteny analysis and evolution rates suggest that the genome organization of TaMET1 genes results from a whole genome duplication shared within the grass family, and a second gene duplication, which occurred specifically in the Triticeae tribe prior to the speciation of diploid wheat. Higher expression levels were observed for TaMET1 homoeologous group 2 genes compared to group 5 and 7, indicating that group 2 homoeologous genes are predominant at the transcriptional level, while group 5 evolved into pseudogenes. We show the connection between low expression levels, elevated evolution rates and unexpected enrichment in CG-dinucleotides (CG-rich isochores) at putative promoter regions of homoeologous group 5 and 7, but not of group 2 TaMET1 genes. Bisulfite sequencing reveals that these CG-rich isochores are highly methylated in a CG context, which is the expected target of TaMET1.
Conclusions: We retraced the evolutionary history of MET1 genes in wheat, explaining the predominance of group 2 homoeologous genes and suggest CG-DNA methylation as one of the mechanisms involved in wheat genome dynamics.
Keywords: DNA methylation, Evolution, Genome dynamics, CG-rich isochores Background
Triticum aestivum (hexaploid wheat or bread wheat) is one of the most important cultivated species in the world and it has been subject of intense research. Investigations of its genome structure led to the discovery of its highly dynamic nature during evolution. Using fossil records and phylogenetic studies, its evolution was traced from ancestral diploid species proposed to originate 50–77 million years ago (MYa) [1]. Indeed, bread wheat is a hexaploid species made of three homoeologous ge-nomes called A, B and D which derived from different diploid species. These are proposed to be Triticum
urartu (2n = 2× = 14 chromosomes, AA) and a diploid species related to Aegilops speltoides (2n = 2× = 14, BB) which gave rise some 0.5 ~ 0.6 MYa ago to Triticum durum (2n = 4× = 28 chromosomes, AABB). About 8,000 years ago, hybridization occurred between Triticum durumand Aegilops tauschii (2n = 2× = 14 chomosomes, DD) and yielded Triticum aestivum (2n = 6× = 42 chro-mosomes, AABBDD), the hexaploid wheat [2]. This means that every single gene is expected to be found in triplicate. The genome structure, organized in homoeolo-gous genomes A, B and D, has to be maintained through cell division, a function which is ensured by the Ph1 suppressor locus. The Ph1 locus restricts homoeolo-gous recombination and permits proper chromosome segregation in a hexaploid context through mitosis and meiosis [3].
* Correspondence:christophe.tatout@univ-bpclermont.fr 1UMR CNRS 6293 INSERM U 1103 Clermont Université, Genetics Reproduction and Development (GReD), 24 avenue des Landais, BP80026, 63171 Aubière Cedex, France
Full list of author information is available at the end of the article
© 2014 Thomas et al.; licensee BioMed Central Ltd. This is an Open Access article distributed under the terms of the Creative Commons Attribution License (http://creativecommons.org/licenses/by/4.0), which permits unrestricted use, distribution, and reproduction in any medium, provided the original work is properly credited. The Creative Commons Public Domain Dedication waiver (http://creativecommons.org/publicdomain/zero/1.0/) applies to the data made available in this article, unless otherwise stated.
Complementary approaches known as comparative genomics [4] at the genome-level (synteny) or the chromosome level (micro-synteny) were used to predict the genome structure of wheat in comparison to se-quenced diploid species such as rice [5,6], sorghum [7], maize [8], brachypodium [9] and more recently barley [10]. Recent syntenic studies proposed that the ancestral genome of grass species was a diploid species organized in five chromosomes (2n = 2× = 10 chromosomes) [11]. From this initial chromosome organization, the ancestral diploid genome was duplicated through Whole-Genome Duplication (WGD) then fragmented giving rise to an intermediate ancestor with 2n = 2× = 24 chromosomes [11]. This genomic structure has been well conserved in rice (2n = 2× = 24 chromosomes) while it evolved to 2n = 2× = 14 through chromosome rearrangements in diploid wheat. Although WGD is expected to have had a large impact on wheat genome evolution it is not the only mode of genome rearrangement. Indeed, duplication of large chromosomal regions (segmental duplication), du-plication at the gene level or tandem dudu-plications have also occurred in the course of evolution [12]. Further-more, it is now well established that wheat genome organization has been largely influenced by transposable element mobilization [13]. Most of the mechanisms described above increase genome size and lead to an elevated gene copy number. However, much less is known about reverse mechanisms, which reduce genome size to restore a diploid situation and reform single copy gene states. Indeed, early studies in Saccharomyces cerevisiae indicate that only 12% of the duplicate pairs remain after WGD suggesting that an extensive gene loss occurs after WGD [14]. In flowering plants, a fraction of single-copy genes were recently investigated and new hypotheses were suggested [15]: basically, after duplication, genes within one of the duplicated segments tend to be lost through small deletions while most genes are retained within the second segment, a mechanism known as fractionation bias [16]. Another difference occurring after duplication between two genomic segments is known as genome dominance during which one of the two segments shows higher expression levels than the other [16]. Data from maize and brassica further indicate that both gene fractionation, leading to extensive gene loss, and genome dominance are occurring simultaneously keeping the expression of the retained genes at elevated levels [16,17]. Hexaploid wheat does not show an overall genome-wide transcriptional dominance of A, B or D subgenomes although some homoeologous genes can adopt a specific expression pattern [18]. All these recent outcomes reveal important genome dynamics, which affect genome size or organization and alter gene expression. However, mecha-nisms implicated in these phenomena remain largely hypothetical, although epigenetic mechanisms have been
suggested to provide means to induce asymmetric levels of expression between the two duplicated fragments prior to gene fractionation [16].
Although our knowledge about the hexaploid wheat genome structure is increasing, it remains challenging to decipher every step leading to its large genome size of about 16–17 Gb, which includes up to 80% of repeated sequences [13]. In polyploid genomes like cotton, rapeseed or wheat, several studies suggested the importance of epigenetic mechanisms in maintaining genome structure and chromatin stability as well as in regulating gene expression after hybridization and polyploidization [19,20]. One of these epigenetic mechanisms is DNA methylation, which takes place at the carbon-5 cytosine residues in CG, CHG and CHH (where H = A, T or C) contexts [21]. Loss of DNA methylation causes reactivation of silenced trans-posable elements [22] and the expression of certain genes, such as FWA, a gene involved in flowering [23,24]. DNA methylation is also known to affect crossover rate and mei-otic recombination [25].
We wanted to reconstruct the evolutionary history of the hexaploid wheat species Triticum aestivum using the example of MET1, a gene encoding METHYLTRANSFER-ASE 1 (MET1), responsible for DNA methylation main-tenance in the CG context. MET1 is a gene of particular importance for genome maintenance in many organisms, which we hypothesize will be a crucial component of epi-genetic mechanisms controlling transposable elements that in wheat make up to 80% of the genome. To date MET1gene function have been described in several plant species including Arabidopsis [26], maize [27], rice [28] and brassica [29] but not in wheat. We identified MET1 genes in hexaploid wheat (TaMET1). Nine copies of TaMET1 are organized in three paralogous groups at chromosome 2, 5 and 7 suggesting that the genomic regions including MET1 genes were subjected to two du-plication events prior to the emergence of hexaploid wheat. Considering TaMET1 genomic regions specifically, we confirmed that the first gene duplication was part of a WGD common to all grass species and that the second duplication occurred through gene duplication specific to the Triticeae tribe. Expression profiles of the different MET1gene copies, estimation of their evolution rates, CG enrichment and methylation profiles highlight the pre-dominance of group 2 homoeologous genes at the tran-script level. Our results exemplify the high dynamics of genome evolution in the course of the evolutionary history of bread wheat and suggest the involvement of epigenetic mechanisms in these processes.
Results
Hexaploid wheat contains nineTaMET1 loci
In order to determine the number and complete sequence of TaMET1 genes, we chose a genomic strategy based on
a combination of sequence capture and in silico mining of available wheat genome sequences. In order to define probes on the sequence capture microarray, TaMET1-expressed tags (ESTs) were identified in wheat databases. Eight ESTs were retrieved from public and private libraries. The alignment of these ESTs with the rice and brachypo-dium MET1 genes showed that these ESTs mapped to the 3′end of TaMET1 genes. Two TaMET1 ESTs as well as two brachypodium MET1 genomic fragments were se-lected and used to design probes for sequence capture (see Methods). Two successive runs of sequence capture yielded 8,184 reads specific to TaMET1 genes. Genomic fragments were then assembled de novo using gsAssembler in six large contigs corresponding to six putative TaMET1 genes. However some reads remained impossible to assem-ble and could not be included within the six large contigs suggesting the possible existence of additional copies of TaMET1. In parallel, the draft genome assembly of the wheat genome released by Brenchley and collaborators [30] was mined for TaMET1 genes. However, no full-length sequences corresponding to TaMET1 genes were present in the dataset. Taking advantage of the recent re-lease of sequence surveys from the International Wheat Genome Sequencing Consortium (IWGSC) (http://www. wheatgenome.org/) that were produced from sorted chromosome arms [18], BLASTn analyses against each chromosome arm were performed using rice and brachy-podium MET1 genes. Eventually nine MET1 copies were identified and assigned to chromosomes 2A/2B/2D, 5A/ 5B/5D and 7A/7B/7D. For simplicity, homoeologous chro-mosomes A, B and D will be collectively referred to as a “homoeologous group” hereafter. Intron and exon junc-tions were defined for the nine TaMET1 genes according to rice and brachypodium MET1 genes and subsequently validated by RNA-seq analysis (see below). Protein do-mains were then predicted using the Pfam database. Three major protein domains were identified that include DNMT1-RFD (Cytosine specific DNA methyltransferase replication foci domain), BAH (Bromo-Adjacent Hom-ology) and the DNA methyltransferase (C5 cytosine spe-cific DNA methylase) domain (Figure 1). Comparison with MET1genes from rice orthologs showed an overall conser-vation of the TaMET1 genes (Figure 1). Coding sequence analyses revealed that the TaMET1 genes of chromosome 5A and 5D display deletions and premature stop codons (Figure 1) and if expressed produce truncated proteins missing the DNA methyltransferase domain. TaMET-5A1 and 5D1 may be considered as pseudogenes, while all the remaining genes are expected to be functional.
TaMET1 loci originated from two successive duplication events
In a first attempt to understand the genome rearrange-ments, which have led to the nine TaMET1 genes present
in the T. aestivum genome, we retraced the phylogenetic history of TaMET1 genes using MET1 orthologs from monocotyledonous and dicotyledonous species. Two distinct copies of MET1 (i.e. two distinct paralogs) are usually found in monocots such as rice, sorghum and bra-chypodium species. Phylogenetic analysis suggests that homoeologous TaMET1 genes from group 2 are ortholo-gous to OsMET1b on chromosome 7 while homoeoloortholo-gous TaMET1 genes from group 5 and 7 are orthologous to OsMET1aon chromosome 3 (Figure 2A). Hereafter, these two phylogenetic groups are called MET-1a and MET-1b lineages in respect to the MET1 genes from rice. The phylogenetic tree suggests that a first duplication event occurred early during monocot speciation resulting in the MET-1a and the MET-1b lineages (Figure 2A). Since these two copies of MET1 are common to all grass species, the first TaMET1 duplication is likely to be a consequence of the WGD that took place in all grasses and occurred about 56–73 MYa. The second duplication is shared only within the Triticea tribe (barley and wheat in our phylo-genetic tree). Since wheat diverged from brachypodium 32–39 MYa and from barley 10–13 MYa [1,9], this second duplication probably occurred between 32 and 13 MYa. In order to understand if this duplication was the result of segmental or single gene duplication, syntenic relation-ships between regions surrounding the TaMET1 genes from chromosome 5 and 7 and their orthologous loci in rice and brachypodium were investigated. For chromo-some 5A, 5B and 5D, up to 80% of the genes were conserved, whereas only 10-15% were for group 7, sug-gesting that a single gene duplication occurred (Figure 2B). This hypothesis is consistent with the evolutionary model of grass genomes [11,31].
In order to date the duplication event leading to group 5 paralogs, BLASTn analyses were conducted between hexaploid wheat (Triticum aestivum), diploid wheat species (Triticum urartu, Aegilops tauschii) and barley (Hordeum vulgare). Triticum urartu (genome A ancestor) shares the same deletion with TaMET-5A1 while Aegilops tauschii (genome D ancestor) and TaMET-5D1 do not (Figure 2C). It can then be suggested that 5A was already in the process of pseudogenization before polyploidiza-tion while 5D pseudogenizapolyploidiza-tion occurred in the course of, or after, polyploidization. Consistent with this hypoth-esis, 5A displays a more pronounced gene structure alter-ation than 5D (large deletion and numerous stop codons; see also Figure 1).
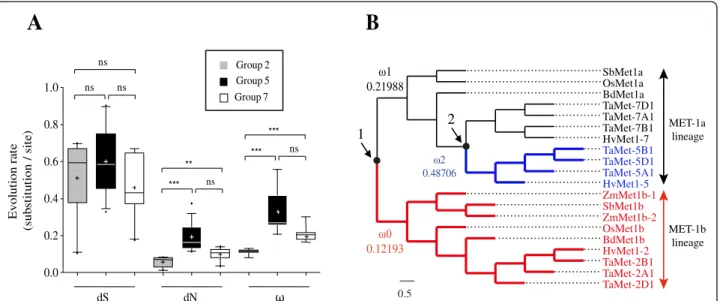
TaMET1 genes display distinctive evolution rates
We then investigated the putative functional differences between the nine TaMET1 genes by evaluation of the evolution rate, which is a good indicator for the bio-logical function of a given gene [32]. We chose the codon substitution model to estimate the rate of synonymous
(dS) and non-synonymous (dN) substitutions and com-puted the dN/dS ratio as evolution rate (ω) [33]. In this model, for genes with a significant biological function undergoing purifying selection non-synonymous muta-tions are expected to be kept at a low level whereas synonymous mutations accumulate randomly according to the neutral theory of evolution [33].
As a first approach, pair-wise divergences were investi-gated between TaMET1 genes and MET1 genes from fully sequenced monocot species (i.e. divergence between orthologous pairs). Mean values for A, B and D homoeo-logs were then calculated per homoeologous group of chromosomes (group 2, 5 and 7) and are displayed in
Figure 3A. Consistent with the neutral theory of evolu-tion, dS rates were not significantly different between the three homoeologous groups. However significant differ-ences were observed for dN andω indicating a lower rate of evolution for homoeologous group 2 which belongs to the MET-1b lineage. Homoeologous group 7 is evolving at an intermediate evolution rate compared to group 2 and group 5 but does not display any deleterious muta-tions within the coding sequences (see also Figure 1). As expected for pseudogenes, higher dN and ω values were found for TaMET1 at homoeologous group 5.
Secondly, various hypotheses concerning evolution rates were then tested and Likelihood Rate Tests (LRT)
DNMT1-RFD BAH domain DNA methyltransferase
MITE Mariner Gypsy MET-1a lineage MET-1b lineage OsMET1a OsMET1b TaMET-2A1 TaMET-2B1 TaMET-2D1 TaMET-7B1 TaMET-5A1 TaMET-7D1 TaMET-5B1 TaMET-7D1 TaMET-7A1
Promoter region coding sequence 3’UTR
BS analysis CG frequency
Phylogeny (cDNA) Evolution rate (protein) Synteny CG frequency RT-PCR RT-qPCR Mutator 1Kb
A
B
Figure 1 Gene structures ofTaMET1 genes. A) The two MET1 genes from rice (OsMET1a; [GenBank: Os03g58400] and OsMET1b; [GenBank: Os07g08500]) were used as a reference to define two MET1 lineages (hereafter called MET-1a and MET-1b lineages). OsMET1a and OsMET1b are shown at the top of each lineage. Gene structures and splice junctions organize TaMET1 genes in 11 exons (black and grey boxes) and 10 introns (horizontal lines). The three distinct protein domains identified are indicated at the top of the figure: DNMT1-RFD (light grey), BAH-domain (dark grey) and DNA methyltransferase (black). TaMET1 genes from chromosome 2 and 7 as well as chromosome 5B are predicted to yield a full-length MET1 protein while 5A and 5D contain stop codons (*) and deletions (Δ). 5′ and 3′UTRs are indicated as smaller boxes. Potential promoter regions were defined as the ~2-3 kb region upstream of the coding sequences and are indicated as a thicker blue line. Unknown sequence insertion (TaMET-7D1) is indicated as a red line and transposable element insertion of Stowaway, Gypsy, Mariner and Mutator are indicated as red boxes. B) Methods used in this study.
were computed. Eleven hypotheses were evaluated to test an increased evolution rate at various branch points in the phylogenetic tree (Additional file 1). Evolution rates are summarized in Figure 3B. The results support the existence of three evolution rates (indicated as ω0, ω1 and ω2 in Figure 3B) consistent with the two dupli-cation events and the pair-wise analysis performed previ-ously (Figure 3A). After gene duplication, long-term changes were observed in our phylogenetic tree.ω0, ω1 and ω2 evolution rates indicate that negative selection occurs in the MET-1b lineage, which has the smallest evolution rate (ω0 = 0.12193) suggesting its functional
role in monocots. Following the first duplication event, a two fold increase in evolution rate (ω1 = 0.21988) is ob-served in the Met-1a lineage except for barley chromo-some 5 and wheat homoeologous group 5 for which a fourfold increase (ω2 = 0.48706) is observed.
Altogether, evolution rate analyses indicate that TaMET1 homoeologous genes of group 2 are submitted to stronger purifying selection and are evolving at a slower rate suggesting their predominant role in DNA methylation maintenance in hexaploid wheat. Following the second duplication event, asymmetric acceleration of the evolution rate is observed between homoeologous
B
0 10 20 30 40 50 60 70 80 90%s
y
n
te
n
y
5A 5B 5D 7A 7B 7D Wheat vs rice Wheat vs brachypodium Group 5 Group 7C
HvMET1-5 TuMET1-5 TaMET-5A1 AetMET1-5 TaMET-5D1A
Di
c
o
t
Mo
n
o
c
o
t
ME T -1 a li neage1
2
AtMET1 BrMET1b BrMET1a PsMET1 MtMET1 DcMET1 NtMET1 SlMET1 SbMET1b ZmMET1b-1 ZmMET1b-2 BdMET1b HvMET1-2 TaMET-2B1 TaMET1-2D1 TaMET1-2A1 OsMET1a BdMET1a HvMET1-7 TaMET-7B1 TaMET-7D1 TaMET-7A1 TaMET-5A1 TaMET-5D1 TaMET-5B1 OsMET1b SbMET1a HvMET1-5 M E T -1a li neageFigure 2MET1 phylogenetic trees in flowering plants and syntenic conservation. A) Maximum likelihood (ML) phylogenetic tree. The ML tree was inferred using cDNA sequences from dicot species including Arabidopsis thaliana (AtMET1: [TAIR:At5g49160]), Brassica rapa (BrMET1a and BrMET1b respectively [GenBank: AB251938 and AB25937]), Pisum sativum (PsMET1: [GenBank: AF034419]), Medicago truncatula: (MtMET1:
[Phytozome: Medtr6g065580]), Daucus carota (DcMET1: [GenBank: AF007807]), Nicotiana tabacum (NtMET1: [Genbank: AB030726]), Solanum lycopersicum (SlMET1: [GenBank: AJ002140]), and monocot species including Sorghum bicolor (SbMET1a and SbMET1b respectively [Phytozome: Sb01g005084 and Sb02g004680]), Zea mays (ZmMET1b-1 and ZmMET1b-2 respectively [Phytozome: GRMZM2G333916 and GRMZM2G334041]), Oriza sativa (OsMET1a and OsMET1b respectively: [Genbank AB362510 and AB362511]), Brachypodium distachyon (BdMET1a and BdMET1b respectively [Phytozome: Bradi1g05380 and Bradi1g55287]), Hordeum vulgare (HvMET1-2 and HvMET1-7 respectively: [Ensembl Genomes: MLOC_61904.6 and: MLOC_10988.2], HvMET1-5 predicted from [GenBank: CAJW010043285]) and Triticum aestivum: TaMET-2A1, 2B1, 2D1, 5A1, 5B1, 5D1, 7A1, 7B1 and 7D1 (this study from IWGSC contigs). Numbers above branches indicate bootstrap values. Two monophyletic groups were defined and called the MET-1a and MET-1b lineages according to the OsMET1a and OsMET1b genes (indicated in boxes). The two gene duplication events observed in wheat and barley are indicated by an arrow. B) Micro-synteny analysis. Micro-synteny was established by BLASTn analysis between genes from brachypodium, rice and IWGSC sequences from wheat chromosomes as described in Methods. Syntenic conservation between rice (in white) and brachypodium (in black) correspond to the number of conserved genes in wheat/number of genes in the syntenic region from brachypodium or rice expressed as percentage. C) Gene structures of MET1 genes at chromosome 5. BLASTn analysis was used to align MET1 genes from Hordeum vulgare (HvMET1-5: [GenBank: CAJW010043285]), Triticum urartu (TuMET1-5 [Ensembl Plants: scaffold15783]), Aegilops tauschii (AetMET1-5 [Ensembl Plants: scaffold164515]) and Triticum aestivum (TaMET-5A1 and TaMET-5D1) (this study).
group 5 and 7 leading eventually to the formation of pseudogenes within group 5 that accumulated deleteri-ous mutations within their coding sequences.
Expression ofTaMET1 genes is mainly driven by homoeologous group 2
The above analysis of evolution rates suggests that homo-eologous genes from group 2 are under purifying selec-tion. As it is well documented that expression patterns influence non-synonymous substitution [34], expression levels and profiles of the nine TaMET1 genes were inves-tigated using RNA seq data from five different organs at three developmental stages each. Expression levels of TaMET1homoeologous genes from group 2 were found to be 10 to 40 times higher than the TaMET-5B1 and TaMET group 7 ones. For TaMET-5A1 and 5D1, no significant expression was detected in any of the 15 conditions (Figure 4A). Homoeologous group 2 were expressed in most tissues at nearly all developmental stages, named according to the Zadoks (Z) scale [35], but with highest expression levels at Z30 in the stem and Z32 in the spike. MET1 expression levels in other species peak in proliferating cells such as in meristems and in re-productive organs [27,28,36]. In wheat we observed TaMET1 expression at early developmental stages espe-cially during early stem extension (Z30-Z32) when wheat
is switching from the vegetative to reproductive phase. At that stage the spike tissue is proliferating requiring active replication during which DNA methylation main-tenance should occur. Similarly, homoeologous group 7 were found to be expressed in almost all conditions but at a very low level compared to group 2 genes. A similar situation was observed in rice where OsMET1a is 10–12 times less expressed than OsMET1b [37]. For homoeolo-gous group 5, only 5B is expressed at low level in grain (Figure 4A).
RNA-seq-based expression profiles were subsequently confirmed by RT-PCR. Various primer pairs were de-signed at the 3′UTR. Semi-quantitative and quantitative analyses confirmed the expression of TaMET1 from homoeologous group 2 (Figures 4B and 4C) but tran-scripts were hardly or not detectable for group 5 and 7 (Figure 4B). Expression levels for 2A, 2B and 2D homo-eologs were investigated by RT-qPCR but did not show strong differences, although 2B was found to be slightly more expressed (Figure 4C). Thus TaMET-2A1, 2B1 and 2D1are expressed in an additive mode.
Recent analyses at the whole genome level indicated that housekeeping genes in wheat are enriched at pericen-tric positions while genes expressed with tissue-specific patterns and pseudogenes are usually found at more sub-telomeric positions [38]. To check whether there is a
SbMet1a OsMet1a BdMet1a TaMet-7D1 TaMet-7A1 TaMet-7B1 HvMet1-7 TaMet-5B1 TaMet-5D1 TaMet-5A1 HvMet1-5 ZmMet1b-1 SbMet1b ZmMet1b-2 OsMet1b BdMet1b HvMet1-2 TaMet-2B1 TaMet-2A1 TaMet-2D1 0.5
B
A
dS dN 0.12193 0.0 0.2 0.4 0.6 0.8 Group 2 Group 7 Group 5 *** ns *** 1.0 ns ns ns *** ns ** Evo lu ti o n ra te (sub st it u ti o n / si te ) 0.21988 0.48706 MET-1a lineage MET-1b lineage 1 2Figure 3 Evolution rate analyses ofTaMET1 genes. A) Pair-wise comparisons. Synonymous (dS), non-synonymous (dN) and evolution rate (ω) are expressed in substitution/site and were performed using Codeml. TaMET1 from wheat homoeologous group 2 (grey boxes) were compared to Brachypodium distachyon [Phytozome: Bradi1g05380 and Bradi1g55287], Sorghum bicolor [Phytozome: Sb01g005084 and Sb02g004680], Oriza sativa [Genbank: AB362510 and AB362511], Zea mays [Phytozome: GRMZM2G333916 and GRMZM2G334041], Hordeum vulgare [Ensembl Genomes: MLOC_61904.6 and: MLOC_10988.2 and GenBank: CAJW010043285] and Triticum aestivum (TaMET-2A1, 2B1, 2D1, 5A1, 5B1, 5D1, 7A1, 7B1 and 7D1) (accession numbers in Additional file 8). Mean values of dS, dN andω (with ω = dN/dS) were then computed for each homoeologous group. Whiskers represent the 10-90% range of mean values, boxes represent interquartile distances, the horizontal line across whiskers represents the median, and“+” the mean values. Kruskal Wallis non-parametric tests were applied to determine significant differences between mean values (*: P < 0.05; **: P < 0.01; ***: P < 0.001). B) PAML branch model. Tree topology was defined by a protein alignment using the same monocot species as in A). The two monophyletic groups MET-1a and MET-1b are indicated at the right. Three distinct evolution ratesω0 (red branches), ω1 (black branches) and ω2 (blue branches) are indicated as well as the two gene duplication events described in Figure 1 (arrow).
correlation between the observed gene expression differ-ences and the physical position of TaMET1 copies on the chromosomes, we genetically mapped TaMET1 loci using 57 SNPs identified in the course of our sequence capture experiments (see Methods). Out of the 57 SNPs, 18 produced high quality results that led to the genetic mapping of five out of nine TaMET1 genes, namely TaMET-2B1, 5A1, 5B1, 7A1 and 7B1. As positions of
homoeologous copies were consistent for groups 5 and 7, we extrapolated the position of all TaMET1 genes from these five copies. Homoeologous group 2 were found to be located in the pericentromeric regions of the short arm of chromosomes 2 whereas group 5 and 7 were mapped to subtelomeric positions of the long arms of chromosomes 5 and 7 respectively (Figure 4D and Additional file 2). 0 5 10 0 5 10 15 20
roots leaves stem spike grain
Group 5 Group 7 100 200 300 400 0 Group 2
B
2B 2D 7A 7B 7D + - + - + - + - + - + - + - + - M 2A 5B 5D + + + -5A M RT Homoeolog RT Homoeolog 500 400 300 200 100 500 400 300 200 100C
TaMET -2A1 TaMET -2B1 TaMET -2D1
Control 1 Control 2 Ta4045 Ta54227 Expression level (relative ratio) 1.8 1.6 1.4 1.2 1.0 0.8 0.6 0.4 0.2 0
D
-57.5 62-63 174.3 -17 25-27 130.4 -10.1 120-130 -285.2TaMET-2B1 TaMET-5B1 TaMET-7B1
A
FPKM
Figure 4 Expression profiles of wheatTaMET1. A) Wheat RNA-seq. Data are expressed in Fragment Reads per Kilobase of Exon Model (FPKM) for each homoeologous group. FPKM were computed according to the following formula: FPKM = 109x (C/NL) where C is the number of mappable reads on a feature, N is the total number of reads in the experiment and L (length) is the sum of exonic sequences in base pairs. Genes were considered to be expressed only for FPKM values >0.15. Samples covering various tissues (root, leave, stem, spike and grain) and developmental stages indicated as Zadoks (Z) scales are indicated at the bottom. Expression levels from TaMET1 genes of a given homoeologous group were used to compute mean values. TaMET1 from group 2 are expressed at higher levels in comparison to the other MET1 copies and display two main peaks of expression in the stem (Z30) and spike (Z32). B) RT-PCR gel analysis. RT-PCR with (+) or without (−) reverse transcriptase was performed for all TaMET1 genes. Control PCR reactions were performed for two constitutively expressed genes corresponding to Ta4045 and Ta54227 selected according to Paolacci et al. 2009. C) Quantitative RT PCR. Reactions were performed for TaMET-2A1, 2B1 and 2D1. Expression is relative to Ta4045 (dark grey) and Ta54227 (light grey). D) Schematic representation of TaMET1 loci. Position of MET1 genes on chromosome maps of 2B, 5B and 7A (chromosome arms in grey and centromere as white ellipse, not to scale). Top and bottom positions on ITMI reference map are indicated in cM.
Thus MET1 expression is mainly driven by homoeolo-gous group 2 indicating specific mechanisms to keep a pre-dominant expression of homoeologous group 2 over groups 5 and 7. This observation resembles a phenomenon observed after METI gene duplication in Arabidopsis where METI transcripts accumulate to 10,000 fold higher levels than those of the duplicated METIIa and b, while METIIIis considered to be a pseudogene [39]. Expression of a specific member of a given gene family is referred to as predominance [40] or transcriptional dominance [16] and in our case occurs for TaMET1 genes at homoeolo-gous group 2. The pericentric position of group 2 genes is consistent with the conclusions drawn from a recent large scale analysis indicating that genes expressed in most tissues are located in more proximal position than those dis-playing tissue-specific expression patterns [38]. Thus expres-sion studies reinforce the idea that MET1 homoeologous group 2 genes might provide methyltransferase activity.
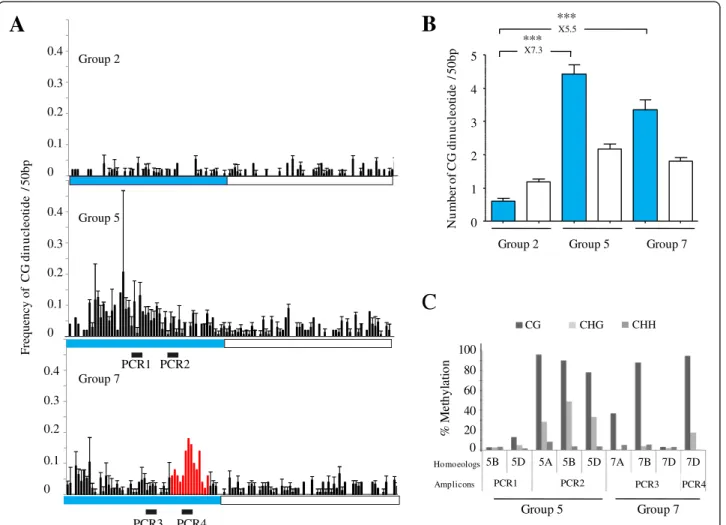
CG-rich isochores appear atTaMET1 promoters and exhibit high DNA methylation
While low, or absent expression of specific TaMET1 genes might be explained by several factors including genetic mutations or insertion of transposable elements, epigen-etic marks at promoter regions are good candidates to explain differences in gene expression [23,24,41,42]. Among these, cytosine methylation that occurs in CG sequence contexts has been shown to modulate gene expression in plants [23,24,41,42]. To investigate the potential role of DNA methylation in the regulation of the MET1genes, MET1 coding sequences as well as putative promoters were scanned for potential methylation sites in CG, CHG and CHH sequence contexts.
The putative promoters of the nine genes were defined as ~2-3 kb regions upstream of the coding sequence de-pending upon the availability of the genomic sequences (Figure 1). Comparisons between upstream and coding sequences for potential methylation sites in CHG and CHH contexts revealed similar amounts of CHG and CHH sites for all nine genes (data not shown). In con-trast, cytosines in the CG context were enriched at poten-tial promoter regions of homoeologous group 5 (4.4 fold) and group 7 (5.5 fold) compared to group 2 putative pro-moters regions (Figures 5A and 5B). This result was unex-pected because CG-rich regions (also known as CG-rich isochores), although already described in Arabidopsis genes, were shown to be mainly located in introns [43].
As CG-rich isochores at TaMET1 upstream regions could be the result of new insertions of CG-rich DNA sequences, we looked for such events. Indeed, two DNA insertions of 786 and 122 bp overlapping with CG-rich isochores were observed for the TaMET-7D1 upstream region (Additional file 3). Both insertions were already present within the ancestral D genome
(Aegilops tauschii) suggesting their integration prior to polyploidization (Additional file 3). BLASTn analysis against the TREP database indicated a short but signifi-cant homology with a stowaway Miniature Inverted Repeat (MITE) for the 122 bp insertion while no sig-nificant homology was detected for the larger 786 bp insertion. BLASTn against TREP performed with the five remaining upstream regions (7A, 7B, 5A, 5B and 5D) failed to detect any transposable elements as shown in Figure 1. Instead of a new large DNA inser-tion enriched in CG observed at 7D, the CG-rich iso-chores are more dispersed along the 5A, 5B, 5D, 7A and 7B putative promoter regions (Figure 5A). This may argue in favor of a progressive CG accumulation in the course of evolution.
To determine whether these regions enriched in cyto-sine residues on homoeologous group 5 and 7 are indeed methylated, we performed bisulfite sequencing. We designed bisulfite primers in a way to simultan-eously amplify all three homoeologous copies that we subsequently discriminated upon sequencing. Consist-ent with our expression studies, putative promoter regions from homoeologous groups 5 and 7 display DNA methylation in CG sequence contexts. Homoeolo-gous group 5 also displays significant CHG methylation (Figure 5C and Additional files 4 and 5). Among all the analyzed putative promoter regions, the highest DNA methylation levels overlap with the 786 bp insertion specific to 7D (Figure 5C and Additional file 5).
Taken together, our results suggest that the presence of CG-rich isochores in the putative promoters of group 5 and 7 TaMET1 homoeologous genes may be due to a progressive and dispersed CG-enrichment as well as to an insertion-mediated CG-enrichment, at least for the 7D copy. In addition, the high methylation levels ob-served in the promoter regions of the two low-expressed homoeologous groups may suggest the existence of an autoregulatory loop controlling MET1 gene expression.
Discussion
Bread wheat is a plant species with a large genome of about 17 Gb containing up to 80% of repetitive sequences. Much attention has been focused recently to understand how this genome, highly enriched in repetitive sequences, controls its transposable element fraction, which will otherwise lead to genome instability. One such mechan-ism is likely to involve DNA methylation in the CG con-text, which is maintained by MET1. It is therefore of importance to understand how MET1 expression is regu-lated in an organism with a complex hexaploid genome. In the course of our work, we observed that TaMET1 genes contain a record of many evolutionary events, which have occurred prior and after the emergence of bread wheat.
We identified nine copies of TaMET1 organized in three homoeologous groups at chromosomes 2, 5 and 7. At the chromosomal level, segments bearing TaMET1 originated from two duplication events. Phylogenetic and micro-synteny confirmed that chromosome 2 and 5 paralogs originated from a WGD about 50–70 MYa in the ancestor of grass species. Then the chromosome 7 paralog emerged from a more recent gene duplication about 13–32 MYa in the Triticea tribe. Our analysis of the evolution rate re-vealed functional differences between the nine TaMET1 genes. The MET-1b lineage (homoeologous group 2) was shown to display a lower evolution rate than the MET-1a lineage (homoeologous group 5 and 7). Lower evolution
rate is observed for genes with biological function and this is best explained by purifying selection, which counter selects deleterious mutations [34,44]. Functional signifi-cance of homoeologous group 2 genes was reinforced by our observations of expression levels and DNA methyla-tion. Low evolution rate in the MET-1b lineage matches with a predominant expression of homoeologous group 2 over group 5 and 7. Predominant expression of one mem-ber of the MET1 gene family was already observed in other species such as Arabidopsis [39] and rice [37] sug-gesting that MET1 expression level and pattern needs to be carefully controlled. Interestingly, we mapped TaMET1 homoeologous group 2 to peri-centric (proximal) position
0 0.1 0.2 0.3 0.4 0 0.1 0.2 0.3 0.4 0 0.1 0.2 0.3 0.4 PCR1 PCR2 PCR3 PCR4 Group 2 Group 5 Group 7
B
*** *** 0.63 1.44 4.85 2.06 3.02 Nu m b er o f CG d in u cle o tid e /5 0 b p 0 1 2 3 4 5Group 2 Group 5 Group 7
X5.5 X7.3
C
Group 5 Group 7 100 80 60 40 20 0 %M et h yl at ion Homoeologs Amplicons 5A 5B 5D 7A 7B 7D 7D PCR1 PCR2 PCR3 PCR4A
Frequency of C G d in u cl eo ti d e /5 0 bp CG CHG CHH 5D 5BFigure 5 CG enrichment and methylation at potential promoters ofTaMET1 genes from homoeologous group 5 and 7. A) Frequency of CG dinucleotides. Frequencies were computed every 50 bp and are shown for each homoeologous group. Putative promoter region and coding sequence are delimited by respectively a blue and white box. Black bars numbered from PCR1 to PCR4 highlight the four regions studied by bisulfite sequencing and are indicated above the graphs. Region 4 is specific to the 7D homoeolog. Arrows indicate the putative transcription start site according to the RNA-seq data. B) Mean values of CG dinucleotides. Mean values of the number of CG dinucleotides of the three homoeologs (A, B and D) for a given homoeologous group (2, 5 and 7) in the putative promoter (blue) and coding (white) sequence regions. Differences between groups 5 and 7 putative promoter regions and group 2 are indicated above the histogram. Statistical significance was confirmed with a Kruskal Wallis non parametric tests with *: P < 0.05; **: P < 0.01; ***: P < 0.001. C) DNA methylation profiles as determined by bisulfite sequencing. Percentages of methylated cytosines of the four amplicons (PCR1 to 4) displayed in Figure 6A were determined after bisulfite sequencing. Percentages of methylation were recorded at each cytosine position and were used to compute a mean value for each amplicon in the CG, CHG or CHH sequence contexts.
while group 5 and 7 were located at more sub-telomeric (distal) regions. Recent large scale analyses in wheat sug-gested that distal regions are more dynamic, displaying higher level of recombination and accumulate more pseu-dogenes and gene duplications than proximal peri-centric regions [38]. Furthermore, genes at distal position display more tissue specific expression than those at more prox-imal position. It is then tempting to hypothesise that a distal chromosome position may have a direct influence on expression leading as a consequence to the predomin-ance of the more proximal genes as observed in our case for homoeologous group 2. Homoeologous group 2 did not show any differences in gene expression among the three homoeologs. Consistent with the whole genome analyses was the fact that genome-wide transcriptional dominance of an individual subgenome (A, B or D) was not observed [18]. Besides its position along the chromo-some, our data indicated that DNA methylation observed in the promoter region of homoeologous group 5 and 7 may have contributed to their transcriptional repression and may have favored an increased evolution rate at TaMET-5A1and 5D1 leading to the accumulation of dele-terious mutations, a process known as pseudogenization [45,46]. Interestingly, distinctions can be made between group 5 homoeologs: 5A already accumulated large dele-tions and numerous stop codons before polyploidization, while stop codons occurred at 5D after polyploidization but are absent at 5B which however displays an elevated level of non-synonymous mutations and is expressed only in grains. Pseudogenes are usually rapidly eliminated and the fact that TaMET-5A1 and 5D1 pseudogenes are main-tained suggests that pseudogenization may not be fully achieved or that these genes contribute in a significant but yet unknown manner to TaMET1 activity.
Our data support a functional role of DNA methylation in the initiation or the maintenance of gene silencing at specific TaMET1 genes. Considering that the chromosome 2 paralog is the ancestral locus and shows low occurrence of potential CG methylation sites, the observed CG-rich isochores at chromosome 5 and 7 paralogs associated with DNA methylation imply CG-enrichment at these putative promoter regions. CG-enrichment was unexpected as usually CG dinucleotides are under-represented due to 5-methylcytosine deamination [43]. At the moment we can only speculate about their possible origin. First, GC-rich and GC-poor isochores are known to occur in animals and several hypotheses have been proposed to explain their emergence [47]. Among them the GC-biaised gene conversion (gBGC) has been proposed as one of the main driving forces in the evolution of nucleotide composition. gBGC favors GC over AT bases in alleles during mismatch repair following heteroduplex formation in the course of meiosis. gBGC results from Base Excision Repair (BER) and involves a DNA glycosylase that specifically removes
thymine in DNA heteroduplexes. Secondly, animal ge-nomes display unmethylated CG-rich elements known as CpG islands (CGIs). CGIs are defined as DNA sequences of a few hundred base pairs, with high CG occurrence, high G + C frequency and are involved in the regulation of gene expression [48]. CGIs have been divided into start and non-start CGIs. Non-start CGI are the most abundant and best explained by insertion of repeated sequences such as transposable elements (in the human genome 79% are due to Alus) while start CGIs located at the transcrip-tion start sites are only poorly explained by transposable element insertion (in the human genome 5,6% are due to Alus) [49]. Interestingly, Suzuki et al., [50] also proposed gBGC as one of the possible mechanisms to explain the emergence of start CGIs. Recently, it was suggested that gBGC occurs in plants [51]. gBGC can be considered as one of the possible mechanisms explaining the emergence of CG-rich isochores at TaMET1 putative promoter re-gions. Indeed, it may be an attractive mechanism to explain the progressive CG enrichment we observed at TaMET1 upstream regions especially at homoeologous group 5 and 7 located at distal chromosome positions where higher recombination rates have been reported [38,52]. Further-more, the MET-7D1 copy would have also undergone insertion of CG-rich DNA fragments in a mechanism very reminiscent to the one observed for non-start CGIs, argu-ing for shared evolutionary mechanisms between animal and plants toward the emergence of CG-rich isochores.
Once CG-rich isochores appeared, they can be methyl-ated in order to silence gene expression. Although CGIs were not described in plant promoters, “dense CG methylation clusters” have been reported and are pro-posed to silence cryptic promoters within the coding se-quence [43]. Silencing of these cryptic promoters is established first through the RNA-directed DNA Methy-lation (RdDM) pathway and results in methyMethy-lation at cytosine residues at CG, CHG and CHH sequence con-texts. Once methylation is set up, only methylation in the CG context, which does not rely on siRNA produc-tion, can be maintained in the course of evolution lead-ing to high methylation only in CG sequence contexts [43]. If such a mechanism occurred within the putative promoter region of TaMET1 genes, it can explain how homoeologous group 7 became progressively repressed.
Given the correlation between DNA methylation in promoter regions and gene silencing [23,24], we suggest that DNA methylation may be part of a possible auto-regulatory mechanism among TaMET1 genes. In this model, MET1 mainly encoded by homoeologous group 2 regulates group 7 gene expression through CG DNA methylation maintenance. CG methylation at homoeolo-gous group 7 may be alleviated in specific organs, develop-mental stages or upon changing environdevelop-mental conditions. However possible roles for the homoeologous group 7
(MET1-a lineage) is challenged by recent data collected in rice indicating that the main MET1 function is ensured by Met1b and not Met1a. Indeed, RNAi against Met1a does not significantly affect plant development while a met1b null mutant is lethal [28,53].
Conclusions
From our data, we propose a chronology (Figure 6) of the genomic events observed at TaMET1 genes, which in-clude WGD, gene duplication, expression predominance of homoeologous group 2, CG-rich isochores emergence, DNA methylation and pseudogenization. The unexpect-edly rich evolution history observed at TaMET1 makes these loci a very attractive model to study further gene evolutionary mechanisms occurring in hexaploid wheat. Increased copy number finally leads to TaMET1 silencing at homoeologous group 5 and 7 (the MET-1a lineage), keeping genes of group 2 (the MET-1b lineage) in an active state. We hypothesize that CG methylation was used as a mean to control gene expression in the MET-1a lineage favoring low expression at homoeologous group 7 and pseudogenization at group 5. For the latter the different evolutionary stages are still observed between homoeologs. CG methylation might be required to limit homoeologous
group 7 transcription using CG-rich isochores, which are the target of CG DNA methylation. At that point, we can only speculate about the possible involvement of methyla-tion in limiting homoeologous group 7 expression in tissues or developmental stages where group 2 is expressed, maybe leading to tissue-specific expression patterns of group 7 genes and their subfunctionalization.
Taken together, our data suggest that DNA methyla-tion at TaMET1 loci can act as an epigenetic determin-ant required to drive genome evolution.
Methods
Analysis of IWGSC sequence surveys
Access to the IWGSC physical map sequences from hexaploid wheat cv Chinese Spring has been established by the URGI (http://urgi.versailles.inra.fr/) on the behalf of IWGSC. BLASTn analyses were performed at the URGI database. Identification of transposable elements in selected IWGSC contigs was performed by BLASTn analyses against the TREP database at http://wheat.pw. usda.gov/ITMI/Repeats/. CG, CHG and CHH profiles (where H is A, C or T) were detected using an in house Perl script available upon request. Gene structures were predicted by cDNA alignment against genomic sequences
Figure 6 Scheme of the genome dynamics atTaMET1 loci in the course of evolution. Scheme of the emergence of the nine TaMET1 genes is given at the left. Evolution time is given from the top to the bottom in MYa. The MET-1a lineage is expressed (green) and evolved at a low evolution rate while genes in the MET-1b lineage are repressed (red) or evolved as pseudogenes (Ψ, black boxes). The hypothetic succession of genomic events occurring at or including TaMET1 is proposed at the right.
using SIM4 (http://pbil.univ-lyon1.fr); protein domains are according to the Pfam database (http://pfam.sanger. ac.uk/). Gene structures were subsequently designed by FancyGene(http://bio.ieo.eu/fancygene/).
Sequence capture
Sequence capture experiments [54,55] were designed to isolate and sequence DNA segments using probes synthe-sized on a microarray. Two runs of sequence capture were performed according to the NimbleGen Arrays User’s Guide followed by 454 Optimized Sequence Capture method. Briefly, MET1 specific probes ranging from 60 to 90 nucleotides were designed at a density of ~1.106 probes/Mb of sequence by Roche-Nimblegen from one Triticum aestivum public EST (accession number TA8302), one private EST (GPIC:S:720428) and from the two coding sequences from Brachypodium distachyon (Accession numbers [Phytozome: Bradi1g05380 and Bra-di1g55290]). The absence of repeated sequences was veri-fied using repeatMasker and TREP release 10 database. Genomic DNA from wheat elite lines cv Brigadier, Alcedo, Renanand Recital were used to build up four distinct gen-omic DNA libraries by nebulization with an average of fragment sizes of ~600 bp. Libraries were then hybridized onto capture arrays, captured DNA was eluted and ampli-fied prior to 454 sequencing on a GS FLX Titanium plat-form according to the manufacturer. Overall, sequence captures yielded 8,184 reads specific to MET1 and de novo assembly was subsequently performed using gsAssembler (Roche) with specific parameters set at 98% similarity and 20 bp overlap. Sequences were verified in the course of the project by BLASTn analysis against the IWGSC sur-veys and by PCR amplification on diploid and hexaploid species.
Genetic mapping
Two mapping populations were used: recombinant Inbred Lines derived from a cross between Triticum aestivum cv Renanand Recital [56] and a doubled haploid population derived from a cross between Triticum aestivum cv Brig-adier and Alcedo (Biogemma personal communication). DNA from all four elite lines was used in the sequence capture experiments and reads were grouped according to the four DNA origins. As a whole, 57 putative Single Nucleotide Polymorphisms (SNPs) were identified and genotyping was subsequently performed on genomic DNA from the two mapping populations using KASPar (KBioscience) fluorescent competitive allele-specific amplification. Primers were designed with Primer picker (KBioscience) and PCR amplifications were performed on a hydrocycler (LGC genomics), for 41 to 50 cycles at 57°C and then run onto a Genotyper (Applied Bio-system). The list of primers used to perform the genetic mapping is provided in Additional file 6. SNP mapping
was performed on the two genetic maps using an in-house bioinformatic pipeline available at Biogemma. Genetic positions are given according to the Renan x Recital recombination map [56]. Physical positions are according to the names of the IWGSC contigs obtained by BLASTn analysis against the virtual map and are in-cluded within the virtual map designed by synteny.
Phylogenetic reconstruction and substitution rate calculation
TaMET1 coding sequences were used for phylogenetic reconstruction and substitution rate calculation. Selected sequences were first aligned with MUSCLE multiple se-quence alignment [57] and then refined using Gblocks [58]. Maximum likelihood analysis was performed with PhyML using default parameters with 1,000 bootstraps [59]. Phylogenetic trees were drawn using ITOL [60]. Substitution rate studies were performed as follows: first, a new phylogenetic tree was built with the same species except that here, dicot species were not considered and the tree was based on protein sequences instead of cDNA. For TaMET1, genomic sequences were used to predict exonic sequences using FGENESH [61] and sub-sequently assembled into a predicted cDNA. Predicted cDNAs were validated in the course of this study by RNA-seq data. cDNAs were translated using Transeq and Sixpack from the EMBOSS package [62]. The phylogen-etic tree was then built from predicted proteins as described above. ω (the ratio of nonsynonymous/syn-onymous substitution rates) was determined using Codemlfrom the PaML package [33]. A likelihood ratio test (LRT) was used to compare various hypothesis models in which ω values are expected to differ among branches, in comparison to a null hypothesis in which all the branches have similar ω. LRT values were then compared to a chi-squared distribution with degrees of freedom equal for a given tree to the number of values of ω -1, as described in Yang [33]. The phylogenetic data sets supporting the results of this article are avail-able in the TreeBASE repository [http://purl.org/phylo/ treebase/phylows/study/TB2:S16421]. The data sup-porting the evolution rate investigated in this study are included within the article and its additional files (Additional file 1).
Micro-synteny analyses
Starting from Murat et al. [31], chromosomal segments including MET1 loci were selected from rice and brachy-podium. To be able to compare our results with those of Murat et al. [31], the same fragment boundaries were retained but in our case, all the coding sequences of a given genomic fragment have been considered. Briefly, rice chromosome 3 [Phytozome: LOC_Os03g58040.1 to LOC_Os03g58920.1] (covering 510.70 kb of genomic DNA
and including 80 genes) and brachypodium chromosome 1 [Phytozome: Bradi1g05680 to Bradi1g04980] (covering 531.9 kb of genomic DNA and including 72 genes) chromosomal segments are syntenic to wheat chromo-some 5 and 7 (Additional file 7). Gene sequences from model species were then used to perform BLASTn ana-lysis against the IWGSC sequence surveys as described in Salse et al. [11] using 70% CIP (Cumulative Identity Per-centage) but only 30% CALP (Cumulative Alignment Length Percentage). The CALP parameter was kept at a low value in order to detect all the micro-syntenic rela-tionships. Percentage of syntenic conservation was then computed as 100 × the number of conserved genes in wheat/number of genes in the syntenic region from bra-chypodium or from rice. The data set supporting the re-sults is included within the article and its additional files (Additional file 7).
RNA-seq
RNA-seq non-oriented libraries were constructed in two replicates from total RNAs of hexaploid wheat cv Chinese Spring. RNAs were prepared with the TruSeq kit (Illu-mina) for 15 biological samples including 5 organs (root, leaves, stem, spike, grain) and 3 developmental stages (be-ginning, middle, and end of development) as described in [63] (Additional file 8). For oriented libraries, samples were pooled by organs, rRNAs were removed from total RNAs with the riboZero kit (Ambion) and RNA-seq li-braries were constructed with the ScriptSeq kit (Epi-centre). All the libraries were sequenced using a HiSeq200 (Illumina) with reads of 100 bp sequenced in both di-rections. Reads from RNA-seq libraries were mapped using Tophat2 v2.0.8 [64] and Bowtie2 [65] onto the MET1 genomic sequences with neither mismatches nor splice-mismatches allowed. Transcript reconstruction and expression levels were analyzed with Cufflinks v2.0.2 [66] without annotation. Because sequencing was bidirectional, which is to say that two reads correspond to the same cDNA molecule, expression data results of transcription levels are expressed in Fragments per Kilobase of Exon Model (FPKM) per million mapped reads [67]. The RNA-seq data sets supporting the results of this article are avail-able in the Sequence Read Archive (SRA) repository, [http://www.ncbi.nlm.nih.gov/sra/ERP004714].
RNA analyses
Wheat plantlets of cv Chinese Spring were grown in a greenhouse and collected at Z61-65 stage according to Zadoks scale [35]. Tissues were frozen in liquid nitrogen and ground to a fine powder. Total RNAs were extracted from 250 mg of plant material using an RNA extraction method adapted from [68]. RNA was subsequently treated with 100 units of DNase I (Invitrogen) in the presence of 20U RNaseOUT™ Recombinant Ribonuclease
Inhibitor (Invitrogen). Quantity of extracted RNA was es-timated using a Nanodrop (Thermo Scientific) and RNA quality was checked by migration on a 2% agarose gel containing MOPS 2% and 0,05% formaldehyde.
Reverse Transcription was performed from 2μg of total RNA using an oligo(dT) 15 Primer and M-MLV Reverse Transcriptase (Promega) in presence of Recombinant RNasin Ribonuclease Inhibitor (Promega) according to the supplier’s recommendation. Homoeologous specific primers were designed manually and validated with Oligo Analyzer (Gene Link) to avoid secondary structure for-mation. Sequences of selected primer pairs can be found in Additional file 6. Semi-quantitative analyses were per-formed using primer pairs with similar efficiencies and on the same cDNA sample by comparing the TaMET1 PCR product to Ta4045 and Ta54227 as reference genes (primer pairs as as in [69]). Quantitative analysis was per-formed on a LightCycler® 480 System using LightCycler® 480 SYBR Green I Master reagent (Roche) according to the supplier’s recommendation. Primer pair efficiencies were calculated through serial dilutions from 1/3 to 1/81 for each RNA sample and only primer pairs with a PCR efficiency between 80 and 110% were selected. As in semi-quantitative analyses, Ta4045 and Ta54227 were used as reference genes.
Bisulfite sequencing
1 g of plant material was collected from stem and leaves at the Z30 stage and DNA extracted using the DNeasy plant maxi kit (Qiagen). 200-500 ng of DNA was sub-jected to bisulfite (BS) treatment using the EZ DNA Methylation-Gold™ Kit (Zymo Research). BS-treated DNA was PCR-amplified using specific primers (Additional file 6) and cloned in pGEMT vectors (Promega) prior to sequencing. 10–20 clones were analyzed for each genomic region using Kismeth software [70]. Two PCR fragments from the VERNALIZATION1 (VRN1) gene previously studied by bisulfite experiments [71] were used as internal controls. Incomplete conversion was excluded by analyz-ing the 0.0 k fragment from VRN-A1, which is devoid of CG methylation, while optimal bisulfite treatment were assessed by analysis of the 9.2 k fragment, a highly CG methylated region from VRN-A1. Examples of results are given in Additional file 9.
Availability of supporting data
The following additional data is available with the online version of this paper. Additional file 1 is a table listing the results of the Likelihood ratio tests. Additional file 2 is a table listing the genetic positions of TaMET1 loci. Additional file 3 is a sequence alignment of the promoter region of TaMET1 from homoeologous group 7 with close species. Additional files 4 and 5 are detailed bisulfite ana-lyses performed at TaMET1 from homoeologous group 5
and 7 respectively. Additional file 6 is a table listing the primers used in this study. Additional file 7 is a table describing micro-synteny data between wheat, rice and brachypodium. Additional file 8 is a table listing the RNA-seq samples used in this study. Additional file 9 is an ex-ample of control experiment in bisulfite sequencing analysis.
Additional files
Additional file 1: Likelyhood ratio tests (LRT). A) Likelihood ratio test (LRT). LRT has been used to compare 11 hypotheses (H1–11) in respect to the null hypothesis (H0) in which all the branches have
the same evolution rate (ω0). Hypotheses were designed to test if the MET1 phylogenetic tree includes up to three evolution rates (ω0, ω1 andω2) and if these variations in ω values are long term changes (i.e. if all the branches below a duplication event display the sameω value) or increase only after a duplication event and then is relaxed toω0. B) Details of the 11 hypotheses tested in the branch model described in Figure 3B. For each hypothesis tested, a tree file in Newick format and a graphic representation highlighting the branches considered in the tested hypothesis are given.
Additional file 2: Genetic positions ofTaMET1 loci. Distal and proximal markers from the ITMI reference map and flanking the 2B, 5B and 7A TaMET1 loci are given in cM.
Additional file 3: Alignment at putative promoter regions of TaMET1 genes from homoeologous group 7. Hordeum vulgare chromosome 7 [Ensembl Genomes: MLOC_10988.2], Triticum aestivum chromosome 7A [IWGSC: 7AL:4532056], 7B [IWGSC: 7BL:6682174] and 7D [IWGSC: 7DL:3392185], Triticum urartu chromosome 7 [Ensembl Genomes: scaffold38640], Triticum tauschii chromosome 7 [Ensembl Genomes: scaffold2203], Alignment were performed with MUSCLE and refined by jalview.
Additional file 4: Bisulfite analysis of putative promoter region of homoeologous group 5. A) Frequencies of CG dinucleotides were computed every 50 bp of the putative promoter regions of
homoeologous group 5. 5A (black), 5B (white) and 5D (grey). Black bars numbered from 1 to 4 highlight the two regions studied by bisulfite sequencing. B) Kismeth outputs of the percentage of methylated cytosines in CG (red), CHG green) and CHH (blue) context.
Additional file 5: Bisulfite analysis of putative promoter region of homoeologous group 7. A) Frequencies of CG dinucleotides were computed every 50 bp of the putative promoter regions of
homoeologous group 7. 7A (black), 7B (white) and 7D (grey). Black bars numbered from 1 to 4 highlight the two regions studied by bisulfite sequencing. B) Kismeth outputs of the percentage of methylated cytosines in CG (red), CHG green) and CHH (blue) context.
Additional file 6: Primers used in RT-PCR, RT-qPCR, mapping and bisulfite experiments.
Additional file 7: Virtual physical map reconstruction atTaMET1 loci from micro-synteny data. Physical maps for Os and Bd, virtual physical map based on IWGSC surveys organized from rice and brachypodium orthologs. TaMET1 loci are highlighted in yellow. Note that two overlapping contigs were found at TaMET-5A1 indicating that these two IWGSC contigs were not assembled together in the course of the assembly process.
Additional file 8: RNA-seq samples used in this study.
Additional file 9: Controls in bisulfite experiments. A) Methylation rates at two VRN-A1 regions called 0.0 k and 9.2 k (adapted from [71]). B) Structure of the VRN-A1 gene. C) Typical results from bisulfite experiments for 0.0 k (no CG methylation) and 9.2 k (high CG methylation).
Abbreviations
BAH:Bromo-adjacent homology; BER: Base excision repair; CALP: Cumulative alignment length percentage; CIP: Cumulative identity percentage; CGIs: CpG islands; DNMT1-RFD: Cytosine specific DNA methyltransferase
replication foci domain; LRT: Likelihood rate tests;ω: Evolution rate; ESTs: Expressed sequence tags; FPKM: Fragments per kilobase of exon model; gBGC: GC-biaised gene conversion; IWGSC: International wheat genome sequencing consortium; MET1: METHYLTRANSFERASE1; MYa: Million years ago; MITE: Miniature inverted repeat; dN: Rate of non-synonymous substitution; dS: Rate of synonymous substitution; RdDM: RNA-directed DNA Methylation; SNP: Single nucleotide polymorphism; WGD: Whole-genome duplication; Z: Zadoks scale.
Competing interests
The authors declare that they have no competing interests.
Authors’ contributions
MTho carried out the phylogenetic analyses, SNP mapping, RT-PCR, bisulfite sequencing and participated in sequence capture experiments. EP designed the RNA-seq experiments and LP carried out its analysis. AP designed perl script to compute the frequency of CG dinucleotides. JD carried out the Sequence capture experiments. MThr carried out the syntenic analysis. SF and JPP participated in the design and coordination of the sequence capture, syntenic analysis and genetic mapping. CT designed and coordinated the study and carried out the evolution rate analysis. MTho, AVP and CT wrote the manuscript. All authors read and approved the final manuscript.
Acknowledgements
MTho is supported by a Cifre PhD agreement n°817/2010 between the CNRS and the Biogemma Company. This work is supported by the“pole de competitivité Céréales Vallée”. CTa and AVP are supported by the CNRS, INSERM, Blaise Pascal and Auvergne Universities. AVP is supported by ANR “Dynam’Het”ANR-11 JSV2 009 01 and ANR “SINODYN” ANR-12-ISV6-0001. CTa and AVP are supported by the Region Auvergne through“Life GRID” and a“Young Researcher Fellowship” respectively. We would like to thank Pr D. E. Evans for editing the manuscript, G. Bronner for technical help in evolution rate analysis, J. Enjalbert for sharing results prior to publication, M. Abrouk and F. Choulet for critical reading and helpful suggestions and two anonymous reviewers for their fruitful comments.
Author details
1UMR CNRS 6293 INSERM U 1103 Clermont Université, Genetics Reproduction and Development (GReD), 24 avenue des Landais, BP80026, 63171 Aubière Cedex, France.2BIOGEMMA, route d’Ennezat, Centre de Recherche de Chappes, CS 90126, 63720 Chappes, France.3UMR INRA 1095 Blaise Pascal University, Genetics Diversity & Ecophysiology of Cereals (GDEC), Clermont-Ferrand– Theix, 5 chemin de Beaulieu, 63039 Clermont-Ferrand Cedex 2, France.
Received: 14 May 2014 Accepted: 13 October 2014 Published: 23 October 2014
References
1. Gaut BS: Evolutionary dynamics of grass genomes. New Phytol 2002, 154:15–28.
2. Feldman M, Lupton F, Miller T: Wheats. In Evol Crops Ed 2 Longman Sci Lond. Edited by Smartt J, Simmonds N. 1995:184–192.
3. Greer E, Martin AC, Pendle A, Colas I, Jones AME, Moore G, Shaw P: The Ph1 locus suppresses Cdk2-type activity during premeiosis and meiosis in wheat. Plant Cell Online 2012, 24:152–162.
4. Moore G, Devos KM, Wang Z, Gale MD: Cereal genome evolution: grasses, line up and form a circle. Curr Biol 1995, 5:737–739.
5. Yu J, Hu S, Wang J, Wong GK-S, Li S, Liu B, Deng Y, Dai L, Zhou Y, Zhang X, Cao M, Liu J, Sun J, Tang J, Chen Y, Huang X, Lin W, Ye C, Tong W, Cong L, Geng J, Han Y, Li L, Li W, Hu G, Huang X, Li W, Li J, Liu Z, Li L, et al: A draft sequence of the rice genome (Oryza sativa L. ssp. indica). Science 2002, 296:79–92.
6. Goff SA, Ricke D, Lan T-H, Presting G, Wang R, Dunn M, Glazebrook J, Sessions A, Oeller P, Varma H, Hadley D, Hutchison D, Martin C, Katagiri F, Lange BM, Moughamer T, Xia Y, Budworth P, Zhong J, Miguel T, Paszkowski U, Zhang S, Colbert M, Sun W, Chen L, Cooper B, Park S, Wood TC, Mao L, Quail P, et al: A draft sequence of the rice genome (Oryza sativa L. ssp. japonica). Science 2002, 296:92–100.
7. Paterson AH, Bowers JE, Bruggmann R, Dubchak I, Grimwood J, Gundlach H, Haberer G, Hellsten U, Mitros T, Poliakov A, Schmutz J, Spannagl M, Tang H,