HAL Id: hal-01060558
https://hal.archives-ouvertes.fr/hal-01060558
Submitted on 15 Feb 2019
HAL is a multi-disciplinary open access
archive for the deposit and dissemination of
sci-entific research documents, whether they are
pub-lished or not. The documents may come from
teaching and research institutions in France or
abroad, or from public or private research centers.
L’archive ouverte pluridisciplinaire HAL, est
destinée au dépôt et à la diffusion de documents
scientifiques de niveau recherche, publiés ou non,
émanant des établissements d’enseignement et de
recherche français ou étrangers, des laboratoires
publics ou privés.
Ultrasonic emissions reveal individual cavitation bubbles
in water-stressed wood
Alexandre Ponomarenko, Olivier Vincent, Amoury Pietriga, Hervé Cochard,
Eric Badel, Philippe Marmottant
To cite this version:
Alexandre Ponomarenko, Olivier Vincent, Amoury Pietriga, Hervé Cochard, Eric Badel, et al..
Ul-trasonic emissions reveal individual cavitation bubbles in water-stressed wood. Journal of the Royal
Society Interface, the Royal Society, 2014, 11 (99), 7 pp. �10.1098/rsif.2014.0480�. �hal-01060558�
Ultrasonic emissions reveal individual cavitation bubbles in
water-stressed wood
A. Ponomarenko
1,
O. Vincent
1,
A. Pietriga
1,
H. Cochard
2,3,
E. Badel
´
2,3and
P. Marmottant
11
Laboratoire Interdisciplinaire de Physique, LIPhy, CNRS et Universit´e de Grenoble, France.
2INRA, UMR 547 PIAF, 63100 Clermont-Ferrand, France. 3Clermont Universit´e, Universit´e Blaise Pascal, UMR 547 PIAF,
63177, Aubi`ere, France.
Summary
Under drought conditions, the xylem of trees that conducts ascending sap produces ultrasonic emissions whose exact origin is not clear. We introduce a new method to record si-multaneously both acoustical events and optical observation of the xylem conduits within slices of wood that were em-bedded in a transparent material setting a hydric stress. In this article, we resolved the fast development of all cavita-tion bubbles and demonstrated that each ultrasound emis-sion was linked to the nucleation of one single bubble, whose acoustic energy is an increasing function of the size of the conduit where nucleation occurred and also of the hydric stress. We modeled these observations by the fact that wa-ter columns in conduits store elastic energy and release it into acoustic waves when they are broken by cavitation bub-bles. Water columns are thus elastic, and not rigid, ”wires of water” set under tension by hydric stresses. Cavitation bubbles are at the origin of an embolism, whose development was followed in our experiments. Such an embolism of sap circulation can evolve in a fatal condition for living trees. These findings provide new insight for the non-destructive monitoring of embolism within trees, and suggest a new ap-proach to study porous media under hydric stress.
Keywords: bubble, nucleation, xylem, acoustic emis-sions
1
Introduction
Sap ascends in trees through the xylem tissues (wood), a porous structure containing a network of parallel and
in-terconnected conduits that are a few dozen micrometers in diameter, using a seemingly hazardous mechanism relying on water under tension [1, 2]. This mechanism has for long generated controversy because tensed water is metastable: water columns may be seen as ”wires of water” [3] as op-posed to the ”ropes of sand” proop-posed by early opponents of the cohesion tension theory [4, 5]. Physicists have since established that pure liquid water does sustain extremely negative pressures, negative by tens of MPa [6]. Beyond this pressure, water vaporizes by cavitation. Because of the large contact area between the wood cell walls and the water column that greatly favors the bubble nucleation, the risk of heterogeneous cavitation in trees is very high. Cavitation occurs when the sap pressure is abnormally negative, in case of drought for instance, generating an embolism of the sap circulation which can prove to be fatal for the trees [7]. Most trees have a narrow safety margin away from this hydraulic rupture [8]. If cavitation is beneficial in other context such as the discharge of spores in ferns [9] (or harmless in human cracking joints [10]), it is now seen as a major player in the determination of tree mortality by drought [11].
However, the physical mechanism of cavitation develop-ment in trees remains unknown, the two main hypotheses being ”nucleation” and ”air seeding”. Experimental inves-tigations are still largely constrained by methodological is-sues. Most methods are invasive and subject to artifacts [12], while non-invasive observation tools such as magnetic resonance imaging [13] or X-ray microtomography [14] do not provide fast high resolution images.
An indirect but very attractive approach is to record acoustic emissions from intact wood, as for non-destructive testing of engineering structures [15]. Milburn and Johnson were the first to record ”clicks” [16] in the audible acous-tic range, while Tyree and Dixon [17] evidenced ultrasonic emissions. It is established that ultrasonic emissions are more frequent under water stress conditions [7] and are cor-related with embolism patterns [18, 19, 20] suggesting that ultrasounds may be linked to cavitation. But there is still
2 Experiment 2
no direct evidence of the exact origin of ultrasounds, which represents a major limitation for its use in cavitation stud-ies.
Here we investigated the question of the origin of ultra-sounds emissions. We developed a new method to record simultaneously both acoustical emission and optical obser-vations of thin wood slices molded in a transparent hydrogel reproducing the live conditions in a tree. This method could also be useful to study any porous media under hydric stress [21].
2
Experiment
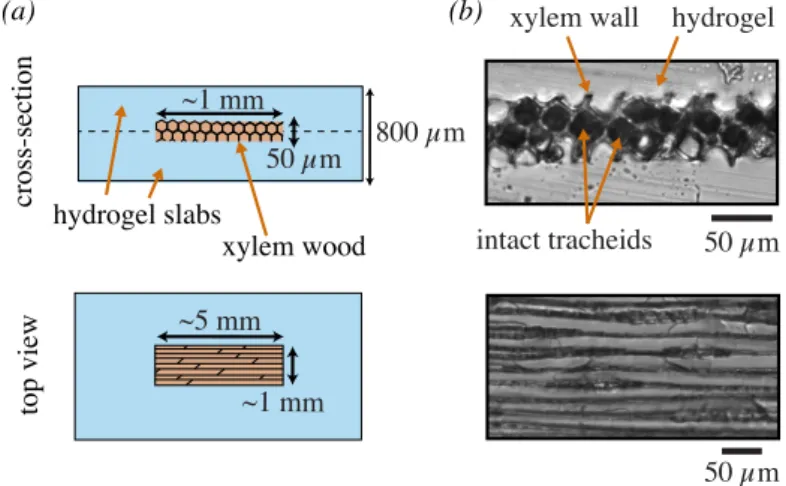
To monitor functional xylem conduits, we cut 50 µm thick slices from fresh xylem samples (Scots pine, Pinus sylvestris L.) cut along the longitudinal axis of the conduits, called tracheids in gymnosperms. This thickness ensured that the sample became transparent to visible light while it still contained several intact conduits. We chose Scots pine species whose wood is made of short tracheids. The intact tracheids lengths we measured in our samples ranged from 20 µm to 1200 µm. The samples were around 5 mm long. This ensured that the samples contained intact tracheids.
This technique using slice samples was used in several studies [22, 23] but has the drawback of exposing the sec-tioned slice to air entry. In order to generate the hydric stress in wood and to avoid air infiltration, we molded the wood slices in polyhydroxyethylmethacrylate (pHEMA), a wet and stiff hydrogel formulated according to Wheeler & Stroock [24]. The hydrogel is porous to water, allowing mass transfer of water from the wood to the hydrogel sur-face, while preventing air invasion, since the mesh size of the hydrogel is nanometric [24]. The molding in between two half-cured hydrogel slabs is described in Fig. 1 and detailed in the Appendix A. Materials and Methods. Note that the final UV curing did not result in a shrinking of the gel, there-fore the gel closely matched the shape of wood. It resulted in a close bounding of the hydrogel with the wood slice, without visible void space in between them where bubbles could propagate (see Fig. 1b).
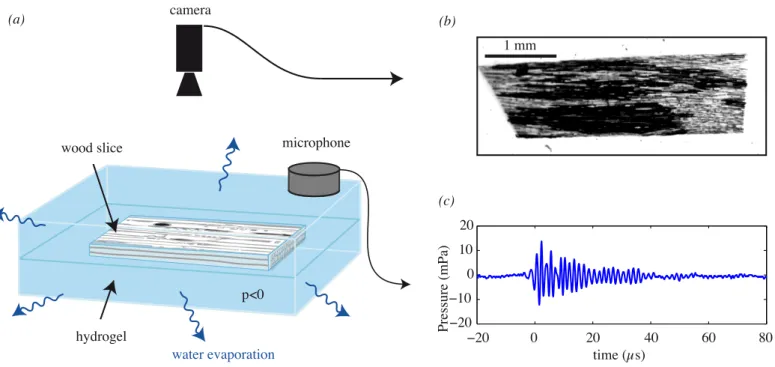
We placed the sample in a controlled subsaturated at-mosphere: evaporation at the surface of the porous hydrogel induced a hydric stress within the sample (Fig. 2a). The level of hydric stress is quantified by the water potential Ψ. At equilibrium, Ψ is directly set by the humidity level: it is 0 for an atmosphere saturated in humidity, and negative for a non-saturated atmosphere. The building of a hydric stress was similarly to what occurs naturally within the leaf of a tree. The atmospheric potential of water vapor
equi-librated through the leaf/hydrogel (acting as a membrane) with the liquid contained in the conduits: xylem conduits or artificial conduits as in [24]. This hydric stress was thus transmitted to the liquid contained in the wood inclusion, which resulted in the lowering of the liquid pressure p com-pared to the atmospheric pressure p0 (since Ψ = p − p0 in
a pure liquid), until cavitation occurred in the wood con-duits, at a water pressure potential expected to be around -3.6 MPa for Scots pine [25]. Note that the water poten-tial slowly built within the hydrogel sample, because it took time for water to diffuse out of the gel [26]. The hydrogel was sufficiently stiff to sustain this very large pressure and did not cavitate (rupture) itself. Under evaporation both wood and hydrogel shrunk, and we did not observe the ap-parition of voids due to detachment of hydrogel from wood in our experiments reported.
During this drought experiment we monitored the inclu-sion both (i) optically with a camera mounted on a micro-scope (Fig. 2b) and (ii) acoustically with high sensitivity microphones (Fig. 2c).
3
Results
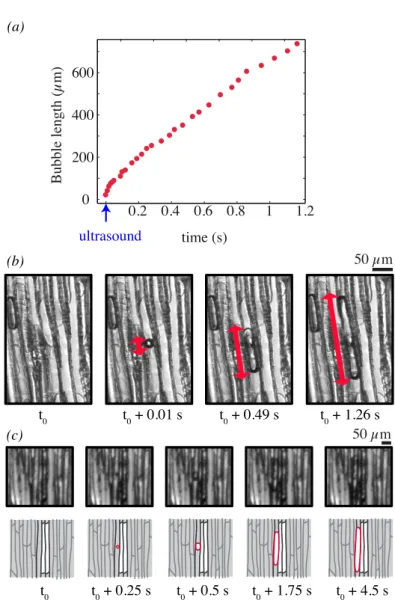
During the water stress, air bubbles suddenly appeared in conduits (defining an ”optical event”, that was detected by image analysis). Then, one air bubble usually took a charac-teristic time of 4 ± 3 s before it filled the entire conduit. We distinguished two types of optical events: on the one hand, the ”nucleation” events, starting in a fully wet area and, on the other hand, the ”air seeding” events, here defined as the appearance of bubbles near an already gas filled conduit. The first type of events showed that pre-existing bubbles were not necessary for the start of the cavitation process (Fig. 3ab). The second phenomenon resulted in extending patches of gas (Fig. 3c). This proved that the embolism de-velopment in our system was not the gradual propagation of a gas front, but the abrupt appearance of bubbles, and their intermittent development from several nuclei.
A second major finding was obtained from the detection of all ”acoustic events” (signals whose amplitude exceeded a defined threshold value) in the ultrasonic range. We investi-gated what was the precise moment of these acoustic events, zooming on a few conduits and recording with a high-speed camera. Recordings showed that a sound was always syn-chronized with a bubble appearance at the millisecond time scale, see Fig. 3a. This result clearly indicated that the ultrasound emission was correlated in time with bubble nu-cleation.
4 Discussion 3
we found that nearly all acoustic events (118 over a total of 118 and 84 over a total of 87 for samples 1 and 2 re-spectively)were correlated in time with one specific bubble nucleation with a delay that was less than the time inter-val between images. This therefore discards other possible origins of sounds, such as wood failures or conduit collapses [17] at least for our specific case of a conifer species whose conduits are only tracheids.
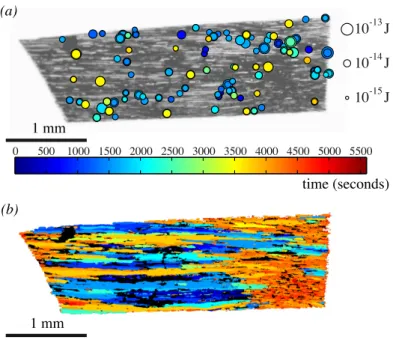
From the correlation of acoustic events with optical events we obtained the spatiotemporal distribution of emis-sions, i.e. we could plot the position of the conduits where single ultrasound emissions were detected, obtaining the analog of a seismic map, see Fig. 4A, providing the point of origin of each sound. Plotting the time of filling for each con-duit, we clearly observed on Fig. 4B the extending patches of gas propagating by ”air seeding”.
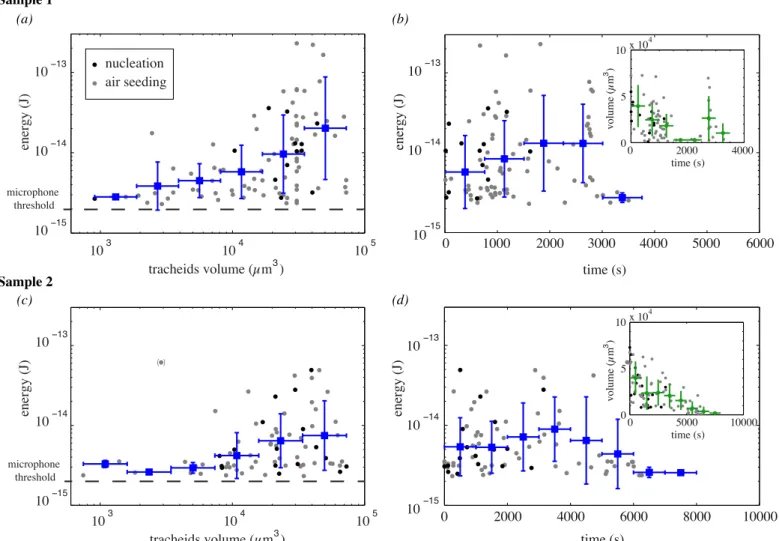
A striking result was that sound energies were widely scattered (size of circles in Fig. 4A), and that some bubbles do not even produce any recordable ultrasound. For a typ-ical experiment with a millimetric sample the counts were 84 acoustic events and 463 optical events (sample 2). The acoustic recordings synchronized with optical events clearly suggested that the energy of each acoustic event increased with the volume of the corresponding conduit, for two sam-ples (Fig. 5a for sample 1 and Fig. 5c for sample 2).
4
Discussion
We now interpret the acoustic results, considering the elastic energy that is stored in the conduits. Under the large hydric pressures developed by evaporation, the volumic elasticity of water comes into play. As water is tensed, it is elasti-cally stretched with respect to its initial volume at rest: the larger the water conduit, the higher the storage of total elas-tic energy. Assuming that always the same fraction of elaselas-tic energy could be converted in acoustic energy, the variations during the experiment were thus explained by the variabil-ity of the conduit sizes and the degree of water tension at cavitation.
The stored elastic energy can be predicted quantita-tively. It depends on the hydric negative pressure p of the liquid. The nucleation of a bubble suddenly relaxes this pressure to a near vanishing value prelax' 0. Indeed, after
nucleation the liquid pressure is in equilibrium with the gas pressure (neglecting capillary effects), thelatterbeing close to vacuum in a freshly cavitated bubble, before water vapor and then air dissolved in surrounding liquid fills the bubble [26].
The initial negative pressure p is stretching both (i) the
volume of water that is contained in a conduit of volume Vc and (ii) the conduit walls. The volume ∆V of the
bub-ble just after nucleation (< 1µs) is therefore the sum of the volumes released by the relaxation of these two stretched volumes. It is such as ∆V /Vc = p/K, where K is an
effective elastic bulk modulus. Because water and wood volumes are stretched in series by the same pressure, the effective modulus writes K = 1/(1/Kwater+ 1/Kc) [26, 27],
with the compression modulus of water Kwater (2.2 GPa),
and a volumetric elastic modulus Kc ∼ G linked to the
de-formation of the material surrounding the cavity (G being the elastic shear modulus of the solid material surrounding the conduit). Here we followed [28] and we used the value of Kc = 0.75 GPa, typical of conifers. This results in an
effective modulus of K = 0.5 GPa. With this new parame-ter we can now evaluate the density of elastic energy prior cavitation to be 1/2 × K(∆V /Vc)2= 1/2 × p2/K.
The total elastic energy stored in the cavity volume therefore writes: Eelastic= 1 2 p2 KVc (1)
The energy stored is a function of the stretching ten-sion p, and the cavity volume Vc. Upon bubble nucleation,
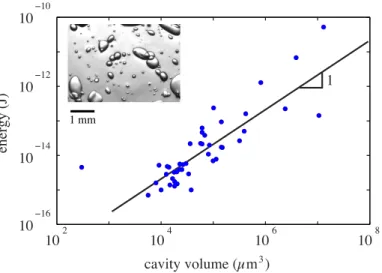
this elastic energy was partly released into acoustic radia-tion [26]. The microphone captured a part of this energy; the remaining energy being emitted in air or absorbed in the different materials (wood, hydrogel and structure). The same experiments were performed on artificial wood with a simpler geometry in order to validate this prediction. This mimetic material consisted of a hydrogel containing spheroidal cavities that were initially filled with water, and then set under hydric stress according to the Wheeler et al. method [24], providing nucleation at −20 MPa. Thanks to this calibration experiment, we showed that over a wide range of cavities volumes the acoustic energy of events was proportional to the water volume, see Fig. 6. Our results thus provide a first mechanistic demonstration of previous observations of Mayr et al. [29], who suggested that the energy of acoustic emissions may correlate with the average tracheid dimensions.
The ultrasound energy therefore mainly reflected the conduit volume, so that smaller volumes produced a sound level that was below the detection threshold value of our microphones. The threshold value was fixed in order to re-move the noise. Variations in tension at cavitation (because of different conduit anatomies) or variations in distances to the microphone accounted for the distribution of acoustic energies at a given volume.
5 Conclusion 4
In addition, we noted a difference between the cavita-tion bubbles occurring near intact conduits (”nucleacavita-tion”), and cavitation bubbles occurring near already cavitated con-duits (”air seeding”, extending the gaseous patches). A mi-nority of bubbles originate from nucleations (15 %) at earlier times, but on average they were much more likely to pro-duce a recordable emission (41 % against 21%). Our inter-peration is that the level of liquid pressure to be specified in equation (1) is less negative for ”air seeding” bubbles. We expect such bubbles to be triggered when the pressure difference between the filled conduit and the cavitated con-duit, ∆p = p − pcavitated ' p, overcomes a threshold value.
This threshold value may be less negative on average than the ”nucleation” pressure (else we would observe isolated nucleations only). This results in a lower released elastic energy according to equation (1), decreasing the likelihood of detecting such acoustic events. Note that two hypothesis remain for the origin of ”air seeding” bubbles: (a) air prop-agates through a pit pore (a few dozens of nanometers [30]) or (b) the pit ruptures and breaks open irreversibly [31]. Note also that we cannot here detect optically the propa-gation of air, and a nucleation occurring near a cavitated conduit would be classified as an air seeding event. Last, we must specify that the acoustic signals were similar for both types of bubbles, but nucleations occurred only at the beginning of the experiments.
In the course of time, the average acoustic energy of each bubble clearly increased and then decreased after a maxi-mum value (Fig. 5b for sample 1 and Fig. 5d for sample 2). We can also interpret this climax with the prediction. The stretching tension is expected to initially increase because of the progression of dehydration, which accounts for the energy increase, but the volume of cavitating conduits also decreased drastically (insert Fig. 5bd ), which accounts for the final decrease.
5
Conclusion
In summary, we proposed a technique to monitor the devel-opment of embolism in a slice of xylem wood under hydric stress. The propagation of embolism is found to be the con-sequence of two abrupt phenomena: nucleation and discon-tinuous propagation from conduit to conduit (air-seeding). The original combination of acoustic and fast optical mi-croscopy brought insights in the induction of cavitation. Remarkably, we demonstrated that every ultrasound emis-sion in xylem was triggered by a bubble nucleation. This discards other possible origins of sounds, such as wood fail-ure or conduit collapse at least for our specific case of a
conifer wood whose conduits are tracheids. Moreover, we showed that the energy we recorded with the microphones was linked to the mechanical elastic energy that was released during the cavitation event. In a living tree, water stressed bark also emits ultrasounds but they are not linked to xylem cavitation [32]: further experiments are needed to filter out those emissions. The origin of sound in xylem is the con-sequence of the sudden relaxation of tension by a bubble. The vibration causing the acoustic emission remains to be resolved. One relevant hypothesis is a bubble vibration: in-deed within artificial wood in hydrogel it was found that nucleated bubbles oscillate in volume for a few periods, at a MHz frequency linked to the compression modulus of water and the surrounding matrix [27].
These findings strengthen the ultrasonic approach to monitor cavitation. The results enlightened that the en-ergy of the acoustic signals was linked to the volumes of the cavitating conduits. A promising application opened by this study is that the energy of acoustic events goes through a maximum in the middle of the cavitation process, which proves useful to interpret the cavitation state of a living tree. With a simple and non-invasive ultrasonic sensor, there is now a great potential to follow in situ the effect of severe droughts associated with climate changes on the survival of forests.
Appendix. Materials and Methods
To prepare wood inclusions, 50 µm thick xylem slices were cut with a microtome, tangentially to the surface of the tree (radial plane) allowing most pits connecting conduits to be observed from the side. The fresh and still humid xylem was molded in pHEMA hydrogel, see Fig. 1. The pHEMA hydrogel was built by polymerization of a monomer solution of HEMA. The solution of HEMA was directly inspired from Wheeler et al. formulation [24]: 2-hydroxyethyl methacry-late (65 vol%), ethyleneglycol (6 vol%), methacrylic acid (1 vol%), de-ionized water (28 vol%) with an additional 1 vol% of photoinitiator solution (600 mg 2,2-dimethoxy-2-phenylacetophenone dissolved in 1 ml of n-vinyl pyrroli-done). All chemicals were from Sigma Chemicals. To in-clude the xylem slice in hydrogel, we prepared two half-cured (1 minute in UV light, within a UV chamber, CL 508 from Uvitec Cambridge) hydrogel slabs 400 µm thick, pre-pared in between two glass slides spaced by a rectangular jig. Then we bound the three layers of gel/xylem slice/gel as shown on Fig. 1 and terminated the polymerization of the hydrogel with UV light in the UV chamber during 3 minutes. The assembly was done with watered slabs, in
or-5 Conclusion 5
der to avoid trapping bubbles and keep the system always fully wet. Applying a slight finger pressure before curing was required in order to ensure a good binding and to avoid detachment during drying (as observed with unsuccessfully bound samples). Artificial wood was prepared as described in [24], by bubbling Argon gas in lightly cured monomer solution, resulting in spheroidal water-filled cavities with a wide range of sizes. Both artificial wood and wood inclusion were soaked for at least 24h in deionized and degassed water in order to dissolve potential bubbles.
The samples were held directly in between two high-frequency microphones (PICO-HF 1.2, bandwidth 0.5-1.85 MHz, from Physical Acoustic Corporation) facing each other, using a thin layer of coupling elastomer (Tensive gel, from Parker laboratories) to insure a good acoustic coupling between the gels and the microphones. The clamping config-uration of the microphones avoided any contact with other surfaces and thus avoided frictional noises. The sample and microphones were placed in a closed chamber made of two Petri dishes and a home-made centimetric spacer, all being wrapped with parafilm. The hydric stress was imposed by a saturated KCl solution in the bottom dish, ensuring a rel-ative humidity of 85 %, corresponding to a water potential of around -22 MPa at equilibrium [33]. This imposed hydric stress was well below the one causing 50 % reduction in hy-draulic conductance of Scots pine (-3.6 MPa [25]), and was thus never reached in the conduits because of cavitation.
The samples were optically monitored under a zoom stereo-microscope with a camera (AVT Marlin F-421B, imaging at 3.75 Hz). Image analysis helped to detect ap-pearance of bubble, by looking at the differences between
images separated by around 1 second. The volume of con-duits was estimated from the conduit length as measured on images, multiplied by the cross-section area. To follow the fast nucleation of bubbles, we used a fast camera (Miro 4, Vision Research, operating at 1000 frames per second).
An acquisition card (USB AE Node, Physical Acous-tics) recorded the microphone signals during 700 µs when the acoustic pressure exceeded a threshold value of 4 mPa. The acoustic energy received by a microphone is given by Emic = Smic
R p(t)2
ρpc dt, with Smic the microphone area in
contact with the hydrogel, p(t) the acoustic pressure re-ceived by the microphone (using the calibration chart to convert voltages into Pascals), ρp = 1274 kg/m3 and c =
2000 m/s the density and the speed of sound in the hydro-gel. The speed of sound within the hydrogel was measured with pure hydrogel samples of thicknesses e ranging from 0.3 to 1.8 mm, and placed inside a water tank and probed in echo mode with ultrasound pulses generated by a piezo-transducer connected to a pulser-receiver (model 5073PR from Panametrics).
Acknowledgments
We would like to thank A. Stroock for fruitful discussions on hydrogels, S. Rosner, H. J. Schenk and K. Charra-Vaskou for pointing useful references, Camille Lucas for drawing illustrations, K. Ferhat for the optimization of the mold-ing, J.-C. Vial for discussions on the optical visualization of wood, and J. Etienne for critical reading. The authors acknowledge financial support from Agence Nationale de la Recherche (grant Microacoustics ANR-08-JCJC-014-01) and Institut Rhˆonalpin des Syst`emes Complexes (IXXI).
References
[1] Tyree, M. T. & Zimmermann, M., 2002 Xylem Structure and the Ascent of Sap (Second Edition). Springer-Verlag. [2] Stroock, A. D., Pagay, V. V.,
Zwie-niecki, M. a. & Michele Holbrook, N., 2014 The Physicochemical
Hydrodynam-ics of Vascular Plants. Annual Review
of Fluid Mechanics 46, 615–642. ISSN
0066-4189.
(doi:10.1146/annurev-fluid-010313-141411).
[3] Woodhouse, E., 1933 Sap hydraulics. Plant physiology 8, 177–202.
[4] Darwin, F., 1896 Report of a discussion on the ascent of water in trees. Annals of Botany os-10, 630–661.
[5] Brown, H. R., 2013 The theory of the rise of sap in trees : some historical and conceptual remarks. Physics in
Perspec-tive pp. 1–31. ISSN 1422-6944. (doi:
10.1007/s00016-013-0117-1).
[6] Herbert, E., Balibar, S. & Caupin,
F., 2006 Cavitation pressure in
water. Physical Review E 74,
041603. ISSN 1539-3755. (doi:
10.1103/PhysRevE.74.041603).
[7] Tyree, M. T. & Sperry, J. S., 1989
Vulnerability of xylem to cavitation
and embolism. Annu. Rev. Plant
Phys. Mol. Bio. 40, 19–38. (doi:
10.1146/annurev.pp.40.060189.000315). [8] Choat, B., Jansen, S., Brodribb, T. J.,
Cochard, H., Delzon, S., Bhaskar, R., Bucci, S. J., Feild, T. S., Gleason, S. M., Hacke, U. G. et al., 2012 Global conver-gence in the vulnerability of forests to drought. Nature 491, 752–5. ISSN 1476-4687. (doi:10.1038/nature11688). [9] Noblin, X., Rojas, N. O., Westbrook, J.,
Llorens, C., Argentina, M. & Dumais, J.,
2012 The Fern Sporangium: A Unique Catapult. Science 335, 1322. ISSN 0036-8075. (doi:10.1126/science.1215985). [10] Deweber, K., Olszewski, M. & Ortolano,
R., 2011 Knuckle cracking and hand
os-teoarthritis. Journal of the American
Board of Family Medicine : JABFM
24, 169–74. ISSN 1557-2625. (doi:
10.3122/jabfm.2011.02.100156).
[11] Brodribb, T. J. & Cochard, H., 2009 Hy-draulic failure defines the recovery and point of death in water-stressed conifers.
Plant physiology 149, 575–84. ISSN
0032-0889. (doi:10.1104/pp.108.129783). [12] Cochard, H., Badel, E., Herbette, S. & Delzon, S., 2013 Methods for measur-ing plant vulnerability to cavitation: a critical review. Journal of Experimental Botany 64, 4779–4791. ISSN 0022-0957. (doi:10.1093/jxb/ert193).
5 Conclusion 6
[13] Holbrook, N. M., Ahrens, E. T., Burns, M. J. & Zwieniecki, M. a., 2001 In vivo observation of cavitation and embolism repair using magnetic resonance imaging. Plant physiology 126, 27–31. ISSN 0032-0889. (doi:10.?1104/?pp.?126.?1.?27).
[14] Brodersen, C. R., McElrone, A. J.,
Choat, B., Matthews, M. A. & Shackel,
K. A., 2010 The dynamics of
em-bolism repair in xylem: in vivo
vi-sualizations using high-resolution
com-puted tomography. Plant physiology
154, 1088–95. ISSN 1532-2548. (doi:
10.1104/pp.110.162396).
[15] Grosse, C. U. & Masayasu, O., 2008
Acoustic emission testing. Springer.
ISBN 9783540698951.
[16] Milburn, J. & Johnson, R. P. C., 1966 The conduction of sap II. Detection of vibrations produced by sap cavitation in Ricinus Xylem. Planta 69, 43–52. ISSN 0032-0935. (doi:10.1007/BF00380209). [17] Tyree, M. T. & Dixon, M. A., 1983
Cav-itation Events in Thuja occidentalis L. ?
Plant Physiology pp. 1094–1099. ISSN
0032-0889. (doi:10.1104/pp.72.4.1094).
[18] Johnson, D. M., Meinzer, F. C.,
Woodruff, D. R. & McCulloh, K. a.,
2009 Leaf xylem embolism, detected
acoustically and by cryo-SEM, corre-sponds to decreases in leaf hydraulic conductance in four evergreen species. Plant, cell & environment 32, 828–36.
ISSN 1365-3040.
(doi:10.1111/j.1365-3040.2009.01961.x).
[19] Rosner, S., Klein, A., Wimmer, R. & Karlsson, B., 2006 Extraction of fea-tures from ultrasound acoustic
emis-sions: a tool to assess the hydraulic
vulnerability of Norway spruce
trunk-wood? The New phytologist 171,
105–16. ISSN 0028-646X. (doi:
10.1111/j.1469-8137.2006.01736.x).
[20] Vergeynst, L., Bogaerts, J., Baert, A., Kips, L. & Steppe, K., 2013 New type of vulnerability curve gives insight in the hydraulic capacitance and conductivity
of the xylem. Acta Horticulturae 991,
341–347. ISSN 0567-7572.
[21] Brochard, F. & Gennes, P. D., 1983 Phase transitions of binary mixtures in random media. J. Physique 44, 785–791. [22] Lewis, A. M., Harnden, V. D. & Tyree, M. T., 1994 Collapse of Water-Stress Emboli in the Tracheids of Thuja
oc-cidentalis L. Plant physiology 106,
1639–1646. ISSN 0032-0889. (doi:
10.1104/pp.106.4.1639).
[23] Kuroda, K., Kuroda, H. & Lewis, A., 2000 Detection of embolism and acous-tic emissions in tracheids under a mi-croscope: incidence in diseased trees in-fected with pine wilt. In New horizons in wood anatomy, pp. 372–377. Chon-nam National University Press, pacific edition.
[24] Wheeler, T. D. & Stroock, A. D., 2008 The transpiration of water at negative
pressures in a synthetic tree. Nature
455, 208–12. ISSN 1476-4687. (doi:
10.1038/nature07226).
[25] Mart´ınez-Vilalta, J., Cochard, H., Men-cuccini, M., Sterck, F., Herrero, A., Ko-rhonen, J. F. J., Llorens, P., Nikinmaa,
E., Nol`e, A., Poyatos, R. et al., 2009
Hy-draulic adjustment of Scots pine across Europe. New Phytologist 184, 353–364.
ISSN 1469-8137.
(doi:10.1111/j.1469-8137.2009.02954.x).
[26] Vincent, O., Marmottant, P., Quinto-Su, P. A. & Ohl, C.-D., 2012 Birth and Growth of Cavitation Bubbles within Water under Tension Confined in a
Sim-ple Synthetic Tree. Phys. Rev. Lett.
108, 184502–5. ISSN 0031-9007. (doi: 10.1103/PhysRevLett.108.184502).
[27] Vincent, O., Marmottant, P., Gonzalez-Avila, S. R., Ando, K. & Ohl, C.-D., 2014 The fast dynamics of cavitation bubbles within water confined in elastic solids. Soft Matter 10, 1455–1461. ISSN 1744-683X. (doi:10.1039/c3sm52697f).
[28] H¨oltt¨a, T., Vesala, T. & Nikinmaa, E.,
2007 A model of bubble growth leading to xylem conduit embolism. Journal of the-oretical biology 249, 111–23. ISSN 0022-5193. (doi:10.1016/j.jtbi.2007.05.033). [29] Mayr, S. & Rosner, S., 2011 Cavitation
in dehydrating xylem of Picea abies: en-ergy properties of ultrasonic emissions re-flect tracheid dimensions. Tree
physiol-ogy 31, 59–67. ISSN 1758-4469. (doi:
10.1093/treephys/tpq099).
[30] Jansen, S., Lamy, J.-B., Burlett, R.,
Cochard, H., Gasson, P. & Delzon,
S., 2012 Plasmodesmatal pores in the torus of bordered pit membranes affect cavitation resistance of conifer xylem. Plant, cell & environment 35, 1109– 20. ISSN 1365-3040. (doi:10.1111/j.1365-3040.2011.02476.x).
[31] Cochard, H., 2006 Cavitation in
trees. Comptes Rendus Physique 7,
1018–1026. ISSN 16310705. (doi:
10.1016/j.crhy.2006.10.012).
[32] Kikuta, S. B., Hietz, P. & Richter, H., 2003 Vulnerability curves from conifer sapwood sections exposed over solutions with known water potentials. Journal of experimental botany 54, 2149–55. ISSN 0022-0957. (doi:10.1093/jxb/erg216).
[33] Greenspan, L., 1977 Humidity fixed
points of binary saturated aqueous so-lutions. Journal of research of the na-tional Bureau of Standards -. Physics and Chemistry 81, 89–96.
5 Conclusion 7 50 µm top view cross-section intact tracheids hydrogel xylem wall 800 µm 50 µm 50 µm ~1 mm hydrogel slabs ~1 mm xylem wood ~5 mm (a) (b)
Fig. 1: Inclusion of wood samples in a stiff hydrogel matrix: the slices of xylem are inserted underwater in between two half-cured hydrogel slabs. (a) schematic views of the inclusion after assembly and total curing of hydrogel slabs (dashes indicated the assembly). (b) Optical observations. Above, a cross-section cut performed with a scalpel clearly shows that the hydrogel is intimately bound to the wood. Intact channels are still in contact side by side. Below: top view of the wood inclusions.
5 Conclusion 8 time (µs) Pressure (mPa) −20−20 0 20 40 60 80 −10 0 10 20 p<0 (a) (c) camera microphone wood slice hydrogel water evaporation (b) 1 mm
Fig. 2: Experimental set-up: (a) the water contained in the wood inclusion in hydrogel underwent negative pressure as water evaporates from the hydrogel. The camera installed on an optical microscope with magnification between 1.25x and 20x recorded images (b) of bubbles development (black conduits on image) in the water columns (grey on image). (c) Simultaneously the microphone monitored the ultrasonic signals.
5 Conclusion 9 (b) t0 t0 + 0.01 s t0 + 0.49 s t0 + 1.26 s (c) time (s) Bubble length ( µm) (a) 0.2 0.4 0.6 0.8 1 1.2 0 200 400 600 50 µm 50 µm ultrasound t0 t0 + 0.25 s t0 + 0.5 s t0 + 1.75 s t0 + 4.5 s
Fig. 3: (a) Bubble length as a function of time (red symbols, measured on some selected of images). The timing of the detected sound is indicated with the blue arrow. (b) Nucleation of a bubble in a conduit, recorded with a high-speed camera (1000 frames per second). The red line indicates the bubble length. (c) Air-seeding event, when a bubble nucleates near an already cavitated conduit, recorded with a 4 Hz camera. The evolution is sketched below each images, to increase the readability.
5 Conclusion 10 (a) (b) 1 mm time (seconds) 1 mm 500 1000 1500 2000 2500 3000 3500 4000 4500 5000 5500 0 10 J-14 10 J-15 10 J-13
Fig. 4: (a) ”Seismic” map, showing the location of bubbles appearance. The circle size indicates the magnitude of the acoustic energy, while color indicates apparition time. For clarity, the events after 3600 s were not shown. See also Supplementary movie 1. (b) Global map of air invasion by cavitation: color indicates the time of the filling of conduits with gas. See also Supplementary movie 2.
5 Conclusion 11 tracheids volume (µm )3 energy (J) 10 10 10 (b) −13 −14 −15 10 103 104 105 ( ) (a) 10 10 10 energy (J) microphone threshold −15 −14 −13 (d) (c) time (s) 0 2000 4000 6000 8000 10000 volume (µm 0 5 10 x 104 time (s) 0 5000 10000 ) 3 energy (J) 10 10−13 −14 −15 time (s) 0 1000 2000 3000 4000 5000 6000 10 10 10 tracheids volume (µm ) 3 4 5 3 10 10 10 energy (J) microphone threshold −15 −14 −13 volume (µm 0 5 10 x 104 time (s) 0 2000 4000 ) 3 nucleation air seeding Sample 1 Sample 2
Fig. 5: (a) Variation of the acoustic energy correlated with bubble appearance as a function of the conduit volume, in xylem. The blue squares indicate the logarithmic average in a bin whose size is specified by the horizontal blue line. The vertical blue line represents the standard deviation of the points in the bin. The grey symbols show individual events. ”Nucleations” are highlighted by dark symbols. The dashed line is a guide to the eye showing the microphone threshold. (b) Energy in the course of time. Insert: volume of each cavitating conduit in the course of time. For the figure and the insert, t = 0 s corresponds to the first acoustic event and the error bars are determined in the same way as in (a). The sample for (a) and (b) is the one presented in Fig.2 and Fig.4. (c) and (d): same graphs for a second sample.
5 Conclusion 12 8 6 4 2 −10 −12 −14 −16 1 10 10 10 10 10 10 10 10 energy (J) 3 cavity volume (µm ) 1 mm
Fig. 6: Synthetic wood consisting in spheroidal cavities in hydrogel: acoustic energy as a function of the volume of artificial cavities. A picture of the experiment is shown in insert. To calculate cavities volumes, we considered them to be spherical. The radius is deduced from the pictures where we fit an ellipse to the observed cross section of the cavities and take the mean of the two ellipse axes as the radius.
Fig. 7: Supplementary material, Movie 1. Animated version of figure 4 (a) played a hundred times faster, with cavitation sounds. The original acoustic emissions (in the ultrasound range) are slowed down (1000 x) to become audible.
Fig. 8: Supplementary material, Movie 2. Animated version of figure 4 (b), with cavitation sounds, same parameters as Movie 1.