HAL Id: hal-00328338
https://hal.archives-ouvertes.fr/hal-00328338
Submitted on 12 Jun 2003
HAL is a multi-disciplinary open access
archive for the deposit and dissemination of
sci-entific research documents, whether they are
pub-lished or not. The documents may come from
teaching and research institutions in France or
abroad, or from public or private research centers.
L’archive ouverte pluridisciplinaire HAL, est
destinée au dépôt et à la diffusion de documents
scientifiques de niveau recherche, publiés ou non,
émanant des établissements d’enseignement et de
recherche français ou étrangers, des laboratoires
publics ou privés.
Johannesburg based on mozaic aircraft data
R. D. Diab, A. Raghunandan, A. M. Thompson, V. Thouret
To cite this version:
R. D. Diab, A. Raghunandan, A. M. Thompson, V. Thouret. Classification of tropospheric ozone
pro-files over Johannesburg based on mozaic aircraft data. Atmospheric Chemistry and Physics, European
Geosciences Union, 2003, 3 (3), pp.723. �hal-00328338�
Atmos. Chem. Phys., 3, 713–723, 2003
www.atmos-chem-phys.org/acp/3/713/
Atmospheric
Chemistry
and Physics
Classification of tropospheric ozone profiles over Johannesburg
based on mozaic aircraft data
R. D. Diab1, A. Raghunandan1, A. M. Thompson2, and V. Thouret3
1University of Natal, Durban, South Africa 2NASA/GFSC, Greenbelt, Maryland, USA 3CNRS, Toulouse, France
Received: 5 December 2002 – Published in Atmos. Chem. Phys. Discuss.: 12 February 2003 Revised: 26 May 2003 – Accepted: 27 May 2003 – Published: 12 June 2003
Abstract. Each ozone profile is a unique response to the
photochemical and dynamic processes operating in the tro-posphere and hence is critical to our understanding of pro-cesses and their relative contributions to the tropospheric ozone budget. Traditionally, mean profiles, together with some measure of variability, averaged by season or year at a particular location have been presented as a climatology. However, the mean profile is difficult to interpret because of the counteracting influences present in the micro-structure. On the other hand, case study analysis, whilst revealing, only applies to isolated conditions. In a search for pattern and or-der within ozone profiles, a classification based on a cluster analysis technique has been applied in this study. Ozone pro-files are grouped according to the magnitude and altitude of ozone concentration. This technique has been tested with 56 ozone profiles at Johannesburg, South Africa, recorded by aircraft as part of the MOZAIC (Measurement of Ozone and Water Vapor aboard Airbus In-service Aircraft) program. Six distinct groups of ozone profiles have been identified and their characteristics described. The widely recognized spring maximum in tropospheric ozone is identified through the classification, but a new summertime mid-tropospheric enhancement due to the penetration of tropical air masses from continental regions in central Africa has been identi-fied. Back trajectory modeling is used to provide evidence of the different origins of ozone enhancements in each of the classes. Continental areas over central Africa are shown to be responsible for the low to mid-tropospheric enhancement in spring and the mid-tropospheric peak in summer, whereas the winter low-tropospheric enhancement is attributed to lo-cal sources. The dominance of westerly winds through the troposphere associated with the passage of a mid-latitude cy-clone gives rise to reduced ozone values.
Correspondence to: R. D. Diab
(diab@nu.ac.za)
1 Introduction
The vertical distribution of ozone is critical to our under-standing of both photochemical and dynamic processes that are operating in the atmosphere and contributing to the tropo-spheric ozone budget. Ozone in the moist boundary layer has a relatively short lifetime of the order of 2–5 days (Fishman et al., 1991), whereas ozone in the free troposphere may last for 2–3 months due to the drier atmosphere and the absence of removal mechanisms such as surface deposition (Liu et al., 1987).
At any particular location there is a large amount of day-to-day variability in the vertical structure of ozone. Not only do the altitudes and magnitudes of maxima and min-ima change but the vertical structure appears very irregular, sometimes exhibiting marked stratification, with a single or multiple peaks, and at other times exhibiting a uniform pro-file and absence of structure, indicative of a well-mixed at-mosphere.
Each ozone profile is a unique response to photochemi-cal and dynamic processes operating. Hence a study of the profile in terms of its structure, particularly the magnitude and altitudes of maxima and minima, depth of clearly de-fined layers and the vertical gradient of ozone should re-veal insights into these processes. Traditionally, mean pro-files averaged by season or year, together with some mea-sure of variability about these means, have been analyzed. Examples of studies that have focused on constructing an ozone climatology for particular locations, include Kirchhoff et al. (1991), Diab et al. (1996), Fortuin and Kelder (1998), Thouret et al. (1998a), Logan (1999) and Thompson et al. (2003). However, computation of the mean tends to obscure the profile micro-structure because of the many counteract-ing influences present in the data.
On the other hand, case study analysis has been widely used to gain an understanding of processes operating. Ex-amples in which the focus has been on dynamic processes,
particularly stratospheric-tropospheric exchange (STE) in-clude, Merrill et al. (1996), Cooper et al. (1998), Folkins et al. (1999), Randriambelo et al. (1999), Zachariasse et al. (2000), Scott and Cammas (2002) and Kim et al. (2002). Others, in which strong photochemical forcing was present, include Fujiwara et al. (1999) and Longo et al. (1999). The drawback of case study analysis is that, whilst an understand-ing of process is gained, there is little contribution to our knowledge of the frequency of occurrence of such events or of their relative importance in the overall ozone budget.
In this paper an alternative approach to the analysis of ozone profiles is adopted. Specifically, a search for pattern and order in the ozone profiles is conducted, in which the ob-jective is to develop a classification of ozone profiles, which can then inform our understanding of the processes that are operating and contributing to the vertical ozone structure.
There have been attempts by other authors to group ozone profiles in terms of certain criteria, however, none has ap-plied an objective multivariate technique as has been done in this study. For example, Newell et al. (1999), charac-terized four layer types in terms of combinations of ozone and water vapour characteristics, defined as either enhanced (+) or reduced (−). They assigned sources to each and were able to calculate the percentage occurrence of each layer type based on data from the MOZAIC (Measurement of OZone and Water Vapor by Airbus In-service AirCraft) and PEM (Pacific Exploratory Mission) programs. The layer types are defined as follows, with the percentage occurrence indicated in brackets after each type: O3+/H20+ indicative of
con-tinental pollution (11–15%); O3+/H2O− characterized by
stratospheric air (50–54%); O3−/H20+ due to convection
from the boundary layer (15–19%); and O3−/H2O−
in-dicative of subsiding air originally raised in deep convection over oceans (17–18%).
2 Data and methodology
The classification scheme in this study is developed using ozone profile data from Johannesburg, South Africa (26◦S; 28◦E) for the period 1995 to 2000. The data were derived from the MOZAIC data base, which is designed to collect experimental data on ozone and water vapor in order to im-prove our understanding of physical and chemical processes in the upper troposphere and lower stratosphere and to vali-date chemistry and transport models (Marenco et al., 1998). Ozone and water vapor sensors were installed on board five long-range commercial aircraft (Airbus A340’s) of four par-ticipating airlines. For further details, see the continuously updated web site: http://www.aero.obs-mip.fr/mozaic/
The ozone analyzer is a dual beam UV absorption instru-ment (Thermo-Electron Model 49-103), which has a detec-tion limit of 2 ppbv and a precision of 2 ppbv. Uncertainties in the measurements are estimated to be +/− (2 ppbv + 2%), although actual performance is better (Thouret et al., 1998b).
The response time of the instrument is 4 s which translates into a vertical resolution of 30 m. Full details of the calibra-tion procedures and mounting in the aircraft are also given in Thouret et al. (1998b).
During the ascent and descent of the aircraft above cities, vertical profiles are recorded. Since the aircraft ascends to or descends from a cruise altitude predefined by international air traffic regulations, the profile data extend to a maximum of 12 km. It is important to note that the aircraft does not as-cend/descend vertically above a location but that it follows a well defined flight path which can vary according to wind di-rection and may extend some 500 km in the horizontal from the destination. For the purposes of this study this variation has been ignored. Many comparisons have been drawn be-tween commercial or research aircraft and sounding or lidar measurements (such as during PEM-Tropics B). The results are always very good, at least in the troposphere (see for ex-ample, Thouret et al., 1998b).
A large number of ozone profiles were assembled for anal-ysis. Of the 516 profiles that were available for Johannesburg over the period 1995–2000, a total of 56 profiles, which had no missing data between the surface and 12 km, were finally selected for the development of the classification scheme. It was deemed preferable to use a small set of profiles in which no interpolation of data had been undertaken rather than a larger set in which data had been interpolated based on the mean.
A cluster analysis program called TWINSPAN (Two-Way
Indicator Species Analysis) (Hill, 1979), that is often used in
ecological applications to classify plant communities on the basis of species composition, was used. In vegetation studies, the samples are differentiated on the basis of species compo-sition and abundance. In our study, each ozone profile was considered as a sample, and the ozone concentrations at uni-form 150 m intervals of altitude were analogous to species abundance. TWINSPAN makes no assumptions about nor-mality of data and it operates in a divisive manner such that all of the samples are dichotomously divided into groups on the basis of their similarity in species composition. Divi-sions higher up in the hierarchy are thus more meaningful than those lower down. The idea was to group ozone profiles according to the magnitude and altitude of ozone concentra-tion in a profile. Although a wide variety of cluster analysis techniques are available, TWINSPAN was deemed appro-priate as the classification divisions are based on indicator species, defined as those that occur in more than 80% of the samples of one group and less than 20% of the other group (Hill, 1979). Analogous to indicator species are the presence of ozone peaks at certain altitudes in this application. It is thus expected that similarities in altitudes and magnitudes of ozone peaks would group profiles together. TWINSPAN is a divisive rather than an agglomerative clustering method and as such the n samples (profiles) are divided successively into a hierarchy of smaller and smaller clusters until finally each cluster contains only one sample or a user-specified small
R. D. Diab et al.: Classification of tropospheric ozone profiles 715 56 0.104 0.065 0.037 0.064 0.063 1 2 3 Level of Division 3a n=6-3b n=9+ 3c n=18-3d n=9+ 2a n=15-2b n=27+ 1a n=42-2c n=9-2d n=5+ 1b n=14+
Figure 1
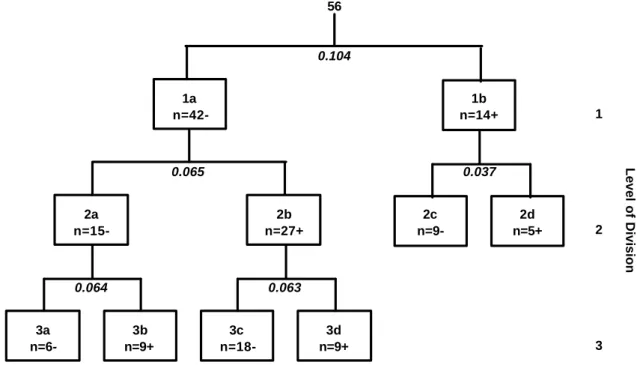
Fig. 1. Dendrogram showing the hierarchical classification of ozone profiles derived from the TWINSPAN cluster analysis for the first three levels of division. The number of profiles is indicated by n, with positive and negative signs being used to distinguish the dichotomous groups. Eigenvalues are given in italics. The categories are labeled as 1a, 1b... up to 3d. Only the final categories are named as follows: 3a = single mid-tropospheric peak; 3b = steady tropospheric increase; 3c = reduced tropospheric ozone; 3d = lower tropospheric enhancement; 2c = pronounced layering; 2d = considerable tropospheric enhancement.
number of samples. Alternatively, division can be terminated after a certain number of levels of division, once again spec-ified by the user.
In our study, the output was analyzed after three lev-els of division, since further subdivision represented minor, less meaningful divisions. The extent of similarity between groups is provided by the eigenvalue, which ranges between 0 and 1. A low value indicates a high degree of similarity between groups and an eigenvalue closer to 1 indicates a low degree of similarity.
Back trajectory modelling was undertaken using the Hybrid Single-Particle Integrated Trajectory (HYSPLIT) model, which was jointly developed by the National Oceanic and Atmospheric Administration (NOAA) and modified by the Australian Bureau of Meteorology (Draxler, 1998). The meteorological fields used in the HYSPLIT model were four dimensional gridded fields from the National Centre for En-vironmental Prediction (NCEP). For this study, 5-day back trajectories were initialised at four standard heights (2.5, 5, 7.5 and 10 km), except for minor modifications in the mid-troposphere to take account of observed ozone peaks on par-ticular days. Specifically, for categories 2c and 3d the 5 km height was replaced by 6 and 4 km respectively, and for cate-gory 3c, the 7.5 km height was replaced by 8 km. All trajec-tories were initialised at Johannesburg rather than the actual aircraft location. The influence of this difference in location on individual back trajectories is balanced by a consideration
of general indications of source regions based on multiple back trajectories in a group rather than results of an individ-ual case study.
3 Results
The breakdown of ozone profiles into classes is summarized by means of the dendrogram presented in Fig. 1. The first level of division was characterized by one group of 42 pro-files (Group 1a), which exhibit generally low ozone values (<40 ppbv) in the lower troposphere (below ∼4 km), com-pared with the second group of 14 profiles (Group 1b) where ozone was above 40 ppbv at the surface and ∼70 ppbv in the lower troposphere. Clearly, this first division delineates the spring ozone profiles from those in other seasons, since in the second group, all but two of the profiles were recorded in spring when surface based emissions are known to max-imise in this region (Justice et al., 1996; Scholes and An-dreae, 2000). There is also a marked distinction between the two groups at higher altitudes in the troposphere. Mid-tropospheric peaks extend to 100 ppbv in the spring group (Group 1b), yet seldom exceed 70 ppbv in the first group (Group 1a). Similarly, there is an increasing trend in ozone in the upper troposphere near the tropopause in the spring group (Group 1b) and a generally decreasing trend in the for-mer group (Group 1a).
0 4 8 12 0 10 20 30 40 50 60 70 80 90 100 110 120 Ozone (ppbv) Altitude (km) 0 4 8 12 0 10 20 30 40 50 60 70 80 90 100 110 120 Ozone (ppbv) Altitude (km) 0 4 8 12 0 10 20 30 40 50 60 70 80 90 100 110 120 Ozone (ppbv) Altitude (km) 0 4 8 12 0 10 20 30 40 50 60 70 80 90 100 110 120 Ozone (ppbv) Altitude (km) 0 4 8 12 0 10 20 30 40 50 60 70 80 90 100 110 120 Ozone (ppbv) Altitude (km) 0 4 8 12 0 10 20 30 40 50 60 70 80 90 100 110 120 Ozone (ppbv) Altitude (km)
Single mid-tropospheric peak Steady tropospheric increase
Lower tropospheric enhancement Reduced tropospheric ozone
Pronounced layering Considerable tropospheric enhancement
Figure 2
Fig. 2. Mean (solid line) and individual values at 150 m height intervals (dots) for ozone profiles in 6 categories derived from the cluster analysis.
At the second level of division, the first group (Group 1a) was divided further into one group of 15 (Group 2a) and a second of 27 profiles (Group 2b). The former is associated with a generally increasing trend throughout the lower to mid-troposphere and an enhancement above 8 km, whereas in the second group there is no clear evidence of an enhance-ment. The spring group of the first level (Group 1b) is now
separated into one group of 9 profiles (Group 2c) that is char-acterized by a distinct layering pattern, with narrow peaks separated by bands of lower ozone. The smaller group of 5 profiles (Group 2d) is characterized by a very steep gradi-ent from the surface to just less than 3 km, where values are ∼80 ppbv and then a fairly uniform distribution throughout the troposphere with values consistently between 70–90 ppbv
R. D. Diab et al.: Classification of tropospheric ozone profiles 717 and the absence of marked stratification in the profile.
Al-though these latter two groups were subdivided beyond the second level of division, the eigenvalues dropped to fairly low values and so subsequent division was not regarded as meaningful.
The final classification selected for analysis consists of 6 categories, which are defined as follows: single mid-tropospheric peak (3a); steady mid-tropospheric increase (3b); re-duced tropospheric ozone (3c); lower tropospheric enhance-ment (3d); pronounced layering (2c) and considerable tropo-spheric enhancement (2d). The figures in brackets after each of the subheadings that follow indicate the number of profiles in each category.
3.1 Single mid-tropospheric peak (6)
The mean ozone profile of this category, together with the values for individual profiles at each 150 m height interval, is illustrated in Fig. 2a. This is a typical Southern Hemi-sphere summer pattern, in which near-surface ozone values are low, sometimes close to zero, indicative of ozone destruc-tion in the moist boundary layer. Relative humidity values of up to 90% in individual humidity profiles (not shown) provide evidence of high moisture contents. A single well-defined, broad mid-tropospheric ozone maximum is centred at 6–8 km, where peak values of 80–100 ppbv are recorded. The mean value of this maximum is 70 ppbv. Above this maximum is a layer of relatively lower ozone in which val-ues steadily decrease from the peak to valval-ues of ∼45 ppbv at 12 km. The reduced ozone here is most likely the result of convective outflow of ozone-poor air lifted from the bound-ary layer. It also reflects the high position of the tropopause at this time of year and the consequent absence of the steep ozone increase expected in the vicinity of the tropopause. The one exception in which high ozone values are evident around 12 km (Fig. 2a), belongs to a winter profile, the only one in the group, and is indicative of a lower tropopause po-sition at this time of year and the penetration of relatively higher stratospheric ozone to these altitudes.
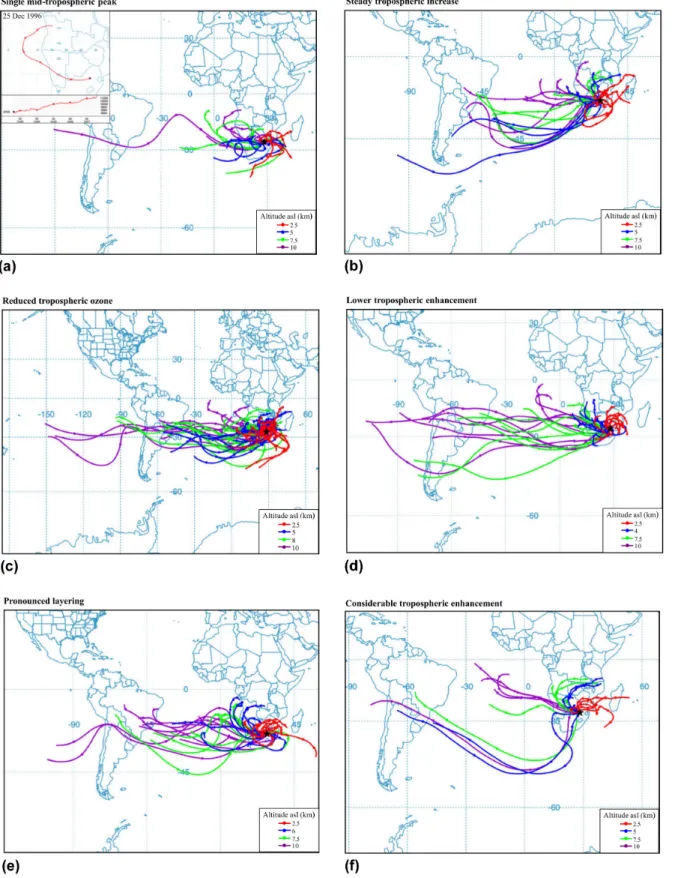
Results of 5-day back trajectory modelling for all days within this group are overlaid and depicted in Fig. 3a. Near-surface transport (back trajectory initialised at an altitude of 2.5 km) is from the northern and eastern sectors (red tra-jectories) and is associated with anticyclonic circulation of moist maritime air. Trajectories generally originated over the Indian Ocean between the north-east and south-east, thus accounting for the high relative humidities recorded on these days and the low near-surface ozone values. Mid-tropospheric transport between 5 and 7.5 km (blue and green trajectories) was generally out of the west, although in two of the cases, easterly transport extended upwards from the sur-face. The most distinguishing feature of this group is the de-scending movement of air in the upper troposphere (evident in the vertical cross section insert in Fig. 3a for a particular case study) in a spiralling anticyclonic circulation, with
tra-jectories generally originating over continental areas to the north rather than from the west. In one case, air originated over the Democratic Republic of the Congo and descended from approximately 12 km to 8.7 km, most likely being re-sponsible for the long-range transport of ozone-rich air from African countries to the north of Johannesburg. Strong sum-mer convective activity in the lower latitudes would be able to mix surface generated ozone precursors (possibly from biomass burning which is known to exist at this time of year (Hao et al., 1996) to higher altitudes where ozone has a longer lifetime (Liu et al., 1987). Coupled with convec-tive enhancement (Pickering et al., 1990; 1992; 1993) this would account for the relatively high ozone air transported southwards.
3.2 Steady tropospheric increase (9)
The absence of a single well-defined peak, but a generally increasing trend in ozone, with individual profiles character-ized by the presence of multiple laminae of the order of 5– 15 ppbv in magnitude and at variable altitudes, characterize this group (Fig. 2b). Most of the profiles in this category oc-cur in summer (7), with 2 in spring. An example of a typical individual ozone profile (23 December 1995), which clearly depicts the layered structure is plotted in Fig. 4, together with the corresponding relative humidity profile. Similar laminar structures have been detected by Newell et al. (1999), who noted that they varied in thickness from 0.5–1.3 km and oc-curred at altitudes ranging between 5.5 and 6.6 km. They suggested that such features originated from upward motion and subsequent lateral spreading associated with deep con-vection.
The distinguishing feature of this group in terms of the source region of air masses is that most of the mid- to upper-tropospheric (5–10 km) trajectories originate from the south-west over the Atlantic Ocean. There is evidence of rela-tively light winds over the subcontinent and stronger westerly winds over the Atlantic Ocean. The origin of near-surface air (red trajectories) is variable. Generally, winds are out of the east but may also be of continental origin, which accounts for the considerable variability indicated in near-surface ozone (Fig. 2b).
3.3 Reduced tropospheric ozone (18)
This is the largest group of profiles and consequently does not display the coherence of other groups, evidenced by the relatively large spread of values about the mean (Fig. 2c). Distinguishing features are the generally low ozone levels throughout the troposphere. In the mean profile, values lie below 50 ppbv. The mean profile displays a shallow near-surface enhancement (38 ppbv) up to 3 km, relatively low values (∼30 ppbv) between 3 and 5 km and a second broader mid-tropospheric enhancement between 5–8 km. Generally, the low level ozone values do not exceed 50 ppbv, but there
Fig. 3. Five-day back trajectory HYSPLIT model results for (a) single mid-tropospheric peak category; (b) steady tropospheric increase; (c) reduced tropospheric ozone; (d) lower tropospheric enhancement; (e) pronounced layering; (f) considerable tropospheric enhancement. Trajectories originating at 2.5 km are red, 5 km blue, 7.5 km, green and 10 km purple. The insert in a) shows the results of the 10 km back trajectory and vertical cross section for 25 December 1996.
R. D. Diab et al.: Classification of tropospheric ozone profiles 719 0 4 8 12 0 10 20 30 40 50 60 70 80 90 100 110 120 Ozone (ppbv) Relative humidity (%) Altitude (km) Figure 4
Fig. 4. Vertical distribution of ozone (ppbv) and relative humidity (%) at Johannesburg for 23 December 1995.
are two cases where this maximum is more pronounced. An-other distinguishing feature of this group is the generally increasing ozone trend in the upper troposphere, reflecting the lower winter position of the tropopause and the possi-ble penetration of stratospheric air to lower levels. Most of these profiles (16) occur in either autumn or winter, when the northward displacement of the mean subtropical anticyclones permits the invasion of westerly winds through a deep layer of the atmosphere over southern Africa to a greater extent than at other times of the year.
Back trajectory modelling reveals the dominance of west-erly airflow throughout the troposphere (Fig. 3c). The mar-itime origin of air over the Atlantic Ocean is responsible for the relatively low ozone values in these cases. At times, the low level origin of air masses (red trajectories) is from the south-east rather than the west, representing flow to the rear of the mid-latitude frontal system, but its maritime origin again gives rise to low ozone values. In a few cases, the low-level origin of air is over Africa (predominantly Botswana and Zimbabwe), however, the lack of significant biomass burning emissions during the autumn and winter seasons ac-count for the comparatively low ozone levels.
3.4 Lower tropospheric enhancement (9)
The distinctive feature of this group is the presence of a lower tropospheric enhancement, where the mean ozone value is above 50 ppbv, accompanied by a deep layer in the mid-troposphere (5–8 km) of relatively lower ozone values. In-dividual profiles show lower tropospheric values in excess of 70 ppbv (Fig. 2d). The peak is generally confined below 5 km, which coincides with the height of the persistent and ubiquitous absolutely stable layer which has been described by Cosijn and Tyson (1996) and which is recognized as
be-ing a significant influence on the vertical distribution of trace gases and aerosols over southern Africa (Tyson et al., 1997). Essentially it inhibits vertical mixing and confines boundary layer photochemically-generated ozone to the lower tropo-sphere. Most of the profiles in this group occur in autumn or winter when the absolutely stable layer is most pronounced, but there are 1 or 2 profiles from each of the other seasons.
Back-trajectory modelling confirms the presence of a strong discontinuity in the atmosphere (Fig. 3d). Below 5 km there is evidence of anticyclonic recirculation and light winds (red trajectories), which are responsible for the build-up of lower tropospheric ozone (Fig. 2d). Above 5 km air parcels have been advected in strong westerly flow from the Atlantic Ocean, bringing clean maritime air to the mid-troposphere over Johannesburg (blue, green and purple trajectories in Fig. 3d). The increasing ozone between 9 and 12 km most likely reflects the lower altitude of the winter tropopause and the possible penetration of stratospheric air to lower levels (Fig. 2d).
3.5 Pronounced layering (9)
All these profiles display pronounced stratification, with ozone differing by ∼50 ppbv within a few hundred metres. Peaks are high, up to 110 ppbv, but are narrow and variable in height. There is considerable variation about the mean de-picted in Fig. 2e, which obscures the marked layering evident in individual profiles. All, except 2 profiles, occur in spring when tropospheric ozone values are known to be highest (for example Diab et al., 1996; Thompson et al., 1996).
Back trajectory modelling (Fig. 3e) reveals that the ori-gin of air masses throughout the lower and mid-troposphere (up to 5 km) is predominantly continental and to the north of Johannesburg (red and blue trajectories). Only in the upper troposphere (back trajectories originating at 7.5 and 10 km) is the source region from the west, with air masses character-ized by cleaner maritime air (green and purple trajectories). 3.6 Considerable tropospheric enhancement (5)
The final group of spring profiles displays a sharp increase in ozone from the surface to 2.5 km, and then elevated ozone values, of the order of 80–100 ppbv, throughout the tropo-sphere (Fig. 2f). There is relatively little deviation about these mean values. It is anticipated that these would be the days of highest total tropospheric ozone (TTO) and indeed, TTO, estimated by integrating ozone profiles between the surface and 12 km, ranged between 35.7 and 39.3 DU and included some of the highest values recorded.
Movement of air generally of continental origin in a large anticyclonic gyre over the subcontinent is responsible for the high ozone values recorded. Figure 3f displays the composite results of back trajectory modelling for this category. Trajec-tories frequently originate north of 15◦S over locations which are widely acknowledged as key biomass burning regions at
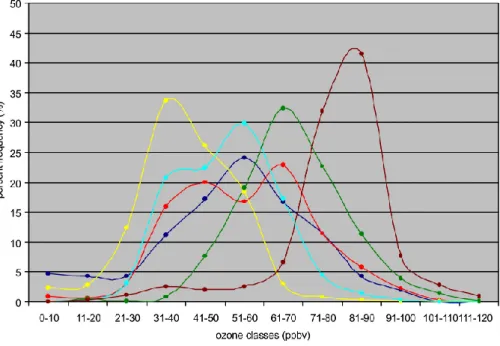
Fig. 5. Frequency distribution of ozone values within each of the 6 defined profile categories. Dark blue = single mid-tropospheric peak; red = steady tropospheric increase; yellow = reduced tropospheric ozone; light blue = lower tropospheric enhancement; green = pronounced layering; brown = considerable tropospheric enhancement.
this time of year. Only at the highest level (10 km) is there evidence of the dominance of westerly flow (purple trajecto-ries).
4 Analysis
The marked differences between groups are highlighted by ozone frequency distributions within each group (Fig. 5). Here ozone values (at 150 m height intervals) from individ-ual profiles within each group have been binned into ozone classes, defined in intervals of 10 ppbv ranging from 0 to 120 ppbv, and expressed as percent frequencies.
Group 1 (single mid-tropospheric peak) is characterized by a broad unimodal distribution, with most of the ozone values lying between 51–60 ppbv. It also has a relatively higher frequency of very low values (<30 ppbv) than other groups, due to near-surface destruction of ozone. Groups 2 (steady tropospheric increase) and 4 (lower tropospheric enhancement) display similar frequency distributions with modal classes of 61–70 ppbv and 51–60 ppbv respectively. The third group (reduced tropospheric ozone) exhibits a fre-quency shift to lower ozone values (31–40 ppbv) and very few values (4.4%) above 60 ppbv. Groups 5 (pronounced layering) and 6 (considerable tropospheric enhancement) ex-hibit a frequency shift to higher ozone values and have modal classes of 61–70 and 81–90 ppbv respectively, reflecting the springtime ozone enhancement. They are also characterized by low frequencies at the lower end of the scale. In group 6, less than 9% of the ozone values lie below 60 ppbv.
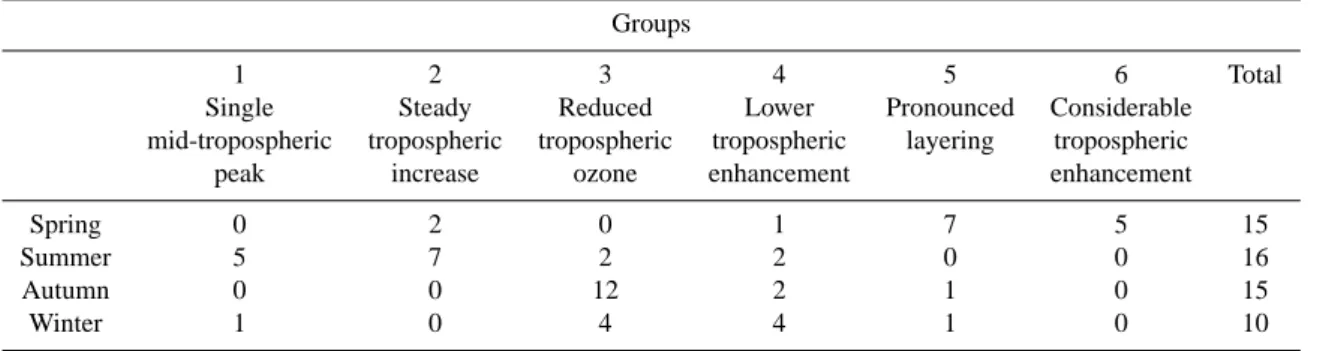
The classification has clearly emphasized the pronounced seasonality of ozone profiles (Table 1). Although there is some spread among groups it is evident that seasons are dom-inated by particular patterns and by inference, the processes and transport patterns that shape the individual profiles are seasonally dependent. Spring is characterized by either “pro-nounced layering” or “considerable tropospheric enhance-ment”, indicative of strong photochemical production from biomass burning and biogenic sources in this season. Sum-mer profiles exhibit a “mid-tropospheric peak” when upper air masses originate from continental areas to the north in-dicative of southward penetration of the Inter-Tropical Con-vergence Zone (ITCZ), or a “steady tropospheric increase” when the troposphere is characterized by predominantly westerly flow that originates over the Atlantic Ocean. Au-tumn profiles fall predominantly into the “reduced tropo-spheric ozone” group caused by the dominance of westerly flow throughout the troposphere. Winter profiles are spread between “reduced tropospheric ozone” and the category with a “lower tropospheric enhancement”. It is widely known that spring is the season when tropospheric ozone maximizes as has been confirmed in this study. However, the equally high, summer mid-tropospheric peak as typified by the first cate-gory has not been previously identified over southern Africa. The mid-tropospheric peak and its trajectory origins may cor-respond to the region of high mid-tropospheric ozone during summer observed by Thompson et al. (2000) over the South Atlantic between 5–20◦S. In an investigation of TTO, these cases would not have emerged as particularly high TTO days
R. D. Diab et al.: Classification of tropospheric ozone profiles 721
Table 1. Distribution of cases within each ozone profile group by season Groups
1 2 3 4 5 6 Total
Single Steady Reduced Lower Pronounced Considerable
mid-tropospheric tropospheric tropospheric tropospheric layering tropospheric
peak increase ozone enhancement enhancement
Spring 0 2 0 1 7 5 15
Summer 5 7 2 2 0 0 16
Autumn 0 0 12 2 1 0 15
Winter 1 0 4 4 1 0 10
because of the counteracting influence of the very low near-surface ozone. Furthermore, summer is dominated by two patterns, viz. groups 1 and 2, and hence a study of mean seasonal profiles would have failed to reveal this particular pattern.
Johannesburg is a key location for an analysis of ozone profiles since its latitude is intermediate between tropical and mid-latitude meteorological regimes. Depending on the lat-itudinal position of the large scale pressure systems, so Jo-hannesburg is dominated by circulation patterns characteris-tic of either mid-latitude or tropical latitudes. Thus, summer is dominated by tropical influences as the easterly waves and the ITCZ penetrate further south over the subcontinent, and winter by mid-latitude influences as the westerlies penetrate further north, particularly in the upper troposphere. Similar trends are also present at Irene (25.25◦S; 28.22◦E), which was noted by Thompson et al. (2003) to differ from other ozonesonde stations in the SHADOZ (Southern Hemisphere Additional Ozonesondes) network in that it did not always experience a typical tropical climate.
This conclusion has important implications for the com-putation of trends based on mean profiles at these interme-diate latitudes. The mean comprises a mix of tropical and mid-latitude regimes, which are likely to differ in relative contribution from year to year as a function of dynamic fac-tors, such as the latitudinal position of the jet stream. Similar findings have been noted by Hudson et al. (2003). The me-teorological regimes in turn may be characterized by differ-ent trends due to differdiffer-ent anthropogenic activities in tropi-cal and mid-latitude regions. Hence it is suggested that for stations on the boundaries of zonally defined meteorological regimes that the computation of a mean profile and further-more, extrapolation of trends based on a mean profile is not statistically justified.
The classification has also revealed that trans-boundary sources make a significant contribution to tropospheric ozone enhancement observed at Johannesburg. Table 2 summa-rizes the source regions for each category as a function of atmospheric layer. The observed springtime enhancements are linked to transport of air from continental areas to the
north of Johannesburg. Likewise, the summertime mid-tropospheric peak is associated with long-range transport of air from central Africa in an anticyclonic circulation. The only peak that appears to be of local origin is that of the “lower tropospheric enhancement” group, in which local an-ticyclonic circulation is responsible for the low level build-up of ozone beneath the persistent 5 km absolutely stable layer. Maritime air masses advected in the westerlies generally give rise to relatively lower ozone values. This is particularly ev-ident in the “reduced tropospheric” ozone category, where westerly winds prevail throughout the troposphere.
5 Conclusions
The classification of ozone profiles using a multivariate clus-ter analysis technique known as TWINSPAN has permit-ted the identification of 6 categories, each of which pos-sesses distinct attributes. Relating the profiles to the origin of air masses through back trajectory modeling has revealed clearly defined source regions. Continental areas over cen-tral Africa and long distance transport are source regions for the tropospheric peak in summer and the low to mid-tropospheric enhancement in spring, whereas the winter low tropospheric enhancement is attributed to local sources. The dominance of westerly winds through the troposphere gives rise to reduced ozone values. This investigation has empha-sized the pronounced seasonality of tropospheric ozone verti-cal distribution suggesting that there are distinct tropiverti-cal and mid-latitude influences which give rise to different vertical structures. Drawbacks of focusing on mean profiles when estimating trends are highlighted.
The widely recognized spring maximum in tropospheric ozone has been endorsed in this classification, but a new sum-mertime mid-tropospheric enhancement due to the penetra-tion of tropical air masses from continental regions in central Africa has been identified.
Acknowledgements. RDD and AR acknowledge funding from NRF, Pretoria and the University of Natal Research Fund. AMT ac-knowledges support from the NASA ACMAP and TOMS projects. The Fulbright Commission enabled RD to undertake an extended
Table 2. Source regions of air masses associated with each ozone profile category as a function of height
Category Near-surface Mid-troposphere Mid-troposphere Upper troposphere Dominant
(2.5 km) (5 km) (7.5 km) (10 km) season
1. Mid- East-Indian Ocean West West North-continental Africa Summer
tropospheric peak
2. Steady Variable, generally east West West West Summer
tropospheric increase
3. Reduced West West West West Autumn
tropospheric ozone
4. Lower Local, continental West West West Winter
tropospheric enhancement
5. Pronounced North-continental Africa North-continentalAfrica West West Spring
layering
6. Considerable North-continental Africa North-continental Africa North-continental Africa West Spring
tropospheric enhancement
visit to the United States, which facilitated this collaboration. ES-SIC at the University of Maryland is thanked for their hospitality during this period. Funding from a Franco-South African research grant facilitated co-operation between RD and VT. We acknowl-edge the essential support of airlines participating in the MOZAIC program (Air France, Lufthansa, Austrian Airlines and Sabena).
References
Cooper, O. R., Moody, J. L., Davenport, J. C., Oltmans, S. J., John-son, B. J., Chen, X., ShepJohn-son, P. B., and Merrill, J. T.: Influ-ence of springtime weather systems on vertical ozone distribu-tions over three North American sites, Journal of Geophysical Research, 103 (D17), 22 001–22 013, 1998.
Cosijn, C. and Tyson, P. D.: Stable discontinuities in the atmosphere over South Africa, South African Journal of Science, 92, 381– 386, 1996.
Diab, R. D., Thompson, A. M., Zunckel, M., Coetzee, G. J. R., Combrink, J., Bodeker, G. E., Fishman, J., Sokolic, F., McNa-mara, D. P., Archer, C. B., and Nganga, D.: Vertical ozone dis-tribution over southern Africa and adjacent oceans during SA-FARI92, Journal of Geophysical Research, 101 (D19), 23 823– 23 833, 1996.
Draxler, R. R.: An overview of HYSPLIT-4 modelling system for trajectories, dispersion and deposition, Australian Meteorologi-cal Magazine, 47, 295–308, 1998.
Fishman, J., Fakhruzzaman, K., Cros, B., and Nganga, D.: Iden-tification of widespread pollution in the Southern Hemisphere deduced from satellite analyses, Science, 252, 1693–1696, 1991. Folkins, I., Loewenstein, M., Podolske, J., Oltmans, S. J., and Prof-itt, M.: A barrier to vertical mixing at 14 km in the tropics: Ev-idence from ozonesondes and aircraft observations, Journal of Geophysical Research, 104, 22 095–22 102, 1999.
Fortuin, J. P. F. and Kelder, H.: An ozone climatology based on ozonesonde and satellite measurement, Journal of Geophysical Research, 105 (D24), 31 709–31 734, 1998.
Fujiwara, M., Kita, K., Ogawa, T., Kawakami, S., Sana, T., Ko-mala, N., Saraspriya, S., and Suripto, A.: Tropospheric ozone enhancements during the Indonesian forest fire events in 1994 and in 1997 as revealed by ground-based observations, Geophys-ical Research Letters, 26 (16), 2417–2420, 1999.
Hill, M. O.: TWINSPAN-A FORTRAN Program for Arranging Multivariate Data in an Ordered Two-Way Table by Classifica-tion of the Individuals and Attributes, Cornell University, Ithaca, New York, 1979.
Hudson, R. D., Frolov, A. D., Andrade, M. F., and Follette, M. B.: The total ozone field separated into meteorological regimes. 1. Defining the Regimes, Journal of Atmospheric Science, in press, 2003.
Justice, C. O., Kendall, J. D., Dowty, P. R., and Scholes, R. J.: Satel-lite remote sensing of fires during the SAFARI campaign using NOAA advanced very high resolution radiometer data, Journal of Geophysical Research, 101 (D19), 23 851–23 863, 1996. Kim, Y. K., Lee, H. W., Park, J. K., and Moon, Y. S.: The
stratosphere-troposphere exchange of ozone and aerosols over Korea, Atmospheric Environment, 36, 449–463, 2002.
Kirchhoff, V. W. J. H., Barnes, R. A., and Torres, A. L.: Ozone cli-matology at Natal, Brazil, from in situ ozonesonde data, Journal of Geophysical Research, 96 (D6), 10 899–10 909, 1991. Liu, S. C., Trainer, M., Fehsenfeld, F. C., Parrish, D. D., Williams,
E. J., Fahey, D. W., Hubler, G., and Murphy, P. C.: Ozone pro-duction in the rural troposphere and implications for regional and global ozone distributions, Journal of Geophysical Research, 92, 10 463–10 482, 1987.
Logan, J. A.: An analysis of ozonesonde data for the troposphere: Recommendations for testing 3 D models and development of gridded climatology for tropospheric ozone, Journal of Geophys-ical Research, 104 (D13), 16 115–16 149, 1999.
R. D. Diab et al.: Classification of tropospheric ozone profiles 723 Longo, K. M., Thompson, A. M., Kirchoff, V. W. J. H., Remer,
L. A., de Freitas, S. R., Silva Dias, M. A. F., Artaxo, P., Hart, W., Spinhirne, J. D., and Yamasoe, M. A.: Correlation be-tween smoke and tropospheric ozone concentration in Cuiaba during Smoke, Clouds, and Radiation-Brazil (SCAR-B), Journal of Geophysical Research, 104 (D10), 12 113–12 129, 1999. Marenco, A., Thouret, V., N´ed´elec, P., Smit, H., Helten, M., Kley,
D., Karcher, F., Simon, P., Law, K., Pyle, J., Poschmann, G., Von Wrede, R., Hume, C., and Cook, T.: Measurement of ozone and water vapor by Airbus in-service aircraft: The MOZAIC air-borne program, an overview, Journal of Geophysical Research, 103 (D19), 25 631–25 642, 1998.
Merrill, J. T., Moody, J. L., Oltmans, S. J., and Levy II, H.: Mete-orological analysis of tropospheric ozone profiles at Bermuda, Journal of Geophysical Research, 101(D22) 29 201–29 211, 1996.
Newell, R. E., Thouret, V., Cho, J. Y. N., Stoller, P., Marenco, A., and Smit, H. G.: Ubiquity of quasi-horizontal layers in the tro-posphere, Nature, 398, 316–319, 1999.
Pickering, K. E., Thompson, A. M., Dickerson, R. R., Luke, W. T., McNamara, D. P., Greenberg, J. P., and Zimmerman, P. R.: Model calculations of tropospheric ozone production potential following observed convective events, Journal of Geophysical Research, 95 (D9), 14 049–14 062, 1990.
Pickering, K. E., Thompson, A. M., Scala, J. R., Tao, W. K., and Simpson, J.: Ozone production potential following convective redistribution of biomass burning emissions, Journal of Atmo-spheric Chemistry, 14, 297–313, 1992.
Pickering, K., Thompson, A. M., Tao, W. K., and Kucsera, T.: Up-per tropospheric ozone production following mesoscale convec-tion during STEP/EMEX, Journal of Geophysical Research, 98 (D5), 8737–8749, 1993.
Ramdriambelo, T., Baray, J. L., Baldy, S., Bremaud, P., and Caut-enet, S.: A case study of extreme tropospheric ozone contamina-tion in the tropics using in-situ, satellite and meteorological data, Geophysical Research Letters, 26 (9), 1287–1290, 1999. Scholes, M. and Andreae, M. O.: Biogenic and pyrogenic emissions
from Africa and their impact on the global atmosphere, Ambio, 29 (1), 23–29, 2000.
Scott, R. and Cammas, J.-P.: Wave breaking and mixing at the sub-tropical tropopause, Journal of Atmospheric Sciences, 59 (15), 2347–2361, 2002
Thouret, V., Marenco, A., N´ed´elec, P., and Grouhel, C.: Ozone cli-matologies at 9–12 km altitude as seen by the MOZAIC airborne program between September 1994 and August 1996, Journal of Geophysical Research, 103 (D19), 25 653–25 679, 1998a. Thouret, V., Marenco, A., Logan, J. A., N´ed´elec, P., and Grouhel,
C.: Comparison of ozone measurements from MOZAIC airborne program and the ozone sounding network at eight locations, Jour-nal of Geophysical Research, 103 (D19), 25 695–25 720, 1998b. Thompson, A. M., Diab, R. D., Bodeker, G. E., Zunckel, M., Coet-zee, G. J. R., Archer, C. B., McNamara, D. P., Pickering, K. E., Combrink, J., Fishman, J., and Nganga, D.: Ozone over south-ern Africa during SAFARI-92/TRACE A, Journal of Geophysi-cal Research, 101 (D19), 23 793–23 807, 1996.
Thompson, A. M., Doddridge, B. G., Witte, J. C., Hudson, R. D., Luke, W. T., Johnson, J. E., Johnson, B. J., Oltmans, S. J., and Weller, R.: A tropical Atlantic paradox: shipboard and satellite views of a tropospheric ozone maximum and wave-one in January–February 1999, Geophysical Research Letters, 27, 3317–3320, 2000.
Thompson, A. M., Witte, J. C., Oltmans, S. J., Schmidlin, F. J., Logan, J. A., Fujiwara, M., Kirchhoff, V. W. J. H., Posny, F., Co-etzee, G., Hoeger, B., Kawakami, S., and Ogawa, T.: The 1998– 2000 SHADOZ (Southern Hemisphere Additional Ozonesondes) tropical ozone climatology. 2. Tropospheric variability and the zonal wave-one, Journal of Geophysical Research, 108 (D2), 8241, doi: 10.1029/2002JD002241, 2003.
Tyson, P. D., Garstang, M., Thompson, A. M., Diab, R. D., Brow-ell, E. V., and D’Abreton, P. C.: Correspondence between ozone measurements, transport and production of ozone over south cen-tral Africa, Journal of Geophysical Research, 102 (D9), 10 623– 10 636, 1997.
Zachariasse, M., van Velthoven, P. F. J., Smit, H. G. J., Lelieveld, J., Mandal, T. K., and Kelder, H.: Influence of stratospheric tropo-spheric exchange on tropopsheric ozone over the tropical Indian Ocean during the winter monsoon, Journal of Geophysical Re-search, 105 (D12), 15 403–15 416, 2000.