Decision Support Model and Visualization for Assessing
Environmental Phenomena, Ecosystem Services, Policy
Consequences, and Satellite Design Using Earth Observation Data
The MIT Faculty has made this article openly available.
Please share
how this access benefits you. Your story matters.
Citation
Reid, Jack B. and Danielle Wood."Decision Support Model and
Visualization for Assessing Environmental Phenomena, Ecosystem
Services, Policy Consequences, and Satellite Design Using Earth
Observation Data." AIAA ASCEND 2020, Virtual, American Institute
of Aeronautics and Astronautics, November 2020. © 2020 The
Authors
As Published
http://dx.doi.org/https://doi.org/10.2514/6.2020-4181
Publisher
American Institute of Aeronautics and Astronautics
Version
Author's final manuscript
Citable link
https://hdl.handle.net/1721.1/128378
Terms of Use
Creative Commons Attribution-Noncommercial-Share Alike
Decision Support Model and Visualization for Assessing
Environmental Phenomena, Ecosystem Services, Policy
Consequences, and Satellite Design Using Earth Observation
Data
Jack B. Reid∗and Danielle Wood†
Massachusetts Institute of Technology, Cambridge, MA, 01239
With the increasing availability of Earth Observation (EO) data has come a commensu-rate rise in EO applications. To address the dual needs of processing data for applications and designing missions with applications in mind, we present a multi-disciplinary, integrated modeling framework to advance environmental management, policymaking, and observation platform design. This core modeling framework is called Environment-Vulnerability-Decision-Technology (EVDT). EVDT is not the model itself, it is the framework that guides the creation
of an integrated model customized to each application with a specific set of stakeholders in mind and designed using Systems Architecture. The EVDT framework can be customized to build integrated models specific to a certain application. Individual models in the framework include certain core models (Environment, Vulnerability, Decision, Technology) and optional models such as Public Health which are added when needed for a specific application. The Envi-ronment Model uses earth science methods to estimate the state of enviEnvi-ronmental phenomena; The Vulnerability Model captures societal impact of environmental changes including ecosys-tem services; the Decision Model captures human behavior and policy consequences; and the Technology Model provides tools to design earth observation systems or select among earth observation technologies such as satellites, airborne sensors, and in-situ sensors. The intent in developing this framework and its applications is to lead to the development of a standard to facilitate the re-use of models and the design of future remote observation systems. The presented prototype specifically focuses on two case studies. The first case study considers the dynamics of human and environmental behavior related to the mangrove forests in the Guarat-iba area of Rio de Janeiro. The second case study considers the relevancy of this framework in approaching coronavirus-related public health decisions in Rio de Janeiro, Santiago, and elsewhere.
I. Nomenclature
𝑁 𝐷𝑉 𝐼 = Normalized Difference Vegetation Index at a given location 𝑁 𝐼 𝑅 = Near Infrared surface reflectance at a given location 𝑅 𝑒 𝑑 = Red surface reflectance at a given location
𝐴𝑛𝑜𝑚 𝑎𝑙 𝑦 = NDVI mean anomaly at a particular geographic pixel 𝑁 𝐷𝑉 𝐼𝑖 = NDVI at a particular pixel from a single image
𝑁 𝐷𝑉 𝐼𝑅𝑒 𝑓 = Median NDVI for the given pixel over all images collected during the reference period 𝑛 = number of unobscured images collected for the given geographic pixel
II. Need for Improved EOS Design & Application Integration
H
istorically the design and development of earth observation system (EOS) have been dominated by governmentagencies with military, scientific, or meteorological objectives in mind. Initially this data was highly inaccessible,∗Doctoral Researcher, Media Arts and Sciences, 77 Massachusetts Avenue, Cambridge, MA 02139.
either veiled by national security protections, locked behind expensive paywalls, or merely without widely available mechanisms of disseminating and processing. More recently, however, these barriers have gradually been reduced. In the US, through the NASA Distributed Active Archive Centerss (DAACs), and in the European Union, via Copernicus, civil government earth observation (EO) has been made largely freely available. Many other nations, however, only selectively share data, usually through international fora such as the Committee on Earth Observation Satellites (CEOS) and the Group of Earth Observations (GEO). In addition to this increase in the availability of data, there has been an explosion of internet connectivity and tools (open source and otherwise) for accessing and processing the data, and we have seen a rise of commercial operators of EOSs [1, 2].
With the increasing availability of EO data has come a commensurate rise in EO applications, particularly those outside of the traditional military, science, and meteorology domains. We have seen near real-time monitoring of wildfires [3], agricultural monitoring [4, 5], and maritime safety [6], to name just a few. This trend was recently acknowledged in the Decadal Survey for Earth Science and Applications from Space [7]. This survey highlighted the increasing importance of linking earth science and application, including in the second element of its suggested strategic framework: “Embrace innovative methodologies for integrated science/applications.” Such “innovative methodologies” include ways of processing EO data but also the design of EOSs.
This interest in applications is not just arising from space and earth scientists. It can also be seen in sustainable development policymakers and activists, who are increasingly aware of the usefulness of EO data in their own domains. More than 100 national governments have joined to form GEO, which, in collaboration with the United Nations (UN) has published a report on the use of EO in support of the 2030 Sustainable Development Goals (SDGs) [8]. The Resources for the Future (RFF), an institution primarily known for their environmental economics work, has partnered with NASA to form a consortium called the Consortium for the Valuation of Applications Benefits Linked with Earth Science (VALUABLES), aimed at assessing the economic value of various EOSs in specific case studies [9, 10].
The theories and tools of Systems Architecture are well posed to address both the need for innovative frameworks, and to accommodate this increased set of stakeholders, which now includes not only global earth scientists, engineers, and national policymakers, but also municipal leaders, local university scholars, entrepreneurs, and more. A Systems Architecture approach requires that we ask what is the context in which a new methodology would be applied? Who are the key stakeholders? What are the needs, desired outcomes, and objectives of each of the stakeholders [11–13]?
When considering these questions in light of the expanded set of stakeholders now involved with EO data, there are two primary needs: availability and accessibility. By availability, we mean that the data exists and can be transmitted to interested decision-makers in this form. This requires that EOSs exist, that they have been designed in such a way as to provide useful data for these applications, and that the data is available in a timely fashion for a reasonable cost to decision-makers. Availability is addressed in the NASA Earth Science Division’s Directive on Project Applications Program, which lays out a plan to consider earth science applications in the early phase of mission design [14]. Accessibility, on the other hand, refers to whether decision-makers are aware and interested in the data, that is has been processed in such a way as to be relevant to them, and it can be integrated into existing or new decision-making processes. In order to grapple with these needs, NASA adapted the longstanding Technology Readiness Levels (TRLs) into the newer EO Application Readiness Levels (ARLs) which span from design to applied use [15]. ESA, meanwhile, has developed a procedure for filtering user requirements up through the six pillar services of the Copernicus program and considering these during the design of future Copernicus satellites [16].
One way of approaching both improved availability and accessibility is multidisciplinary modeling, as such modeling is useful both prospectively in order to design EOS missions with specific applications in mind, and retroactively in order to build decision-support tools that use EO data. EOS design has long made use of interdisciplinary models of various forms. Among the most prominent examples are Observing System Simulation Experiments (OSSEs), which couple environmental simulations with satellite modeling to optimize the design of the platform for a particular scientific or meteorological objective [17]. Historically, this coupling has been indirect, with the OSSE focusing on a physics-based simulation of the resultant level of error reduction caused by the introduction of one or more new datasets. This is used to compare several "distinct envisioned observing system[s]," which are then designed and modeled separately [18]. In other cases, both the physics simulation and the system design optimization are conducted in the same integrated model [19]. In order to expand the range of EO and improve the design of our EOSs for those applications, we will need to expand our OSSEs as well.
It is to address these dual needs of processing data for applications and designing missions with applications in mind that we present a multidisciplinary, integrated modeling framework to advance environmental management, policymaking, and observation platform design. This paper describes a prototype of this integrated modeling framework that, in its base form, captures relationships between models representing Environment-Vulnerability-Decision-Technology (EVDT).
The EVDT Modeling Framework is not the model itself, it is the framework that guides the creation of an integrated model customized to each application with a specific set of stakeholders in mind and designed using Systems Architecture. The EVDT Modeling Framework can be customized to build integrated models specific to a certain application. Individual models in the framework include the core models (Environment, Vulnerability, Decision, Technology) and optional models such as Public Health which are added when needed for a specific application. This use of this framework in turn will lead to the development of a standard to facilitate re-use of models and the design of future remote observation systems by building on the EVDT Modeling Framework.
The subsequent sections of this paper will layout of the EVDT Modeling Framework and its variants, before moving through two, in-progress case study applications. We will then conclude with a discussion of the relevance of such a model for the future of EO application and design. In these sections, unless otherwise stated, terms like "we" and "our team" refers to Space Enabled, a research group at MIT. While based in the US, Space Enabled has regular interaction with colleagues who work on space policy, Earth Observation for the Sustainable Development Goals (EO4SDG) applications, and related work in various parts of Latin America, Africa, and Southeast Asia.
III. Proposed Framework
The proposed EVDT Modeling Framework is a novel application of model-based systems engineering (MBSE) that leverages emerging technologies in several fields [20]. Like all MBSE modeling frameworks, the tool presented here combines information from multiple disciplinary models, but this project is unique because it combines modeling capability drawn from earth science, social science, complex systems modeling of human behavior, and systems engineering models of technology designs. Integrating physics and engineering models has a long history and has become commonplace in the aerospace industry via initiatives such as MBSE as seen in languages such as SysML and UML and software such as IBM’s Rhapsody, NoMagic’s MagicDraw, and ViTech’s GENESYS; multiphysics design tools, such as the Analytical Graphics, Inc. (AGI) Systems Tool Kit (STK) or Sandia National Labs’ Albany and Peridigm; and concurrent engineering facilities, such as Team-X at the NASA Jet Propulsion Laboratory (JPL). Applications span from full-scale aircraft design [21] to the design of injection molding systems [22]. Additionally, MBSE has advanced tradespace exploration over the past decade, including in multi-stakeholder scenarios [23] and in long lifespan, high uncertainty scenarios [24]. The framework proposed here intends to build on these advances by extending such multi-domain modeling to include environmental and social models and applying it in multi-stakeholder, high uncertainty contexts.
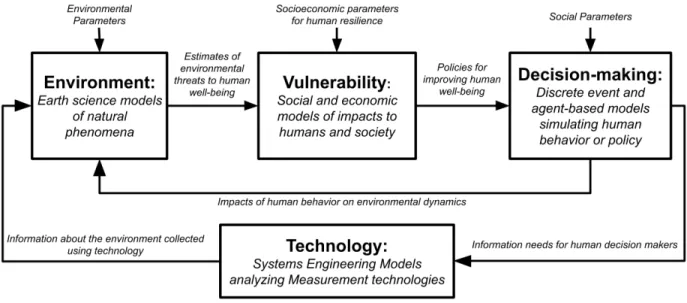
The Environment Model uses earth science to estimate the state of environmental phenomena. This is enabled by recently developed capabilities to use cloud-based data analysis tools such as Google Earth Engine (GEE) to automate programs that access large sets of satellite data (such as the full 40-year Landsat archive) and run efficient analysis [25]. Now such analysts can apply all the available openly shared data for a region within minutes instead of the months required with manual methods. The Vulnerability Model captures social impact (either positive or negative) of environmental changes including ecosystem services. This is enabled by collaboration with economists who draw from traditional data sets such as census data and labor statistics as well as non-traditional datasets such as satellite imagery of human dwellings to understand how human well-being is impacted by environmental changes [26, 27]. The Decision Model captures human behavior and policy consequences, using classical tools such as agent-based modeling and discrete event simulation to simulate dynamic, human actions such as cutting down forests or evacuating during hurricanes. The Technology Model provides tools to design EOSs or select among EO technologies such as satellites, airborne sensors and in-situ sensors. This model is similar to traditional engineering models that parametrically compare architectures for technical systems based on mission requirements and output proposed design features as a function of cost or stakeholder value (for examples of high-level parametric models used for tradespace analysis see [28, 29] and for examples of widely used parametric models for satellite design, see AGI STK and Dassault Systemes’ Solidworks).
This team seeks to provide three key contributions. First is to create an integrated modeling framework combining four domains in such a way that allows information exchange between these vastly different modeling methods, thereby capturing feedback and cyclical dynamics, as seen in Figure 1. Second, the work will gradually develop standard protocols for running such a framework as an interactive simulation. Finally, we are presenting a Systems Architecture-based design approach to building integrated models based on the EVDT Modeling Framework. This type of thinking aims to expand the benefits of MBSE to those that do not have extensive experience with satellite engineering or earth science models, such as policymakers, urban planners, and others.
In each application case study, the EVDT Modeling Framework seeks to address four questions: 1) The Environment Model asks, “What is happening in the natural environment?”
2) The Vulnerability Model asks, “How will humans be impacted by what is happening in the natural environment?” 3) The Decision Model asks, “What decisions are humans making in response to environmental factors and why?” 4) The Technology Model asks, “What technology system can be designed or acquired to provide high quality
information that supports human decision making?”
Fig. 1 Baseline version of the Environment - Vulnerability - Decision - Technology Model (Generic Case)
Applications of EVDT are being developed through three iterative phases: description of the current state of the case, explanation of historical states and inferred relationships between the model components, and prediction of future environmental and societal states. This paper will focus on presenting the first two, description and explanation, as well as a plan for the prediction phase.
At the time of writing, active development of several initial applications of the EVDT Modeling Framework are underway. The following sections will detail two of these applications. The first case study considers the dynamics of human and environmental behavior related to the mangrove forests in the Guaratiba area of Rio de Janeiro. The second case study considers the relevancy of this framework in approaching coronavirus-related public health decisions in Rio de Janeiro, Santiago, and elsewhere.
IV. EVDT Case Study - Rio de Janeiro
Guaratiba is a relatively rural district of Rio de Janeiro situated in the southwestern corner of the municipality. It is home to a mix of land uses, including decorative plant farming, multiple fishing communities, a military base and training center, a state-run biological reserve, some informal settlements, and a growing ecotourism industry. The biological reserve exists to protect the largest remaining mangrove forest within the municipality. These mangroves are vulnerable due to landward urbanization, including a recently opened urban transit line, and rising sea levels [30] They provide a variety of ecosystem services, including serving as a mechanism for highly efficient carbon sequestration, supporting a small-scale industry of fishing and crab catching, preventing coastal erosion, and attracting the aforementioned local ecotourism industry [31]. Government policies to conserve the mangroves can use integrated modeling tools to consider both the benefits of protecting the forests as well as the economic needs of low-income communities. This, coupled with the Rio de Janeiro municipal government’s pre-existing interest in generating useful datasets and making them available online through the Data.Rio platform [32], made the Guaratiba mangroves a particularly suitable case study for the EVDT Modeling Framework.
A. Stakeholder Analysis
Any instantiation of the EVDT Modeling Framework must be preceded by a Stakeholder Analysis to identify the various needs and objectives that the model will be addressing, as well as the context constraints that it will be operating in [11, 33]. A simplified map of the stakeholders in this Guaratiba context can be seen in Figure 2. In this case study,
there are multiple identifiable stakeholders, including municipal government officials, local community members, and university researchers, to name just a few. Our primary collaborators and points of contact are the Pereira Passos Municipal Institute of Urbanism (IPP), which is the municipal data agency, and ESPAÇO, a research group at the Federal University of Rio de Janeiro (UFRJ) who study various coastal ecosystems in Brazil and elsewhere [34, 35] and who are also familiar with examining socioeconomic impacts of environmental phenomena [36]. This project began in 2018 and since that time Jack Reid made two multi-week field visits to Rio de Janeiro and Guaratiba in particular. These visits, in addition to numerous remote meetings. enabled us to repeatedly met with the various stakeholders to assess their objectives and current decision-making processes. This informed the selection of model focus for each of the EVDT components, as described further in the subsequent subsections. These stakeholders are also routinely involved in the design and prototyping process, ensuring that the EVDT model remains targeted at their needs, as is described further in Section VI.A. It should be emphasized that this is a simplified map and numerous other stakeholders, such as researchers at Brazil’s national space research agency, and many flows, such as how the data generated by Brazilian Institute of Geography and Statistics (IBGE) is used by various other stakeholders, are omitted for clarity.
Fig. 2 Simplified Stakeholder Map of the Guaratiba context
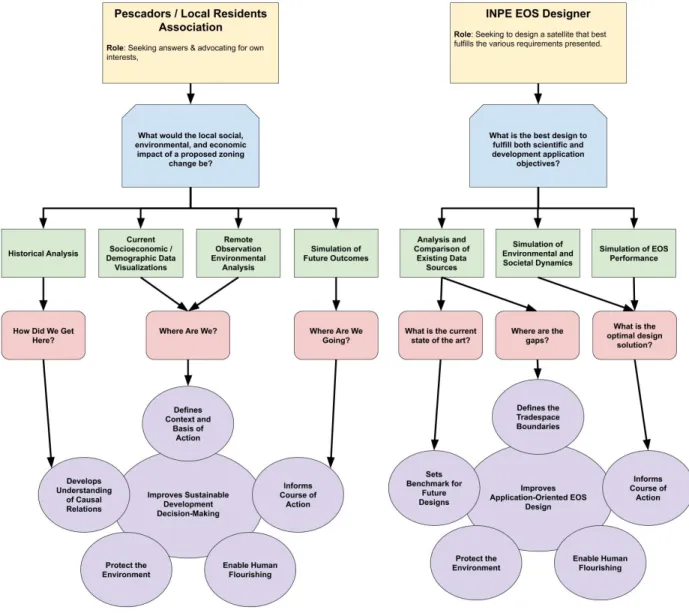
For each component of EVDT, internal validation work is required and is best conducted according to the norms and standards of that field. For the Environment Model in this case, for example, this entails working with ESPAÇO using both remote sensing and in-situ monitoring in order to calibrate and confirm the results of the mangrove health tracking discussed earlier. In addition to this component-by-component verification work, however, there is also a need for overarching validation of the EVDT Modeling Framework and its specific instantiation in a particular context. This, in turn, requires the knowledge of the specific user audiences and what their objectives are, which was supplied
to us via our Stakeholder Analysis. The potential questions and user processes for two of these audiences, a local community member and an EOS designer, are shown in Figure 3. Once identified, these audiences can be engaged either individually or as cross-audience groups in directed workshops to assess validity via the collection of methods known as purposeful gaming [37], wargaming [38–40], and role playing gaming [41, 42].
Fig. 3 Two potential user experience concepts for this case study.
B. Environment
The Environment Model captures the extent and health of the mangroves along the western coast of the Rio de Janeiro municipality. These are the two primary environmental metrics of interest to local policymakers, and their primary temporal focus is the year 2000 to approximately 10-15 years in the future from now. Historical extent and health of the mangroves is based on Landsat and Sentinel imagery processed in GEE. Specifically, extent is identified using a random forest machine learning algorithm. Mangrove extent maps from Global Mangrove Watch (GMW) [43] and Giri et al [44], in conjunction with field visits, were used to identify appropriate training data in the greater Rio de Janeiro area. The classification algorithm could then be used to generate extent estimate maps at other points in time, as well as identifying likely groups of mangroves of smaller areas than typically captured in the GMW maps.
Mangrove health estimates were done by tracking normalized difference vegetation index (NDVI) over time and calculating the mean anomaly between reference and observation periods. NDVI is a normalized difference ratio of near
infrared (NIR) and red surface reflectance, as seen in Equation 1. In Landsat 8’s Operational Land Imager (OLI), the NIR band captures 0.845 µm to 0.885 µm light while the red band captures 0.630 µm to 0.680 µm light. NDVI is the most commonly used and oldest surface reflectance index for tracking vegetation presence and health [45, 46].
NDVI = 𝑁 𝐼 𝑅− 𝑅𝑒𝑑
𝑁 𝐼 𝑅+ 𝑅𝑒𝑑 (1)
In order to identify significant NDVI changes over time and eliminate transitory or cyclical changes (such as seasons), a mean anomaly calculation was used, as shown in Equation 2. In the imagery shown in Figure 4, the reference period was August 31, 1999 to August 31, 2001, while the observation period was September 1, 2001 to September 1, 2018. This combination of extent and health tracking was inspired by work done by Lagomasino et al. [47].
𝐴𝑛𝑜𝑚 𝑎𝑙 𝑦= Í𝑛
𝑖=0(𝑁 𝐷𝑉 𝐼𝑖− 𝑁 𝐷𝑉 𝐼𝑅𝑒 𝑓)
𝑛 (2)
It should be noted that NDVI is not a perfect measure of mangrove health, particularly in a multi-species ecosystem (there are three different species of mangrove trees in the Guaratiba area, each with slightly different reflective properties), but it is broadly accurate.
C. Vulnerability
The Vulnerability Model focuses on the socioeconomic impact of mangrove presence and loss, as well as related government policies. The primary impacts in this context can be categorized as global impacts (societal value of carbon), direct local impacts (raw materials gathered from the forest such as fish and wood), and indirect local impacts (the effect of mangrove loss on water quality and coastal erosion). Historical socioeconomic and demographic data used in the model is based on a combination of national statistics provided by IBGE, such as employment rates and population density, and those collected by the municipal government via agencies like IPP, such as a UN-developed Multidimensional Poverty Index (IPM) [48], a municipally-customized social progress index [49], and detailed land use maps [50]. This data varies significantly in its geographic and temporal resolution, so in order to better understand and quantify the dynamics linking mangrove health and conservation policies with local socioeconomic impact, the team is currently pursuing collaborating with an ecosystem services economist to analyze historical data and potentially to conduct household surveys. For more details on these methods, see [26, 27]. Once these historical dynamics are better understood, we can progress to predictive simulation of vulnerability.
D. Decision-making
The Decision Model can take different forms, depending on whether it is simulating distributed activity by relatively independent agents or more centralized policymaking. The identification of relevant decisions to this EVDT case was done through meetings and prototyping sessions with various decision-makers, including officials from IPP, from the municipal Urban Development Secretariat, the municipal Environmental Secretariat, and the federal environmental protection agency, as well as local community members and university researchers. The two primary policy axes that multiple parties suggested were conservation status of various geographic areas and urban zoning categories. Both of these involve classification choices (is an area going to completely prohibit human use or be classed as ’for sustainable use only?’) and geographic choices (where exactly should the boundaries run). Additionally, the conservation status choices are further complicated by the overlapping municipal, state, and federal conservation areas and categories, which is why all three environmental agencies are included in the stakeholder map in Figure 2. At the time of writing, historical data and maps have been assembled depicting the evolution of these two policy axes.
E. Technology
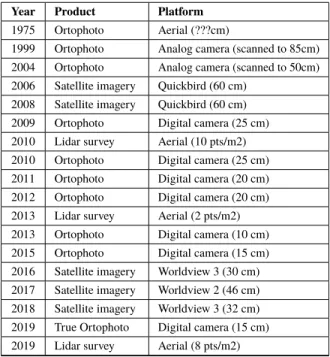
The Technology Model provides historical summary of methods used by the government to collect data about the mangrove growth and seeks to enable comparison of the value of these methods. The city of Rio de Janeiro has made significant use of EO data dating back to 1975, as can be seen in Table 1, but it is only in recent years that this data usage has become fairly regular. Even now, there has not been any particular consistency with the choice of imagery source, with the city switching back and forth between aerial and satellite surveys every few years. And there has been a significant lack in the use of civil scientific satellites such as Landsat for mapping and decision-making purposes, further pointing towards the need for tools to facilitate the use of such satellite data.
Table 1 EO data use by the municipal Urban Planning Secretariat of Rio de Janeiro
Year Product Platform
1975 Ortophoto Aerial (???cm)
1999 Ortophoto Analog camera (scanned to 85cm) 2004 Ortophoto Analog camera (scanned to 50cm) 2006 Satellite imagery Quickbird (60 cm)
2008 Satellite imagery Quickbird (60 cm) 2009 Ortophoto Digital camera (25 cm) 2010 Lidar survey Aerial (10 pts/m2) 2010 Ortophoto Digital camera (25 cm) 2011 Ortophoto Digital camera (20 cm) 2012 Ortophoto Digital camera (20 cm) 2013 Lidar survey Aerial (2 pts/m2) 2013 Ortophoto Digital camera (10 cm) 2015 Ortophoto Digital camera (15 cm) 2016 Satellite imagery Worldview 3 (30 cm) 2017 Satellite imagery Worldview 2 (46 cm) 2018 Satellite imagery Worldview 3 (32 cm) 2019 True Ortophoto Digital camera (15 cm) 2019 Lidar survey Aerial (8 pts/m2)
F. User Interface
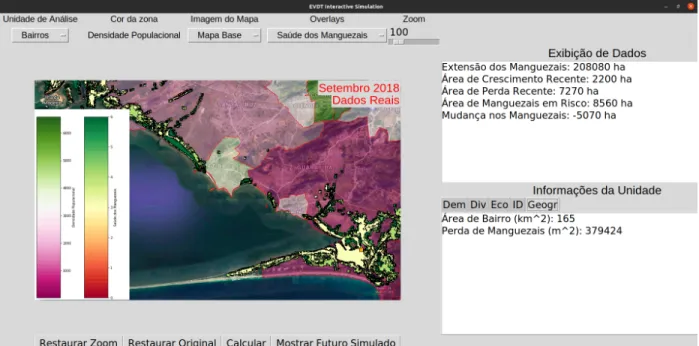
Figure 4, below, shows a prototype version of the model user interface in the Rio de Janeiro case. This model combines estimates of mangrove extent and health with various current socioeconomic information about each neighborhood in the region. The final version of the model will also include simulated forecasts based on user inputs. These user inputs include the level of protection of various conservation units and planning zone type, with others planned to be added. When the complex systems calculations are performed, the impacts of these decisions on various outputs, including a social development index, mangrove health and extent, and ecosystem services will be forecasted for 10 years into the future, a time step that local officials (both environmental and urban planning) have deemed to be a useful length for their planning purposes.
Not shown in this figure is the capability of comparing the information collection capabilities of different remote observation platforms, including existing platforms (Landsat, Planet, aerial surveys, etc.) and hypothetical (as determined by high level design parameters, such as orbit, sensor type, etc.). This functionality, particularly relevant in guided workshops, will be useful for assessing the relative values of these different platforms in terms of directly relevant outputs to the decision-makers and thus informing the selection of the best data sources or combination of data sources, including the design of new platforms.
While still under development, this case study provides an effective demonstration of the utility of the EVDT Modeling Framework. It is by no means the only type of application of the framework, however. The following section will detail another application that includes a notable expansion upon the Environment-Vulnerability-Decision-Technology Modeling Framework.
Fig. 4 Prototype user interface of the model, showing mangrove health, population density, and various other information for western Rio de Janeiro.∗
V. Vida Decision Support System: Expansion of EVDT to Coronavirus Response
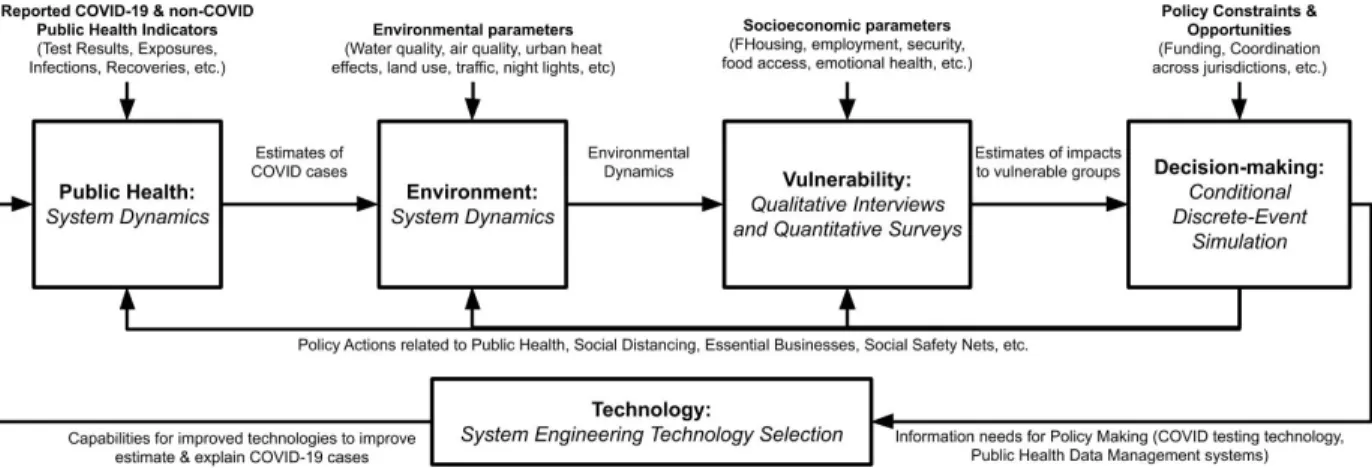
As the coronavirus pandemic swept the globe, many of the local points of contact working with Space Enabled on EVDT and other projects had sudden changes in priorities. Several of them raised the possibility of adapting and expanding the EVDT Modeling Framework to approach coronavirus-related decision-making and impact analysis. This seemed relevant because, as others have noted, coronavirus impacts and response can be characterized as a complex system warranting a multi-domain, model-based approach [51]. The Space Enabled Research Group formed a multi-institution team with relevant expertise, including public health expert Dr. Mohammad Jalali (Harvard Medical School), earth scientist Dr. David Lagomasino (East Carolina University), and data analytics expert Eric Ashcroft (Blue Raster LLC). The EVDT Modeling Framework is flexible and allows optional models to be added that provide additional insight. In order to make an application of EVDT that can support decision-making by government leaders during a pandemic, a Public Health Model is added. An updated model flowchart, which includes this fifth component, can be seen in Figure 5. This application of the EVDT Modeling Framework to inform decision making by governments during a global pandemic is called the Vida Decision Support System. For the remainder of this paper, when discussing details of a particular context, we will continue to use Rio de Janerio as an example for simplicity.
A. Context, Stakeholders, Needs, and Objectives
Vida had a number of differences from our previous EVDT contexts. Chief among these was the expansion of the set of stakeholders. While many of those shown in the Figure 2 stakeholder map are still relevant, many classes saw new entries. We are now interested in the entire populace of Rio de Janeiro rather than just the fishing communities of Guaratiba. Government agencies now include municipal, state, and national public health agencies. University researchers now include public health experts, including those from outside of Brazil. In addition to this expansion of the set of stakeholders, there has been a significant shift in needs and objectives. Whereas most of our EVDT applications sought to capture dynamics that occurred on a timescale of years, Vida needed to simulate daily or weekly phenomena in order to provide actionable data for policymaking. Rather than simulating the changes in mangrove forest over decades, the focus is examining hourly to weekly air and water quality data alongside daily coronavirus epidemiological data and weekly quarantine policies. Government officials need actionable data to both address the ongoing public health
∗The image shown here is in Portuguese, the primary language of the target audience, but multi-language functionality is currently being added and is in available in some other versions of the user interface, as seen in later figures.
Fig. 5 The Vida Decision Support System is an application of the EVDT Modeling Framework designed to support decision making by governments during COVID-19
crisis and to cope with the resultant socioeconomic and environmental consequences. Community members need to understand why their government is making the decisions that it is and understand the risks associated with their own actions.
Additionally, whereas the EVDT applications primarily focused on particular communities of interest within larger municipalities or other administrative jurisdictions, Vida focused on a range of geographic scales, from municipalities to states to nations. Some of these were based on pre-existing, EVDT-related relationships, such as Rio de Janeiro. Others were more novel and were spurred by the new crisis. The Space Enabled Research Group is an academic team and we seek collaboration with stakeholders who understand the context and needs of the community where they live. During the COVID-19 pandemic, we have pursued projects to propose academic prototypes of the Vida Decision Support System with leaders from government agencies and universities in Brazil, Chile, Mexico, Indonesia and Angola. In each case, the local collaborators have suggested that we focus on a specific geographic area impacted by COVID-19. Our approach is to present modeling methods that may support local policies, but we are not delivering operational versions of Vida to each country. Rather, we are presenting the methods that are available for each country to implement with their local teams. With this established, we can now discuss the constiuent models and data used in Vida.
B. Constituent Models and Data
Environment: There are numerous environmental phenomena generated or influenced by the coronavirus pandemic. Urban nighttime lighting patterns changed and (generally) dimmed [52]. Air quality noticeable improved as traffic patterns changed and work-related emissions declined [53]. In many places, water quality noticeable improved and noise diminished [54]. Our team has pursued these using both remote sensing data (Landsat for air and water quality estimations, MODIS for nighttime lighting, Planet for traffic pattern changes) and in-situ sensors (such as the Rio de Janeiro MonitorAr program’s air quality sensors).
Vulnerability: Traditional, government-collected socioeconomic impact data largely does not exist at the fine temporal resolution required for coronavirus-related assessment, so we had to develop the Invisible Variables Initiative (not discussed at length in this paper) to work with our collaborators to develop surveys and interview procedures to elicit needed information. This initiative is led by Dr. Katlyn Turner and funded by the Natural Hazards Center at the University of Colorado, Boulder. As the pandemic has developed, however, some more traditional metrics, such as unemployment data, that show responses to the crisis are beginning to be released.
Decision-making: Obviously the primary decision axis is containing the spread of coronavirus and properly treating those who are infected. In practice this tends to express itself as various forms of public area and business closures and restrictions, individual social distancing requirements (such as mask wearing), and medical equipment acquisition and allocation. In Rio de Janeiro, many of these policies have been grouped together into a six phase Resumption Plan that has clear indicator-based conditions for when to advance to the next phase [55], which facilitates visualization and simulation in Vida.
primarily focused on satellite-based earth observation technology and in-situ environmental sensors, another key form of relevant sensing technology is coronavirus testing (both the technology of the individual tests and the social technology that is the regional testing regime).
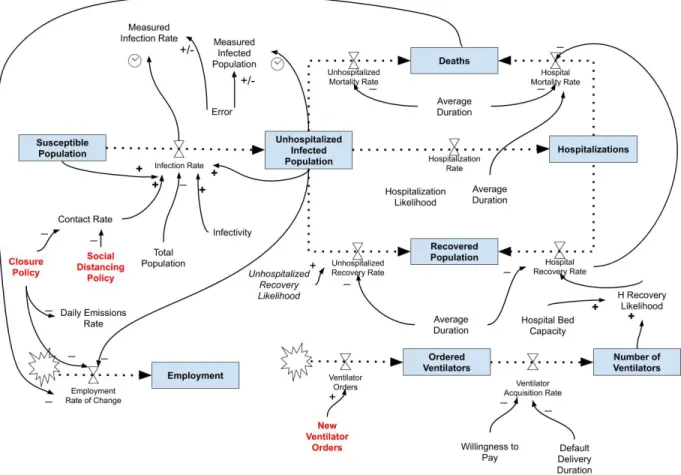
Public Health: In addition to the adapted core components of EVDT, Vida has the obvious addition of a Public Health Model. Rio de Janeiro, along with many other places, has been collecting and publishing coronavirus-related epidemiological data on a daily basis, including new identified infections, deaths, hospitilizations, etc. This component is based on a Susceptible-Infected-Recovered (SIR) system dynamics model. SIR is a compartmental epidemiological model and one of the most commonly used variants, due to its relative simplicity and flexibility while system dynamics is a modeling approach commonly used in both ’pure’ epidemiological contexts [56] and in broader public health policy contexts [57]. Figure 6 shows a diagram depicting the initial layout of the Vida Public Health Model. In addition to the three traditional SIR components, it has two other health compartments: Hospitalizations and Deaths. These reflect some of the primary decision points and metrics of performance that policymakers are using. In most of our application contexts, population counts for each of these compartments is readily available on a daily or weekly basis.
Fig. 6 Initial version of the SIR system dynamics model.
In the bottom left of the diagram, the initial inclusions of Environment and Vulnerability components are shown. These were obviously cursory and highly assumptive. As we have continued active development with out collaborators (which involves weekly or biweekly meetings) and have collected empirical data, we have begun expanding on these elements. Air pollutants, for example, are not merely a function of closure policy. In most locations that we have examined, and in research conducted by others [53], initial coronavirus-related closures resulted in a sudden drop of emissions. Many expected these emissions to rise as these closures were lifted. In fact, as can be seen in Figure 7, when we plotting particulate matter of 10 micrometers and smaller (PM10) against Rio de Janeiro’s closure policies, we can see the rise in emissions leading the relaxation of closure policies, rather than lagging. Coupling this emissions data with mobility data, we can start to examine the factors that lead to increased mobility, even in the face of closure policies, thereby improving our prediction of future health and environmental trends.
Fig. 7 Temporal comparison of PM10 and Rio de Janeiro closure policies, showing that increase in air pollutants seems to be leading the relaxation of closure policies. A closure policy of 1 represents completely open while a closure policy of 0 represents complete lockdown.†
C. Prototype User Interface
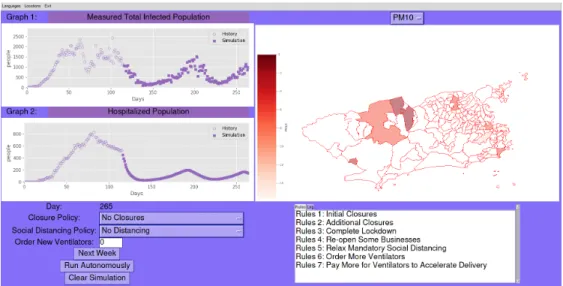
While still under active development, in keeping with the priority on rapid prototyping (discussed further in Section VI.A), a functional, interactive user interface has been created. A screenshot of the user interface can be seen in Figure 8, once again showing Rio de Janeiro. On the left, historical Public Health data (starting from early March, when the epidemic first reached the area) as well as simulated forecasts under certain conditional closure policy rules are shown. The map on the right shows geographic Environment data, specifically the mean anomaly for PM10in the various neighborhoods of the city with the most consistent air quality data collection. In this case, the reference period was January 1, 2019 to March 1, 2020, while the observation period was March 1, 2020 to August 1, 2020.
Dropdown windows for the graphs and the map allow the display of various Public Health, Environment, Vulnerability, and Decision-making information either temporally or geographically, respectively. In the bottom left, we can see various Decision input options. These can be manually input and simulated for one week at a time, or, alternatively, the simulation can be run autonomously for an arbitrary amount of time, using pre-programmed, conditional decision rules. The displayed rules (whose titles are displayed in the lower right of the figure) are fairly arbitrary, but Rio de Janeiro has concrete indicator-based conditions to justify the movement from one phase to another and these conditions are being implemented into the Vida model as of the time of writing. The exact policy decisions, datasets of interest, and dynamics of importance depending on the specific application location, and the current Vida code has remained flexible to such changes.
This model is currently being calibrated using historical data, expanded as new dynamics become evident, and examined by public health experts. Various potential improvements are evident, including combining the SIR system dynamics model with an agent-based model to help address some of the deficiencies of the system dynamics approach [58]. It is our goal not to continue development of this model indefinitely ourselves, but rather to hand over the model and its associated user interface to local collaborators in each of the application areas, so that they can continue to adjust it to their local circumstances. To this end we have been making the code and associated processed data available online and have invited our collaborators to work directly on the code with us.
†After an initial lockdown period in the face of coronavirus, Rio de Janeiro implemented a six phase "Resumption Plan" for re-opening. For more information on these phases, please see https://riocontraocorona.rio/
Fig. 8 Prototype Vida user interface for Rio de Janeiro
VI. Concluding Thoughts and Next Steps
This paper has presented the EVDT Modeling Framework and two initial applications, including one addressing the current coronavirus pandemic. Both of these are very much works in progress, particularly when it comes to the technology design component. The authors had originally planned to include a prototype of this component, as relating to the Rio de Janeiro mangrove case, in this conference paper and to expand upon the ecosystem services calculations, but the time sensitive nature of Vida project took precedence. While the existing prototypes already provide some value to users of EO data, the technology design component must be more fully developed before the EVDT Modeling Framework will reach its potential of directly informing the design of EOSs. That said, even its current form results in raising awareness of the utility of EO data, particularly when combined with other data sources, for making policy decisions in complex environments. This itself will result in a more diverse participation in setting performance requirements for future EOSs. This concluding section will now move away from the two applications to a discussion of the broader EVDT Modeling Framework once more. First will be a discussion of key design requirements for the application of EVDT and then there will be a discussion of future plans and intended consequences.
A. Key Design Requirements
There are certain key design requirements that this team has identified for the development of EVDT applications. Some of these are listed here.
Rapid Prototyping & Co-Design:In order to confirm that the proper data and dynamics are being captured, as well as to ensure the utility of the model to decision-makers and designers, the key stakeholders must be involved at all stages of the design process. Additionally, since most individuals have a difficult time providing concrete advice and criticism when discussing the abstract, rapid prototyping and mock-ups are important for stimulating feedback. One key component of this is always making sure that the user interface is available in the native language of the primary users.
Enlist appropriate experts: The design of any EOS is inherently interdisciplinary and this is also true for EO applications. For this reason the development necessarily involves a wide range of collaborators who vary both in terms of discipline (systems engineering, earth science, economics, etc.) and it terms of institution (academic researchers, government officials, NGO and corporate leaders, local activists, etc.). Rather than make assumptions when confronted with an issue outside our expertise, we do our utmost to recruit or consult with a relevant expert. Obviously such a large and diverse team is not feasible for every application nor does it scale particularly well. This is why the next requirement is present.
Open Access and Modularity for Adaptation and Reuse: The intent is not for this team to develop complete, black-box products, but rather to facilitate the the tool development process for others. Part of this includes the co-design requirement, but another part is making the code itself readily available online and designing the implementation of the framework to be as reusable as possible. In this way, local government officials may be able to reuse previous EO data processing techniques, while focusing on the vulnerability or decision-making components. This is also important to
provide clarity on ultimate ownership and responsibility for the product.
Ensure computational accessibility:Cloud-based and internet-hosted tools eliminate the need to direct possession of high performance computing equipment by either the end users or the developers. This reduces cost-of-entry for potential developers of EVDT models and ensures that end users can interact with, critique, and apply the models wherever they are, provided they have internet access. That is why our processing techniques and code either are hosted online or are designed to be able to run on a standard work laptop.
Awareness of different stakeholder needs and interests: While specific examples are discussed in the earlier sections, collaborators and users have a variety of educational backgrounds and personal priorities. This vary not only across institutions (such as government officials and local activists having different priorities) but also within an institution (such as an urban planning official assigned to a particular neighborhood versus one responsible for city macroplanning). We are often not aware of all of these differences, nor of pre-existing relationships and dynamics. For this reason it is important to cultivate relationships with a variety of local stakeholders, rather than relying on just on point of contact. The "outside expert" dynamic is also one prone to unintended consequences [59], which is why our team focuses on providing useful tools and insights, rather than on making concrete recommendations.
B. Broader Consequences
The ultimate goal of the EVDT Modeling Framework is not to address mangrove conservation or coronavirus management in Rio de Janeiro, though both are worthy objectives and ones that we hope that we are contributing towards. Rather, the EVDT Modeling Framework is about bringing diverse datasets from different domains together; creating methods for collaborative model building; and aiming to integrate environmental and socioeconomic data analysis with a consideration of ever-changing technology design; and to, in fact, contribute to that technology design. The data, and the requisite expertise to properly wield it, already exists. One notable lesson from our team’s progress thus far is that the process of pursing an EVDT model instantiation itself tends to accomplish many of the models intended objectives. Experts from different domains share information and insight, collaborations are identified, and decision-making improves.
Nonetheless, the integration of these different domains is not trivial and a great deal of work lies ahead. From these specific case studies, standard model components and APIs will need to be developed. The platform will need to be moved as primarily online to facilitate ease of access. And a community of practice that includes EOS designers, sustainable development policymakers, and researchers from several different domains will need to be grown to insure that the EVDT Modeling Framework will continue to be applied and its output can manifest in policy and technology.
Acknowledgments
We would like to acknowledge the input and support of the broader Vida team and other collaborators. In Brazil, this includes Felipe Mandarino of IPP as well as Prof. Carla Madureira and Prof. Rafael Barros of ESPAÇO at UFRJ. In the US, this includes Prof. David Lagomasino of East Carolina University, Prof. Mohammad Jalali of Harvard University, Eric Ashcroft of Blue Raster, Prof. Suhyun Jung of West Virginia University, as well as our colleagues, Dr. Kate Turner and Seamus Lombardo at the Space Enabled Research Group. Teams from several countries voluntarily spent time with the authors to advance a prototype version of the Vida Decision Support System for their region. For each team, multiple volunteers participated from universities and government agencies. Here we list the team leads while appreciating all the contributions. Prof Joga Setiawan (Diponegoro University) and Dr. Hanifa Denny (Diponegoro University) lead coordination for the Indonesia Vida work. Prof Joaquin Salas (Centro de Investigación en Ciencia Aplicada y Tecnología Avanzada, Universidad Querétaro) and Mr. Alejandro Monsivais (Mexican Space Agency) led coordination for the Mexico Vida work. Jose Guiridi (Ministerio de Ciencia, Tecnología, Conocimiento e Innovación) led coordination for the Chile Vida effort; and Zolana Joao (Management Office of the National Space Program) led coordination for the Angola Vida work.
References
[1] Kruse, J., Crompvoets, J., and Pearlman, F. (eds.), GEOValue: The Socioeconomic Value of Geospatial Information, CRC Press, New York, NY, 2017. https://doi.org/10.1201/b20712.
[2] Tatem, A. J., Goetz, S. J., and Hay, S. I., “Fifty Years of Earth-Observation Satellites,” American Scientist, 2017.
Description and Initial Assessment,” Remote Sensing of Environment, Vol. 143, 2014, pp. 85–96. https://doi.org/10.1016/j.rse. 2013.12.008.
[4] Hou, A. Y., Kakar, R. K., Neeck, S., Azarbarzin, A. A., Kummerow, C. D., Kojima, M., Oki, R., Nakamura, K., and Iguchi, T., “The Global Precipitation Measurement Mission,” Bulletin of the American Meteorological Society, Vol. 95, No. 5, 2014, pp.
701–722. https://doi.org/10.1175/BAMS-D-13-00164.1.
[5] Wahr, J., Swenson, S., Zlotnicki, V., and Velicogna, I., “Time-Variable Gravity from GRACE: First Results,” Geophysical
Research Letters, Vol. 31, No. 11, 2004, pp. 20–23. https://doi.org/10.1029/2004GL019779.
[6] Weintrit, B., “Earth Observation Opportunities to Enhance Maritime Safety,” TransNav, the International Journal on Marine
Navigation and Safety of Sea Transportation, Vol. 11, No. 4, 2017, pp. 699–703. https://doi.org/10.12716/1001.11.04.17. [7] National Academies of Sciences, E., Thriving on Our Changing Planet: A Decadal Strategy for Earth Observation from Space,
National Academies Press, 2018. https://doi.org/10.17226/24938.
[8] Group on Earth Observations, “Earth Observations in Support of the 2030 Agenda for Sustainable Development,” , Mar. 2017. [9] Kuwayama, Y., Mabee, B., and Dunlap, L., “Introducing the VALUABLES Consortium Impact Assessment Framework,”
https://www.rff.org/publications/explainers/value-information-impact-assessment-framework/, Oct. 2019.
[10] Stroming, S., Robertson, M., Mabee, B., Kuwayama, Y., and Schaeffer, B., “Quantifying the Human Health Benefits of Using Satellite Information to Detect Cyanobacterial Harmful Algal Blooms and Manage Recreational Advisories in U.S. Lakes,”
GeoHealth, Vol. 4, No. 9, 2020, p. e2020GH000254. https://doi.org/10.1029/2020GH000254.
[11] Crawley, E., Cameron, B., and Selva, D., System Architecture: Strategy and Product Development for Complex Systems, 1sted., Pearson, Boston, 2015.
[12] Maier, M. W., The Art of Systems Architecting, 3rded., CRC Press, Boca Raton, 2009.
[13] Kazansky, Y., Wood, D., and Sutherlun, J., “The Current and Potential Role of Satellite Remote Sensing in the Campaign against Malaria,” Acta Astronautica, Vol. 121, 2016, pp. 292–305. https://doi.org/10.1016/j.actaastro.2015.09.021.
[14] Division, N. H. S. M. D. E. S., “Directive on Project Applications Program,” Tech. rep., National Aeronautics and Space Administration, Washington D.C., Jun. 2016.
[15] NASA Applied Science Program, “The Application Readiness Level Metric,” , 2013.
[16] Le Traon, P. Y., Reppucci, A., Alvarez Fanjul, E., Aouf, L., Behrens, A., Belmonte, M., Bentamy, A., Bertino, L., Brando, V. E., Kreiner, M. B., Benkiran, M., Carval, T., Ciliberti, S. A., Claustre, H., Clementi, E., Coppini, G., Cossarini, G., De Alfonso Alonso-Muñoyerro, M., Delamarche, A., Dibarboure, G., Dinessen, F., Drevillon, M., Drillet, Y., Faugere, Y., Fernández, V., Fleming, A., Garcia-Hermosa, M. I., Sotillo, M. G., Garric, G., Gasparin, F., Giordan, C., Gehlen, M., Gregoire, M. L., Guinehut, S., Hamon, M., Harris, C., Hernandez, F., Hinkler, J. B., Hoyer, J., Karvonen, J., Kay, S., King, R., Lavergne, T., Lemieux-Dudon, B., Lima, L., Mao, C., Martin, M. J., Masina, S., Melet, A., Buongiorno Nardelli, B., Nolan, G., Pascual, A., Pistoia, J., Palazov, A., Piolle, J. F., Pujol, M. I., Pequignet, A. C., Peneva, E., Pérez Gómez, B., Petit de la Villeon, L., Pinardi, N., Pisano, A., Pouliquen, S., Reid, R., Remy, E., Santoleri, R., Siddorn, J., She, J., Staneva, J., Stoffelen, A., Tonani, M., Vandenbulcke, L., von Schuckmann, K., Volpe, G., Wettre, C., and Zacharioudaki, A., “From Observation to Information and Users: The Copernicus Marine Service Perspective,” Frontiers in Marine Science, Vol. 6, 2019. https://doi.org/10.3389/fmars.2019.00234. [17] Errico, R. M., Yang, R., Privé, N. C., Tai, K. S., Todling, R., Sienkiewicz, M. E., and Guo, J., “Development and Validation of Observing-System Simulation Experiments at NASA’s Global Modeling and Assimilation Office,” Quarterly Journal of the
Royal Meteorological Society, Vol. 139, No. 674, 2013, pp. 1162–1178. https://doi.org/10.1002/qj.2027.
[18] Masutani, M., Schlatter, T. W., Errico, R. M., Stoffelen, A., Andersson, E., Lahoz, W., Woollen, J. S., Emmitt, G. D., Riishojgaard, L.-P., and Lord, S. J., “Observing System Simulation Experiments,” Data Assimilation: Making Sense of
Observations, Springer, New York City, NY, 2010, pp. 647–679. https://doi.org/10.1007/978-3-540-74703-1.
[19] Nag, S., Gatebe, C. K., and de Weck, O., “Observing System Simulations for Small Satellite Formations Estimating Bidirectional Reflectance,” International Journal of Applied Earth Observation and Geoinformation, Vol. 43, 2015, pp. 102–118. https://doi.org/10.1016/j.jag.2015.04.022.
[20] Reid, J., Zeng, C., and Wood, D., “Combining Social, Environmental and Design Models to Support the Sustainable Development Goals,” IEEE Aerospace Conference Proceedings, Vol. 2019-March, IEEE Computer Society, Big Sky, Montana, 2019. https://doi.org/10.1109/AERO.2019.8741623.
[21] Agte, J., de Weck, O., Sobieszczanski-Sobieski, J., Arendsen, P., Morris, A., and Spieck, M., “MDO: Assessment and Direction for Advancement—an Opinion of One International Group,” Structural and Multidisciplinary Optimization, Vol. 40, No. 1-6, 2010, pp. 17–33. https://doi.org/10.1007/s00158-009-0381-5.
[22] Ferreira, I., de Weck, O., Saraiva, P., Cabral, J., Ferreira, I., de Weck, O., Saraiva, P., and Cabral, J., “Multidisciplinary Optimization of Injection Molding Systems,” Structural and multidisciplinary optimization, Vol. 41, No. 4, 2010, pp. 621–635. https://doi.org/10.1007/s00158-009-0435-8.
[23] Fitzgerald, M. E., and Ross, A. M., “Recommendations for Framing Multi-Stakeholder Tradespace Exploration,” INCOSE
International Symposium, Edinburgh, UK, 2016.
[24] Vascik, P., Ross, A. M., and Rhodes, D. H., “A Method for Exploring Program and Portfolio Affordability Tradeoffs Under Uncertainty Using Epoch-Era Analysis: A Case Application to Carrier Strike Group Design:,” Proceedings of
the 12th Annual Acquisition Research Symposium, Defense Technical Information Center, Fort Belvoir, VA, 2015. https://doi.org/10.21236/ADA623192.
[25] Gorelick, N., Hancher, M., Dixon, M., Ilyushchenko, S., Thau, D., and Moore, R., “Google Earth Engine: Planetary-Scale Geospatial Analysis for Everyone,” Remote Sensing of Environment, Vol. 202, 2017, pp. 18–27. https://doi.org/10.1016/j.rse. 2017.06.031.
[26] Jung, S., Rasmussen, L. V., Watkins, C., Newton, P., and Agrawal, A., “Brazil’s National Environmental Registry of Rural Properties: Implications for Livelihoods,” Ecological Economics, Vol. 136, 2017, pp. 53–61. https://doi.org/10.1016/j.ecolecon. 2017.02.004.
[27] Jung, S., “Evidence on Land Deals’ Impacts on Local Livelihoods,” Current Opinion in Environmental Sustainability, Vol. 32, 2018, pp. 90–95. https://doi.org/10.1016/j.cosust.2018.05.017.
[28] Curry, M. D., Rehn, C. F., Ross, A. M., and Rhodes, D. H., “Designing for System Value Sustainment Using Interactive Epoch–Era Analysis: A Case Study from Commercial Offshore Ships,” Disciplinary Convergence in Systems Engineering
Research, edited by A. M. Madni, B. Boehm, R. G. Ghanem, D. Erwin, and M. J. Wheaton, Springer International Publishing, Cham, 2018, pp. 267–280. https://doi.org/10.1007/978-3-319-62217-0_19.
[29] Le Moigne, J., Dabney, P., de Weck, O., Foreman, V., Grogan, P., Holland, M., Hughes, S., and Nag, S., “Tradespace Analysis Tool for Designing Constellations (TAT-C),” 2017 IEEE International Geoscience and Remote Sensing Symposium (IGARSS), 2017, pp. 1181–1184. https://doi.org/10.1109/IGARSS.2017.8127168.
[30] Goldberg, L., Lagomasino, D., and Fatoyinbo, T., “EcoMap: A Decision-Support Tool to Monitor Global Mangrove Vulnerability and Its Drivers,” AGU Fall Meeting Abstracts, 2018.
[31] Schwenk, L. M., and Cruz, C. B. M., “The Research Environmental and Socio-Economical Conflicts Relative to the Advance of the Soybean Growth in Areas of Influence of the Integration and Development Axis in the State of Mato Grosso,” Acta
Scientiarum. Agronomy, Vol. 30, No. 4, 2008, pp. 501–511. https://doi.org/10.4025/actasciagron.v30i4.5305.
[32] Matheus, R., Vaz, J. C., and Ribeiro, M. M., “Open Government Data and the Data Usage for Improvement of Public Services in the Rio de Janeiro City,” Proceedings of the 8th International Conference on Theory and Practice of Electronic Governance, Association for Computing Machinery, New York, NY, USA, 2014, pp. 338–341. https://doi.org/10.1145/2691195.2691240. [33] Wood, D. R., “Building Technological Capability within Satellite Programs in Developing Countries,” Doctoral, Massachusetts
Institute of Technology, 2012.
[34] Cruz, C. B. M., Seabra, R. S. V., V da S, REIS, R. B., FABER, O. A., Richter, M., Arnaut, P. K. E., and Araújo, M., “Classificação Orientada a Objetos No Mapeamento Dos Remanescentes Da Cobertura Vegetal Do Bioma Mata Atlântica, Na
Escala 1: 250.000,” Anais XIII Simpósio Brasileiro de Sensoriamento Remoto, Florianópolis, Brazil, 2007, pp. 5691–5698. [35] Seabra, V. d. S., and Cruz, C. M., “Mapeamento da dinâmica da cobertura e uso da terra na bacia hidrográfica do Rio São João,
RJ,” Sociedade & Natureza, Vol. 25, No. 2, 2013, pp. 411–426. https://doi.org/10.1590/S1982-45132013000200015. [36] Schwenk, L. M., and Cruz, C. B. M., “Conflitos socioeconômicos-ambientais relativos ao avanço do cultivo da soja em áreas de
influência dos eixos de integração e desenvolvimento no Estado de Mato Grosso,” Acta Scientiarum. Agronomy, Vol. 30, No. 4, 2008, pp. 501–511. https://doi.org/10.4025/actasciagron.v30i4.5305.
[37] Ross, A. M., Fitzgerald, M. E., and Rhodes, D. H., “Game-Based Learning for Systems Engineering Concepts,” Conference
on Systems Engineering Research, Vol. 28, edited by A. M. Madni and M. Sievers, Elsevier, Redondo Beach, CA, 2014, pp. 430–440. https://doi.org/10.1016/j.procs.2014.03.053.
[38] Hanson, M. E., “Improving Operational Wargaming : It’s All Fun and Games Until Someone Loses a War,” Monograph, United States Army Command and General Staff College, For Leavenworth, Kansas, 2016.
[39] Selva, P., “Revitalizing Wargaming Is Necessary to Be Prepared for Future Wars,” War On The Rocks2, 15.
[40] Shlapak, D. A., and Johnson, M. W., Reinforcing Deterrence on NATO’s Eastern Flank: Wargaming the Defence of the Baltics, RAND Corporation, Washington D.C., 2016. https://doi.org/10.7249/RR1253.
[41] Grogan, P. T., and de Weck, O. L., “Federated Simulation and Gaming Framework for a Decentralized Space-Based Resource Economy,” Thirteenth ASCE Aerospace Division Conference on Engineering, Science, Construction, and Operations in
Challenging Environments, and the 5th NASA/ASCE Workshop On Granular Materials in Space Exploration, American Society of Civil Engineers, Pasadena, California, 2012, pp. 1468–1477. https://doi.org/10.1061/9780784412190.156.
[42] Grogan, P. T., and de Weck, O. L., “Strategic Engineering Gaming for Improved Design and Interoperation of Infrastructure Systems,” Working Paper, Massachusetts Institute of Technology. Engineering Systems Division, Mar. 2012.
[43] Global Mangrove Watch, “Global Mangrove Extent (v2.0),” www.globalmangrovewatch.org, 2018.
[44] Giri, C., Ochieng, E., Tieszen, L. L., Zhu, Z., Singh, A., Loveland, T., Masek, J., and Duke, N., “Status and Distribution of Mangrove Forests of the World Using Earth Observation Satellite Data,” Global Ecology and Biogeography, Vol. 20, No. 1, 2011, pp. 154–159. https://doi.org/10.1111/j.1466-8238.2010.00584.x.
[45] Freden, S. C., Mercanti, E. P., and Becker, M. A., “Monitoring Vegetation Systems in the Great Plans with ERTS,” Hird Earth
Resources Technology Satellite-1 Symposium: The Proceedings of a Symposium Held by Goddard Space Flight Center at Washington, D.C. on December 10-14, 1973, Scientific and Technical Information Office, National Aeronautics and Space Administration, Washington D.C., 1974, pp. 309–329.
[46] Haboudane, D., Miller, J. R., Pattey, E., Zarco-Tejada, P. J., and Strachan, I. B., “Hyperspectral Vegetation Indices and Novel Algorithms for Predicting Green LAI of Crop Canopies: Modeling and Validation in the Context of Precision Agriculture,”
Remote Sensing of Environment, Vol. 90, No. 3, 2004, pp. 337–352. https://doi.org/10.1016/j.rse.2003.12.013.
[47] Lagomasino, D., Fatoyinbo, T., Lee, S., Feliciano, E., Trettin, C., Shapiro, A., and Mangora, M. M., “Measuring Mangrove Carbon Loss and Gain in Deltas,” Environmental Research Letters, Vol. 14, No. 2, 2019, p. 025002. https://doi.org/10.1088/1748-9326/aaf0de.
[48] Oxford Poverty and Human Development Initiative, “Charting Patheways out of Multidimensional Poverty: Achieving the SDGs,” Tech. rep., United Nationals Development Programme, 2020.
[49] Pulici, A., Moura, D. C., and Mosaner, M. S., “Relatório Metodológico: Índice de Progresso Social no Rio de Janeiro,” Tech. rep., Instituto Pereira Passos, Rio de Janeiro, Brazil, 2016.
[50] Rego, L., and Koch, B., “Automatic Classification of Land Cover with High Resolution Data of the Rio de Janeiro City Brazil,” 2003 2nd GRSS/ISPRS Joint Workshop on Remote Sensing and Data Fusion over Urban Areas, 2003, pp. 172–176. https://doi.org/10.1109/DFUA.2003.1219981.
[51] de Weck, O., Krob, D., Lefei, L., Lui, P. C., Rauzy, A., and Zhang, X., “Handling the COVID-19 Crisis: Toward an Agile Model-based Systems Approach,” Systems Engineering, 2020, p. sys.21557. https://doi.org/10.1002/sys.21557.
[52] Elvidge, C. D., Ghosh, T., Hsu, F.-C., Zhizhin, M., and Bazilian, M., “The Dimming of Lights in China during the COVID-19 Pandemic,” Remote Sensing, Vol. 12, No. 17, 2020, p. 2851. https://doi.org/10.3390/rs12172851.
[53] Isaifan, R. J., “The Dramatic Impact of Coronavirus Outbreak on Air Quality: Has It Saved as Much as It Has Killed so Far?”
Global Journal of Environmental Science and Management, Vol. 6, No. 3, 2020, pp. 275–288. https://doi.org/10.22034/gjesm. 2020.03.01.
[54] Arora, S., Bhaukhandi, K. D., and Mishra, P. K., “Coronavirus Lockdown Helped the Environment to Bounce Back,” Science of
The Total Environment, Vol. 742, 2020, p. 140573. https://doi.org/10.1016/j.scitotenv.2020.140573. [55] IplanRio, “Indicadores Do Plano de Retomada,” http://inteligencia.rio/plano-de-retomada/, Sep. 2020.
[56] Homer, J. B., and Hirsch, G. B., “System Dynamics Modeling for Public Health: Background and Opportunities,” American
[57] Deutsch, A. R., Lustfield, R., and Jalali, M. S., “Community-Based System Dynamics Modeling of Sensitive Public Health Issues: Maximizing Diverse Representation of Individuals with Personal Experiences,” Preprint, Submitted for peer review, 2020, p. 22.
[58] Ahmed, A., Greensmith, J., and Aickelin, U., “Variance in System Dynamics and Agent Based Modelling Using the SIR Model of Infectious Disease,” SSRN Scholarly Paper ID 2829229, Social Science Research Network, Rochester, NY, Jan. 2012. https://doi.org/10.2139/ssrn.2829229.