The Defect Structure and Transport Properties of Some High Tc Superconductors
By
Ming-Jinn Tsai
B. S. Mechanical Engineering
National Taiwan University, Taipei, Taiwan, ROC (1980) M. S., Materials Science
National Sun Yat-Sen University Kaohsiung, Taiwan, ROC (1985)
Submitted to the Department of Materials Science and Engineering in Partial Fulfillment of the Requirements of
the Degree of Doctor of Philosophy at the
Massachusetts Institute of Technology February, 1991
@ Massachusetts Institute of Technology, 1990.
Signature of Autl _
Depa men Materials Science and Engineering
( A
q
January, 11 1990
Certified by
Professor Harry L. Tuller sis Supervisor Accepted by
Professor Linn W. Hobbs Chairman, Departmental Committee on Graduate Students
ARCHIVES MASSACHUAETTS ;siI iuF
OF TECPo' GY MAAR 0 8 1991
DEFECT STRUCTURE AND TRANSPORT PROPERTIES OF SOME HIGH Tc SUPERCONDUCTORS
by
MING-JINN TSAI
submitted to the Department of Materials Science and Engineering on January 11, 1991 in partial fulfillment of the requirements for the
Degree of Doctor of Philosophy
ABSTRACT
The defect structures and transport properties of La2-.xSrxCuO4. 8, Nd2-xCeXCuO4+a, and YBa 2Cu 3-xTix0 6+a were studied by 4-probe DC conductivity and thermoelectric power measurements as functions of temperature, P0 2 and doping concentration. The conductivity and thermoelectric power of La2CuO 4.8 both follow a P0 21/6 dependence
at high temperatures, consistent with a defect model which involves equilibration between doubly-ionized oxygen defects and holes. The insensitivity of both properties to temperature implies that the enthalpy of the redox reaction is insignificant. Initially, Sr doping of La2-.xSrxCuO4.8 is compensated by holes which increases the conductivity, up to a maximum at x ~ 0.3. A transition to oxygen vacancy compensation at x ~ 0.3 is evidenced by a decrease in conductivity and an increase in P0 2 dependence. The conductivity
also undergoes an apparent metalinsulator transition with x at x -0.9. At large x, a more rapid change of conductivity with temperature at high temperature is attributed to a redox reaction, an interpretation which is supported by a fixed-composition cooling experiment. In LaSrCuO4-8, a p-n transition emerges at high temperatures and low PO2's.
Nd 2CuO 4.- is an n-type semiconductor. The electron mobility was found not to be thermally activated. At high temperatures the electron density is primarily determined by a reduction reaction. The Ce donor substitution on Nd sites increases the conductivity up
to 15% of Ce. At high Ce levels, the charge carriers become degenerate so that the conductivity and thermoelectric power become Po 2 and temperature independent.
YBa2Cu3-xTix06+s is metallic below ~ 400 *C. Above that temperature the redox reaction dominates carrier generation. At T = 700 *C in 1OOppm 02, it undergoes a p-n transition. The magnitude of conductivity and its dependence on temperature and P0 2 are nearly independent of Ti concentration up to x = 0.1 and are very similar to the undoped YBa2Cu 30 6+8, suggesting a large oxygen disorder.
Thesis Advisor: Harry L. Tuller
TABLE OF CONTENTS TITLE PA G E...---...1 A B STRA CT... ... -... ---... 2 TABLE OF CONTENTS... .... 4 LIST OF FIGURES...- ... 7 LIST OF TABLES... -. ... 14 ACKNOWLEDGEMENTS... 15 1. INTRODUCTION... 16 2. LITERATURE REVIEW...19 2.1 La2-xSrxCuO4- . . . ..---- . 1 9 2.1.1 Structure, Solid Solution and Stoichiometry... 20
2.1.2 Transport Properties... 24
2.1.3 Defect Chemistry... 28
2.2 Nd2-xCexCuO4+s ... 3
2.2.1 Structure, Solid Solution and Stoichiometry... 34
2.2.2 Transport Properties...3 6 2.2.3 Defect Chemistry...3 9 2.3 YBa2Cu3-xTixO6+...---..-- ~~~~~~~... .- .~~~...4 o 1 2.3.1 Structure, Solid Solution and Stoichiometry...4 1 2.3.2 Transport Properties...6....46 2.3.3 Defect Chemistry...4 8 3. T H E O R Y ... 5 4 3.1 Electrical Properties...5 4 3.1.1 Electrical Conductivity... 54 3.1.1.1 M etals... 5 5 3.1.1.2 Semiconductors...5 6 3.1.1.3 Conductivity of YBa2Cu306+8.---...---... 60 3.1.2 Thermoelectric Power...6 1 3.1.2.1 M etals... . 6 2 3.1.2.2 Semiconductors... 62
3.1.3 Localization and Metal-Insulator Transitions...66
3.1.3.1 Localization... 66
3.1.3.2 Metal-Insulator Transitions... 68
3.2 Defect Chemistry... 70
3.2.1 La2-xSrxCuO4. ... 7 1 3.2.2 Nd2.xCexCuO4+8 ....---....---. . . . 74
3.2.3 YBa2Cu3-xTix06+ ... 80
4. EXPERIMENTAL... 83
4.1 Sample Preparations... 83
4.1.1 Citric Solution Method... 83
4.1.2 Oxide-Mixing Method... 84
4.2 Electrical Property Measurements...9 1 4.2.1 Conductivity... 93
4.2.2 Thermoelectric Power... 96
4.2.2.1 Heat-Pulse Technique... 96
4.2.2.2 Constant Temperature Gradient Technique.98 4.2.2.3 Thermoelectric Power of Pt... 103
4.2.3 Measurement Strategy... 104
4.2.3.1 Isothermal Annealing...104
4.2.3.2 Isobaric Cooling... 106
4.2.3.3 Fixed-Compositional Cooling... 106
4.3 Structural and Phase Characterizations... 107
4.3.1 X-Ray Diffraction... 107 4.3.2 Electron Microscopy... 108 5. RESULTS...11 6 5.1 La2-xSrxCuO4-8 System...11 6 5.1.1 La2CuO4. ... 11 6 5.1.2 La2-xSrxCuO4.s (0 < x < 1)...123 5.1.3 LaSrCuO4.8 ... *.. ... ... ... ... ... .... .137 5.2 Nd2-xCexCuO4+8 System...1 53 5.2.1 Nd2CeCuO4+8 ... 153 5.2.2 Nd2-xCexCuO4+s (0 < x < 0.2)... 169 5.2.3 Nd1.85Ce0.15CuO4+ ... 1 87 5.3 YBa2Cu3-xTixO& s... - - . . ---... 187 6. DISCUSSION... 201 6.1 La2-xSrxCuO4-8 System... 201
6.1.1 Defect Model and Transport of La2CuO 4+8 ... . . .. . .. 201
6.1.2 Doping Effects of Sr... 207
6.1.3 Defect Model of LaSrCuO4... 215
6.1.4 Oxygen Stoichiometry of LaSrCuO4... 216
6.2 Nd2-xCexCuO4. System...217
6.2.2 Defects of Nd2CuO44.... ... ... .... .... ... .... ... 222
6.2.3 Oxygen Stoichiometry... 222
6.2.4 Doping Effects of Ce...225
6.3 YBa2Cu3-xTixO,6 Systsem... 229
7. CONCLUSION...232
8. FUTURE W ORK... 234
List of Figures
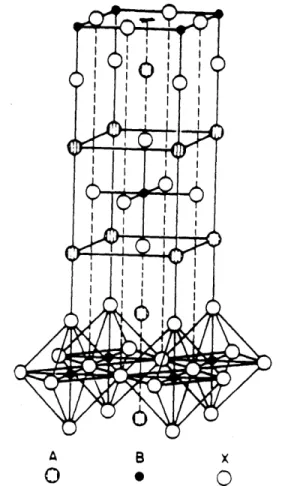
Fig. 2.1.1 Unit cell of La2CuO 4 structure A: La atom, B: Cu atom, and
C: 0 atom [Longo and Raccah, 1973]...2 1 Fig. 2.1.2 Hole concentration of La2.SrxCuO4.6 vs. x [Sreedhar and
Ganguly, 1990; the open and circles from Torrance et al., 1988; and the open squares from Nguyen et al., 1981 ].21 Fig. 2.1.3 Variation of the a (a), c (b), molar volume (c) and a/c (d) as a function of x in the La2.xSrxCuO4.8 system [Sreedhar and Ganguly, 1990; open circles and triangles from N guyen etal., 1981]... 2 3 Fig. 2.1.4 Resistivity (a) and thermoelectric power (b) of Ln2CuO4
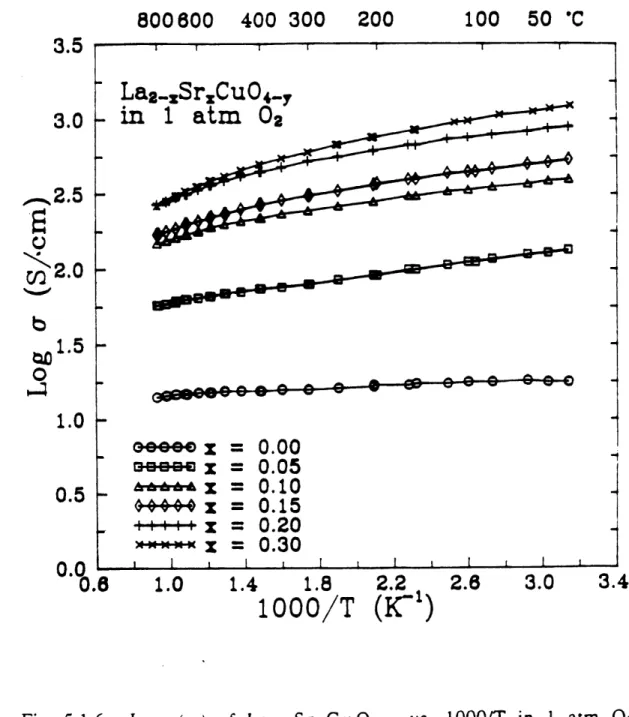
[Ganguly and Rao, 1973]... 2 5 Fig. 2.1.5 Variation of conductivity as a function of 1/T of La2 -xSrxCuO4.8 for 0 s x s 0.16 (a) and for 0.25 s x s 1.0 (b) [N guyen et al., 19831... 26 Fig. 2.1.6 Schematic density of states vs. energy diagrams for the
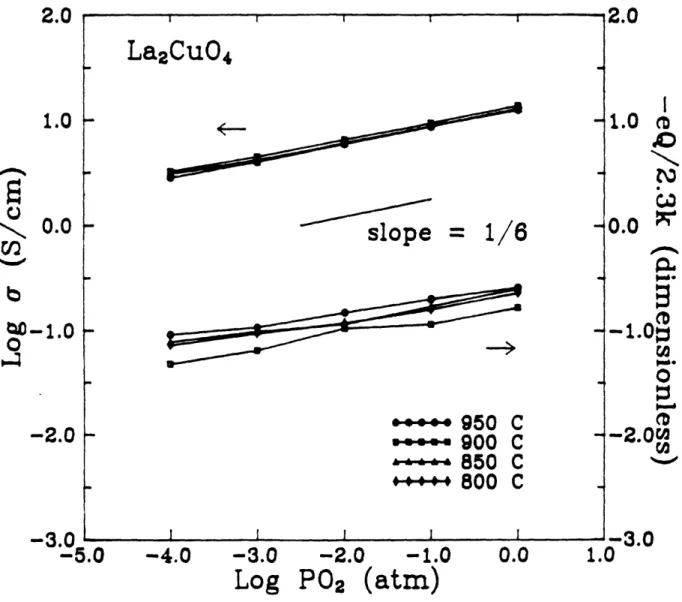
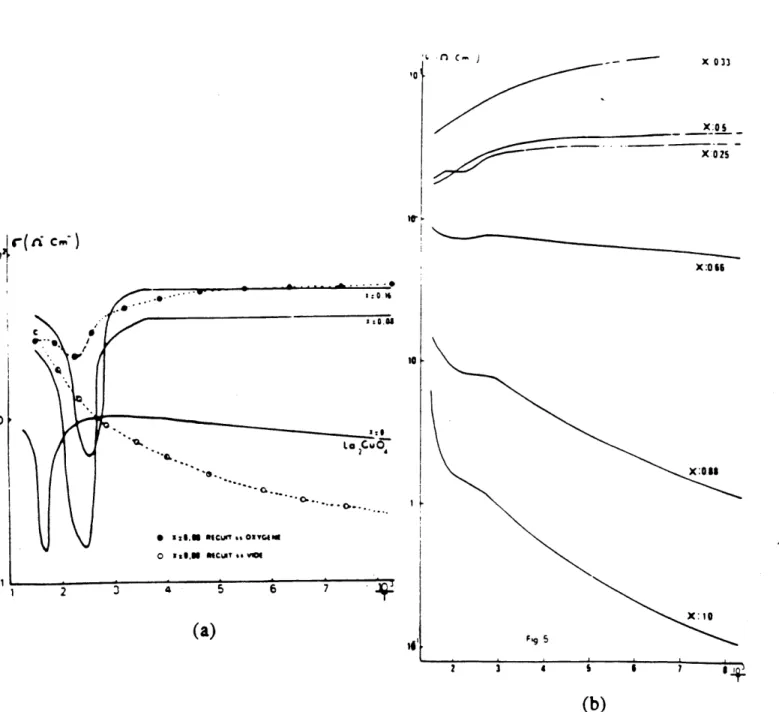
s-bonding 3d electrons of La2CuO 4 (a) [Goodenough, 1973] and (b) [Singh et al., 1984...2 9 Fig. 2.1.7 Conductivity (a) and thermoelectric power (b) of La2CuO4
vs. log PO2 [Su et al., 1990]... 3 1
Fig. 2.2.1 Unit cell of Nd2CuO4 structure [Muller-Buschbaum et al.,
1975)... 35 Fig. 2.2.2 Variation of the a and c lattice parameters as a function of x for Nd2CuO4 [Wang et al., 1990]... 3 5
Fig. 2.2.3 Oxygen nonstoichiometry of Nd2CuO4 (a) and Nd2
-xCexCuO4+8 (b) as a function of oxygen partial pressure and temperature [Suzuki et al., 19901...3 7
Fig. 2.2.4 Fig. 2.2.5 Fig. 2.2.6 Fig. 2.3.1 Fig. 2.3.2 Fig. 2.3.3 Fig. 2.3.4 Fig. 2.3.5 Fig. 2.3.6 Fig. 3.1.1
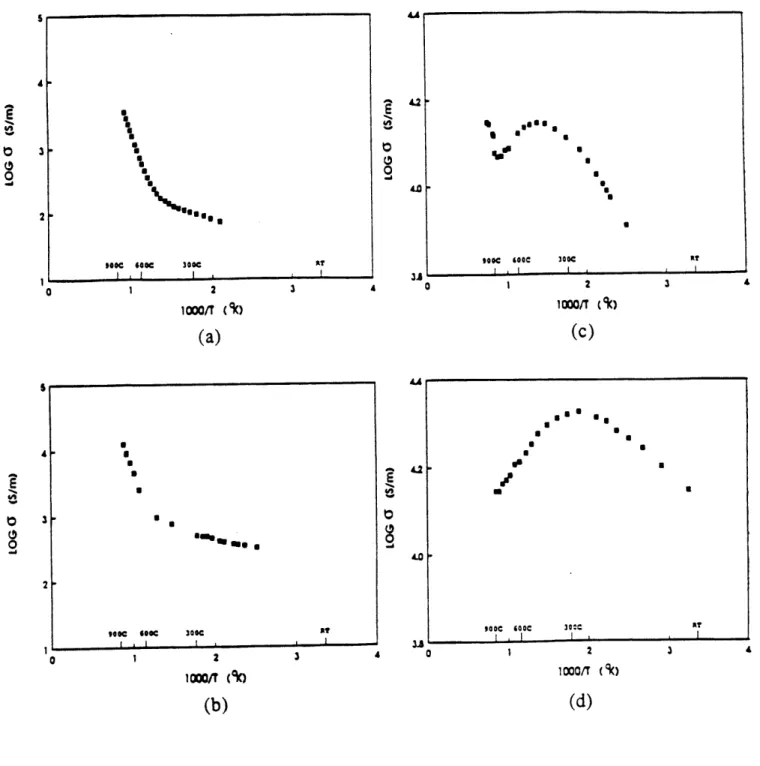
Log (conductivity) of Nd2-xCexCu0 4.8 vs 1000f for (a) x = 0, log(Po 2) = 0, (b)x = 0, log(Po 2) = -3.5, (c) x = 0.05,
log(PO2) = 0, and (d) x = 0.05, log(PO2) = -3.9 [Mehta et al.,
1989]... . . 3 8 Log (conductivity) of Nd2-xCexCuO 4.6 vs. log(PO2) (a) x = 0 and (b) x = 0.05 at various temperatures [Huang et al.,
1989]... . .. 4 0 Schematic Brouwer diagram of defect concentrations vs. dopant concentrations in Nd2-xCexCu04 or La2.xBaxCuO4 (a) and reduced thermoelectric power(b), and electrical conductivity (c) vs. dopant concentration of Nd 2 -xCexCu0 4+s [Pieczulewski et al., 1989]...4 2
Structure of YBa2Cu306+....-..---.--...-.---. . . 44
Temperature dependence of the normalized resistance of YBa 2Cu 3-xA20 6+s., where A = Cr, Mn, Fe, Co, Ni and Zn [X iao et al, 1987]... 4 4 Log (conductivity) (a) and thermoelectric power (b) vs. 1000/T for YBa 2C u 30 6+8 measured at a series of controlled PO2's as indicated [Choi et al.,1989]...47 Log (conductivity) (a) and thermoelectric power (b) vs. log (P0 2) for YBa 2Cu 306+8 measured at a series of controlled temperatures as indicated [Choi et al.,1989]. 4 9 Reciprocal of oxygen exponent (na) as a function of temperature for YBa2Cu306+8 [Nowotny et al., 1990]... 5 1 Log (conductivity) (a) and thermoelectric power (b) vs. 1000/T for YBa 2Cu 30 6+8 with fixed values of 8 [Choi et
al.,1989]... . . 5 2 Log (carrier density) vs. l/T of a typical semiconductor...
Fig. 3.2.1 Fig. 3.2.2 Fig. 3.2.3 Fig. 3.2.4 Fig. 4.2.1 Fig. Fig. 4.2.2 4.2.3 Fig. 4.2.4 Fig. 4.2.5 Fig. 4.2.6 Fig. 4.2.7 Fig. 4.3.1 ... 5 7 Log (defect concentration) vs. log (PO2) of La2-xSrCuO4.3
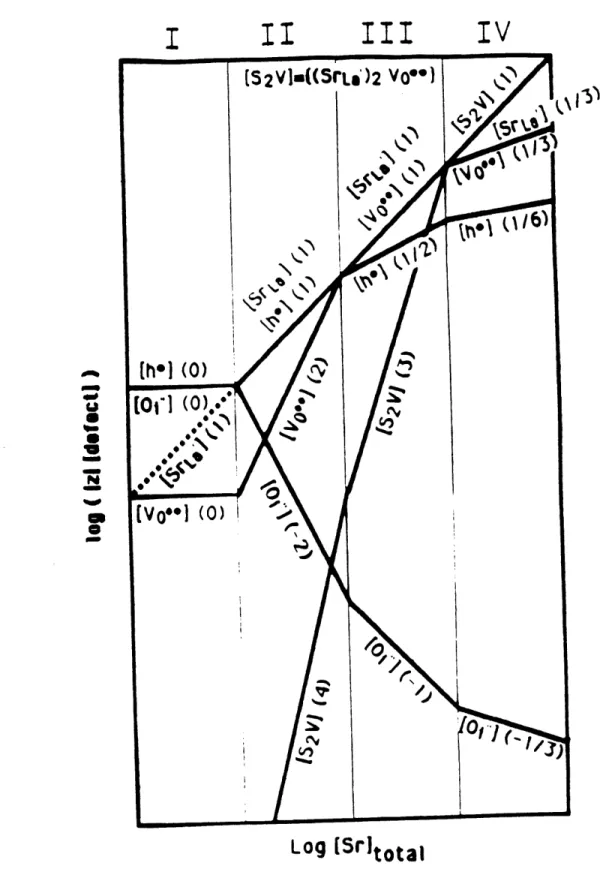
(after Opila and Tuller [1990])...7 3 Log (defect concentration) vs. log ([Sr]tot) of
La2-xSrxCuO4.-8 (after Opila, Tuller, Wuensch and Maier [1990])...7 5
Log (defect concentration) vs. log (P0 2) of Nd2-xCexCuO 4.-8 forC e as a donor... 7 9 Log (defect concentration) vs. log (P0 2) of Nd2-xCexCuO 4.-8 for C e as an acceptor... 8 1 Typical I-V curve of a 4-probe DC conductivity m easurem ent... 9 4 Configuration of the multi-sample holder...9 5 Configuration of the sample holder for measuring conductivity and thermoelectric power...9 7 Typical AV vs. AT curve by heat-pulse technique for
thermoelectric power measurement...99 Thermoelectric power of LaSrCuO4.3 vs. 1000/T in oxygen
measured by both constant temperature gradient and heat-pulse m ethods... 1 0 1 Thermoelectric power vs. temperature gradient of
LaSrCuO4.8 at constant average temperatures in oxygen... ... ... 1 0 2 Thermoelectric power of Pt vs. temperature...105 X-ray diffraction patterns of LaSrCuO4- (a), and La2CuO4.
Fig. 4.3.2 Fig. 4.3.3 Fig. 4.3.4 Fig. 4.3.5 Fig. 4.3.6 Fig. 5.1.1 Fig. 5.1.2 Fig. 5.1.3 Fig. 5.1.4 Fig. 5.1.5 Fig. 5.1.6 Fig. 5.1.7 Fig. 5.1.8
X-ray diffraction patterns of Ndi.8Ceo.2Cu0 4. (a) and
N d2CuO 4.8 (b)... 11 0
X-ray diffraction patterns of YBa2Cu 2.9TiO.106+8 (a) and YBa2Cu306&+ (b)... 11.1
SEM micrographs of the calcined powders of LaSrCu0 4.3
(a) and Nd2Cu04+4 (b)...11 2
TEM images of the as-sintered Lal.82Sro.18Cu04-8 (a) and LaSrCuO 4.8 (b) samples...11 3 TEM images of La2CuO4.8 taken in-situ at (a) 348 *C, (b) 340 *C, (c) 320 *C, and (d) 300 *C...11 4 Resistivity of La2CuO 4.8 vs. temperature in various PO2's.
... 1 1 7 Resistivity of La2CuO 4.8 vs. temperature cooled in 1 atm 0 2... 1 1 9 Thermoelectric power of La2CuO 4. vs. temperature in 1
atm 0 2... 1 2 1 Log (a) and normalized thermoelectric power of La2CuO 4.8 vs. log(PO2) at various temperatures...1 22 Normalized thermoelectric power of La2CuO4.8 vs. log (a) at various tem peratures... 124 Log (a) of La2-xSrxCu0 4.8 vs. 1000/T in 1 atm 02 for various x's (0.0 5 x s 0.3)...1 25 Log (a) vs. log(Po 2) of La2-x.SrxCu04-8 at 800 *C for various
x's (0.0 x s 0.3)... 12 6 Resistivity of La1.85Sro.i 5CuO 4.5 vs. temperature for
Fig. 5.1.9
Fig. 5.1.10
Fig. 5.1.11
Fig.
various x's (0.4 x :5 1.0)...129 Log (a) of La2-xSrCuO4. vs. x at 800 *C in 1 atm 02...130
Log (a) of La2-xSrCu04.8 vs. log(Po 2) at various temperatures for (a) x = 0.4, (b) x = 0.5, (c) x = 0.6, (d) x = 0.8, (e) x = 0.9, and (f) x = 1.0... 13 1 5.1.12 Log (a) vs. log(PO2) of La2.SrxCu0 4.8 for various x's (0.4 < x s 1.0) at (a) 700 *C, (b) at 800 *C and (c) 900 *C... 138 Fig. 5.1.13 Fig. 5.1.14 Fig. 5.1.15 Fig. 5.1.16 Fig. 5.1.17 Fig. 5.1.18 Fig. 5.1.19 Fig. 5.2.1 Fig. 5.2.2
Log (a) of LaSrCuO4.8 vs. 1000/T in various P02's...142
Normalized thermoelectric power of LaSrCu0 4.3 vs. 1000/T in various PO2's...144 Log (a) and normalized thermoelectric power of LaSrCu0 4.8 vs. log (PO2) at various temperatures...146 Normalized thermoelectric power vs. log (a) of LaSrCu0 4.8 at various tem peratures... 14 7 Log (a) vs. time of LaSrCuO4.- annealed at 950 *C in
various P0 2's... 1 4 9 Log (a) vs. 1000/T of LaSrCu0 4.- cooled in various PO2's at
constant 5... . . 1 5 1 Log (a) and normalized thermoelectric power vs. 1000/T of LaSrCuO4.8 in 100ppm 02 at constant 8...1 52 Log (a) and normalized thermoelectric power vs. 1000/T of Nd2Cu04. in I atm 02...1 54
Log (a)
Numbers
vs. 1000/T of Nd2Cu04.a in various P02's.
in the parentheses indicate how much the true magnitudes of conductivity have been shifted on the vertical log scale for clarity...15 6
Fig. 5.2.3 Fig. 5.2.4 Fig. 5.2.5 Fig. 5.2.6 Fig. 5.2.7 Fig. 5.2.8 Fig. 5.2.9 Fig. 5.2.10 Fig. 5.2.11 Fig. 5.2.12 Fig. 5.2.13 Fig. 5.2.14
Normalized thermoelectric power vs. 1000/T of Nd2Cu0 4.
6 in various PO2's... 15 7
Log (aT) and normalized thermoelectric power vs. 1000/T of Nd2Cu04.5 in 1 atm 02... ...-... 1 15 8
Log (a) vs. 1000/T of Nd2CuO 4.- in various P0 2's at
constant 8... . .1 6 0 Normalized thermoelectric power vs. 1000/T of Nd2CuO4.
8 in various PO2's at constant 8... 1 6 1 Normalized thermoelectric power vs. log (a) of Nd2Cu0 4.8
at constant 8 in (a) 0.1% 02, (b) 350 ppm 02 and (c) 100 ppm 0 2... . ---... ... . 16 4 Log (T) and normalized thermoelectric power vs. 1000/T of Nd2CuO4.8 in 100ppm P0 2 isobarically and at constant
8... 1 6 7 Log (a) vs. log (P0 2) of Nd2CuO 4.8 at various temperatures.
... ... 1 6 8 Normalized thermoelectric power vs. log (Pa 2) of
Nd2CuO4. at various temperatures... 170
Normalized thermoelectric power vs. log (a) of Nd2Cu0 4.8
at various temperatures... .... 171 Log (a) vs. 1000/T of Nd2.xCexCuO4.3 cooled in 1 atm 02
for various x's... ... .---.----. 17 2 Log (a) vs. x of Nd2-xCexCu04.8 in 1 atm 02 at various
temperatures... . ...--- 1 7 4 Log (a) vs. time of Nd2-xCexCuO4- annealed at 900 *C in various Po2's...1 75
Fig. 5.2.15 Fig. 5.2.16 Fig. 5.2.17 Fig. 5.2.18 Fig. 5.3.1 Fig. 5.3.2 Fig. 5.3.3 Fig. 5.3.4 Fig. 6.1.1 Fig. 6.1.2 Fig. 6.1.3 Fig. 6.1.4 Fig. 6.2.1 Fig. 8.1.1
Log (a) of Nd2-x.CexCu0 4.s vs. log (P0 2) for various x's at (a) 800 *C, (b) 850 *C, (c) 900 *C, (d) 950 *C, and (e) 1000 *C ... 17 6 Log (a) of Nd2-x Ce CuO 4.8 vs. log (P0 2) at various temperatures for (a) x = 0.00, (b) x = 0.01, (c) x = 0.05, (d) x = 0.10, (e) x = 0.15, and (f) x = 0.20... 181
Log (a) and normalized thermoelectric power vs. 1000/T of Ndi.85Ceo.15Cu04.8 in 1 atm 02....---...---...1 8 8 Log (a) and normalized thermoelectric power vs. log (P0 2)
of Nd .85Ceo.15Cu04. at 800 *C...1 89
Log (a) vs. 1000/T of YBa2Cu 3-xTix06+8 in (a)1 atm 02, (b)
10% 02, (c) 1.0% 02, (d) 0.1% 02, (e) 100 ppm 02... 190 Log (a) vs. time of YBa2Cu3-xTix0 6+8 cooled in 100 ppm 02.
... 1 9 6 Log (a) vs. 1000/T of YBa2Cu2.9Tio.10 6+8 cooled in various
PO2's... ... ... 19 7 Log (a) vs. log (P0 2) at various temperatures of YBa2 Cu3-xTix0 6+6 for (a) x = 0.005, and (b) x = 0.10... 198 Kroger-Vink diagram for La2Cu0 4±3... ... . ... .. .. ... .. . 205
Log (a) vs. log (x) of La2-xSrxCuO4-8 (0 < x s 0.3)... 209 Resistivity vs. temperature of La2-xSrxCuO4.3 (0.4 x
0.8) in 1 atm 02...--..---... 214 Pseudo-ternary diagram of La203-SrO-CuO system... 218 [Log (a) + 2Log (8)] vs. log (P0 2) of (a) Nd2CuO4.O-8 and (b)
Nd2Cu03.9993---... ... .... . . 224
List of Tables
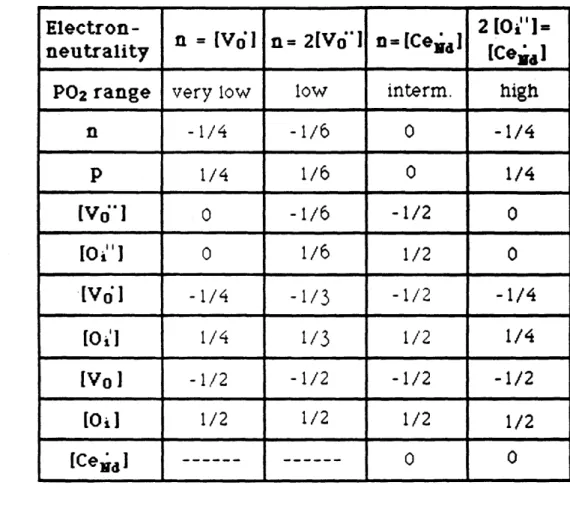
Table 3.2.1 P02 dependence of defect concentrations in Nd2
.-xCexCuO4.8 system for Ce as a donor...7 8
Table 4.1.1 Chemicals used for powder preparation by solutions...8 6 Table 4.1.2 Chemicals used for powder preparation by oxides...8 7 Table 4.1.3 Compositions and processing of the samples made in this research... 8 9 Table 4.1.4 Compositions of La2.xSrxCu04.a (x = 0.0 and 0.15)
analyzed by inductively coupled plasma emission spectrom etry... 9 0
Table 5.1.1
Table 5.2.1
Table 6.1.1
Activation energies (AE) in eV of conductivity and PO2 power law dependence (n) of conductivity of at 800 *C (a Oc (Po2)n) of La2-xSrxCuO4...1 4 1
Activation energies (AE) in eV of conductivity (a), thermoelectric power (Q), and (aT) of Nd2CuO4- in
various temperature and P0 2 ranges for both isobaric cooing and fixed composition cooling... 162 Conductivity, hole concentration and mobility of La2-,SrxCu04.- at 800 *C 1 atm 02... ...2 11
Acknowledgement
First of all I want to express my gratitude to Professor Harry Tuller for his enduring support and guidance during these years. His advices and encouragements are crucial to the completion of this thesis.
My next thanks go to Gyeong Man Choi, whose experiences and works prior to this research has greatly lessened the energy required for the experiments.
I appreciate the inspiring discussion with Elizabeth Opila and Marlene Spears.
I cherish the friendship of Marlene Spears, Elizabeth Opila, Steve Kramer, other members of the group, Thao Nguyen, Jenq-Yang Chang and many other people. They have made my life in MIT and this country enjoyable
Finally I thank my family for their unselfish and persistent support.
Chapter 1
Introduction
Research on the high Tc superconductors started its history less than five years ago when Bednorz and Muller reported the 35 *C Tc superconductivity of Lai.82Ba.18CuO 4-8 in 1986 [Bednorz and Muller
1986]. The potential importance of these materials to the under-standing of the basic science of superconductivity and applications has made them among the most studied materials in human history. These high Tc superconductors also exhibit one of the most interest-ing and complex interplays between chemistry, crystal structure and physical properties of any ceramic material studied to date. A num-ber of compositional systems have since been discovered with a wide range of transition temperatures. Most of these superconductors are complex cuprates with perovskite-related structures containing Cu-O planes and/or chains. La2-x.(Sr,Ba)xCuO4.8 was the first system of the high Tc superconductors reported. The Ln2-x(Ce,Th)xCuO4+a (Ln = Pr,
Nd, Sm) system was the first cuprate system to exhibit n-type super-conductivity. These two systems are also amongst the simplest in compositions and structures among the high Tc cuprate superconduc-tors. YBa2Cu 30 6+5, on the other hand, being the first superconductor with Tc higher than the liquid nitrogen temperature and thus ex-hibiting a potentially greater impact on technology, has received the lion's share of attention. In this study we focus on the high tempera-ture transport properties and defect chemistry of these three com-positional systems in light of their relative simplicity (e.g. compared
to the Tl,Bi/Ba,Sr/Ca,Cu/O systems) and their representativeness of compositions, structures, and properties of the high Tc
superconduc-tors.
The high transition temperatures of these materials casts a great challenge on the conventional BCS theory of superconductivity.
In spite of all efforts by theorists, we can say that no one particular theory so far can explain all the observed phenomena nor can be generalized to all other materials. Electrical, magnetic, optical tions, connected with structural transitions, metal-insulator transi-tions, and antiferromagnetic transitions have been studied for corre-lation to the high Tc transitions. It is known that these properties are usually related to one another. But the details of these relation-ships are still controversial and not well established due to the high sensitivity of these properties and transitions to the thermal history, composition and local structure. This sensitivity demonstrates the importance of proper and careful processing. It also serves as a good example of how we can manipulate these transport properties by fine adjustment of the preparation parameters if we understand the relationships well enough.
These compounds can often accommodate a relatively large oxygen non-stoichiometry in certain temperature ranges and/or re-main stable with high concentration of dopants. In this research we study the defect structures and transport properties of these mate-rials by systematically measuring the electrical conductivity and thermoelectric power as functions of dopant concentration, tempera-ture and oxygen partial pressure in order to delineate the individual effects on the properties. These data are also correlated where
sible to other literature data connected with the defect structure and transport properties of these systems. The measurements are taken at temperatures approximating those at which these materials are processed to insure a rapid approach to equilibrium and to provide in-situ information relevant for evaluating the defect structures.
The defect chemistry of these high Tc superconductors is somewhat different from traditional ionic compounds in that the Cu-O bond in the basal plane, which plays a key role in electronic trans-port, is highly covalent. The electronic band at the Fermi level is highly hybridized due to the proximity in energy between copper 3d and oxygen 2p states. The valence state of Cu and its concentration are thus not so easily defined as in the ionic cases. However the chemistry of oxide superconductors cannot be discussed without ref-erence to oxidation states. The idea of discriminating oxidation state and real charge of copper and other ions proposed by Sleight [1988] seems to be a good approach to solve this dilemma and is adopted in this study.
Chapter 2
Literature Review
This chapter is separated into three sections, each of which is devoted to one compositional system. Each section begins with a description of the crystal structure, solubility range for other elements and the oxygen stoichiometry. The electrical transport properties are discussed next. Finally the defect chemistry is reviewed. Because of the vast literature on high Tc superconductors in recent years it is almost impossible to make a general review covering all the phenomena in this thesis. In this chapter only the
high-temperature features of the structures and related transport
properties and defects will be reviewed. It is worth noting that some of the data or implications of these reports are obviously in conflict with each other. Specific issues which are still open to controversy will also be addressed.
2.1 La2-xSrxCuO4.8
Before La2-. SrxCuO 4 was discovered to be a superconducting oxide, the structure and transport properties of this compound had been examined by a number of groups [Foex, 1961, Longo and Raccah,1973; Ganguly and Rao, 1973; Goodenough, 1973; Nguyen et al., 1981; Nguyen, Studer and Raveau, 1983; Singh, Ganguly, and Goodenough, 1984; Michel and Raveau, 1984]. Low temperature properties were examined but the temperatures were not low enough to induce the superconducting transition. All of these studies
were focused on the structure and properties of the material in its normal state.
2.1.1 Structure, Solid Solution and Stoichiometry
Undoped La2CuO 4. has the K2NiF4 structure, which consists of alternate KF rock salt and KNiF3 perovskite layers along the c-axis (Fig. 2.1.1). At room temperature it has a distorted orthorhombic structure with a = 5.363
A,
b = 5.409A
and c = 13.17A
[Longo and Raccah, 1973]. In La2CuO4.- the copper atoms are coordinated to six oxygen atoms, which sit at the corners of an elongated octahedron. The Cu-O bond length in the equitorial plane (2.4A)
is longer than in the c-axis (1.9A)
in contrast to Nd2CuO443 which has two short andfour long Cu-O distances [Longo and Raccah, 1973]. These copper-oxygen octahedra are joined to one another at the four corner copper-oxygen atoms closest to the copper so that it allows three dimensional space to be filled in a highly two-dimensional manner. This structure undergoes a transition to a tetragonal phase at = 300 *C. At low temperatures several structural transitions have also been reported
[e.g. Skelton et al., 1987]. The orthorhombic-tetragonal transition in the undoped material tends to occur at lower temperature or is completely suppressed when it is doped with a small amount of Sr or Ba. This structural transition seems unrelated to superconductivity since it was found that the structural transition at low temperatures stops near x = 0.19, whereas Tc disappears near x = 0.25 [Torrance et al., 1989].
When doped with alkaline earth metals the oxides La2 -xAxCuO 4.8 (where A = Ca, Sr or Ba) retain the same K2NiF4 type
A B x
Fig. 2.1.1 Unit cell of La2CuO4 structure A: La atom, B: Cu atom, and C:
0 atom [Longo and Raccah, 1973)
I / / lOObarO£2 £ £ £ C 0 3,-02 06 08 0 £ £ + f Sf Content a
Fig. 2.1.2 Hole concentration of La2.xSrxCu04. vs. x [Sreedhar and Ganguly, 1990; the open and circles from Torrance et al.,
structure. Their oxygen content depends on the nature of the A ions and on the substitution rate x which can lead to wide homogeneity ranges: 0 s x 0.2 for A = Ca and Ba and 0 s x s 4/3 for A = Sr
[Michel and Raveau, 1984]. Within the crystal structure, Sr or Ba, which are similar in size of La, occupy the sites of La at random. The most reduced phase which exhibits the highest deviation from stoichiometry has been synthesized: La2/3Sr4/3CuO3.33 [Nguyen et al.,
1981]. For x > 1 superstructures derived from the tetragonal cell (a ~ n*aLasrcuo 4, with n = 3, 4, 4.5, 5, 6) due to the oxygen vacancies in the Cu-O plane have been observed by X-ray and electron diffraction [Nguyen et al., 1981; Sreedhar and Ganguly, 1990].
The doping of Sr on the La site initially is compensated by the generation of holes while the oxygen content remains relatively constant in the range of ( 0.0 < x < 0.33). Further doping, on the other hand, is compensated by the formation of oxygen vacancies. These phenomena have been observed by oxygen stoichiometry measurements by TGA studies [Nguyen, Studer and Raveau, 1983; Michel and Raveau, 1984; Sreedhar and Ganguly, 1990] and lattice parameter measurement by XRD [Nguyen et al., 1981; Sreedhar and Ganguly, 1990]. The evolution of the hole concentration as a function of x in the La2-xSrxCuO4.8 system is shown in Fig. 2.1.2. [Sreedhar and Ganguly, 1990]. The transition in the compensation mechanism can be deferred by annealing the sample in a pressurized oxygen environment [Torrance et al., 1988].
The lattice parameters, c/a ratio, and the molar volume of the series La2-x.SrxCuO4. (0.1 s x s 1.2) are plotted in Fig. 2.1.3 as functions of x [Sreedhar and Ganguly, 1990; Nguyen et al., 1981]. In
(a) 37
372
r
370-(b) I I 025 050 075 95->. 91-E > 931-E 92~. (c) (d) 3 50-3 40 0 2 0 0 6 08 10 12 100 t25Variation of the a (a), c as a function of x in the and Ganguly, 1990; Nguyen et al., 1981].
(b), molar volume (c) and a/c (d)
La2.SrxCuO4.3 system [Sreedhar
open circles and triangles from
13
3-Fig. 2.1.3
'
the range 0.0 < x < 0.33 the c parameter increases gradually while the a parameter show a decrease. The c/a ratio reaches a maximum around x = 0.33, up to which there is no oxygen deficiency. The increase in the c/a ratio in this range is dependent on two factors: (i) the relative size of the substituent ions and (ii) the change in the Cu-O network in going from Cu2+ ions to low-spin Cu3+ ions. The decrease in the c/a ratio for x > 0.33 is associated with the formation of oxygen vacancies.
2.1.2 Transport Properties
Most electrical property measurements are made at low temperatures. These properties are highly dependent on the thermal history and vary from one sample to another. Only a limited number of studies have focused on high temperature properties and defect chemistry.
Ganguly and Rao [1973] first measured the conductivity and thermoelectric power of La2CuO4.- from room temperature to - 1000 *K. Results are shown in Fig.2.1.4. The low and nearly
temperature-independent resistivity (- 0.16 ohm-cm) suggests metal-like conduction. The positive, high, and also near temperature-independent
(~
250 gV/*K) thermoelectric power is consistent withconduction by holes. The effect of the oxygen partial pressure on the properties is not mentioned and the measuring environments were not specified. The first systematic high-temperature measurements related to the doping effect of impurities on the electrical properties were performed by Nguyen et al. [1983] Their data (Fig. 2.1.5) show that for x s 0.25 the conductivity increases with x but is independent
!
1000 1 1.0 2.0 3 0 2.0-0e 00. 1*0 20 3 0 16 C S 6'0 70 It 1000 1 (a) 0 0: 0 0 0 : 0 0 0-00 .0 0 So C 0 0 "0 0 t00 (a) 0 £0 .Fi 2.. g. eitvt [Ganguly a n an a 1973]hrol 2ctrcpweOb&f nC
-740
' 00000o
Fig. 2.1.4 Resistivity (a) and thermoelectric power (b) of Ln2CuO4
_____________________ A
0 t aIN MCAT. s .Vol
2 3 4 5 6 7 (a) X: 10 Fig 5 2 3 4 1 6 7 (b)
Fig. 2.1.5 Variation of conductivity as a function of 1/T of La2. xSrCuO4.8 for 0 s x s 0.16 (a) and for 0.25 s x s
[Nguyen et al., 1983]. L, C.-X 033 x:0 1 X:02S X:066 1.0 (b) o 0 r
cm-of temperature below - 300 *K. It decreases to a minimum at intermediate temperatures and then increases with temperature again. These measurements were performed .in air. The conductivity anomaly observed at intermediate temperatures was related to oxygen intercalation at that particular temperature [Michel and Raveau, 1984]. For 0.33 s x s 1.0 the conductivity decreases with x and the slope changes sign so that conductivity increases with temperature above x - 0.66. There is also a transition in slope at high temperature for x > 0.66. Recently Gurvitch and Fiory [1987] also observed linear p(T) behavior in Lal.825Sr.175Cu04 from below Tc
to 1100 *K and suggest weak electron-phonon coupling of the transport phenomenon. Sreedhar et al. [1990] measured the resistivity with x in the 0 x 5 1.2 at low temperatures. However the resistivity of LaSrCuO4.6 is unusually small, contradictory to the results by Nguyen et al. [1981]. The initial increase in conductivity with x is related to the increase of hole concentration with the dopant [Tsai et al., 1988]. The decrease in conductivity at higher values of x (0.5 < x < 1.2) is related to the disorder-induced localization due to the creation of oxygen vacancies [Sreedhar and Ganguly, 1990].
La 2.xSrxCu04.5 shows apparent metal-nonmetal transitions both with temperature and composition. For example the undoped material is metallic [Ganguly and Rao, 1973; Nguyen et al., 1981] at high temperature and insulating at low temperature [e.g. Guo et al., 1988]. The Ba-, Sr-doped or highly oxidized sample on the other hand becomes metallic at all temperatures above Tc [e.g. Gurvitch and Fiory, 1987]. Most of these transitions from the narrow band
case are related to or associated with structural distortions or antiferromagnetic ordering to explain the abrupt disappearance of the band gap. Although antiferromagnetic ordering or structural distortion have been observed they do not always occur at the metal-nonmetal transition (i.e. from positive temperature coefficient to negative temperature coefficient of resistivity) temperature and composition; the correlation and interpretation of these phenomena remain controversial. When heavily doped (x > 0.66) the material seems to become semiconducting [Nguyen et al., 1983]. This may be due to Anderson localization connected with superstructure ordering resulting from the high oxygen vacancy concentrations.
To interpret the transport phenomena, Goodenough, applying crystal-field theory, proposed a schematic band diagram for La2Cu04 [Goodenough, 1973] and a later refinement [Singh et al., 1984] (Fig. 2.1.6). Goodenough argued that covalent mixing of the 3d orbitals with the nearest-neighbor 02--ion 2p orbitals could be neglected because it does not change the symmetry; only 3d bands of Cu in the vicinity of the Fermi level were considered since the 0 2p band position was viewed as being well below the Fermi energy. But recent calculations and experimental results show that the holes have substantial 0 2p character. [e.g. Mattheiss, 1987; Bullett and Dawson, 1987; Takegahara et al., 1987]. Consequently, a simplified model based only on Cu 3d bands may not be adequate.
2.1.3 Defect Chemistry
Nguyen et al. [1981] observed some effects of the oxygen atmosphere on the conductivity, implying that defects could be
DENSITY OF STATES Cr *2 J2. y2 d 2 2Cui I , - - - E E U*> W U- W- -- - -EdI2 Cu:: z2 2 2 C X2_ y2 N ( E) -(b) (a)
Fig. 2.1.6 Schematic density of states vs. energy diagrams for the s-bonding 3d electrons of La2CuO4 (a) [Goodenough, 1973] and (b) [Singh et al., 1984].
studied by electrical measurements. But they provided no quantitative description of the relationship between them. Recently Su et al. [1990] measured the high temperature (650 - 850 *C )
electrical conductivity and Seebeck coefficient as functions of oxygen partial pressure and temperature in La2Cu0 446. They found a 1/6
power dependence of both conductivity and Seebeck coefficient on P0 2 (Fig. 2.1.7), which implies the following redox reactions and electroneutrality condition:
1/2 02 (g) = Oi" + 2h'; KOX = [Oi"]p2P 0 2-1/2 and
p = 2[0;"] = (2Kox)1/3Po21/6.
A hole mobility of 2.07 cm2/Vsec (We calculate a value of 0.207 c m2/Vsec based on their data) was obtained by them from the conductivity and reported values of oxygen excess which was assumed to be in the form of doubly ionized oxygen interstitial (peff =
a/(28e)). This mobility value precluded the small polaron transport mechanism they previously had suggested [Su et al., 1989]. They obtained 8 from the calculation of thermoelectric power which is based on the following equation:
Q
= k/e[ln(Nv/p) + A],where NV is the effective density of valence states and A is a constant related to the entropy of transport. However applying this equation, derived for a case of a non-degenerate semiconductor, to La 2Cu0 4.3, a degenerate semiconductor (or metal), appears to be questionable. This argument also applies to their thermoelectric power calculations for La2-xBa 1CuO4- [Su et al., 1988].
1.5c 1.30 -
#%1.10-E
C
0.90-U 0.70 0.50 0.30 -. 0 T=850*CSlope=
/ ^ -4.0 -3.0LOG
P0-2.0 2 (ctm)-1.0 (a) -0.80 - 1.001.20 -C -1.40 - -1.60--1.8018 -3 0LOG
p02 (b) -00 (atm"Conductivity (a) and thermoelectric power (b) of La2CuO4 vs. log P02 [Su et al., 1990].
0.0 1.0 Fig. 2.1.7 I 2 u0 . 1 9 V T I I V T I I . . --2.00 - 5.0 C)
Theoretical calculations of the defect reaction energies have been performed on this system by two groups in England. Islam et al. [19881 found by defect simulation that the formation of Cu3+ is energetically preferred to that of 0- and that there is a large energy barrier (4.2 eV) to the Cu2+ disproportionation reaction. However, the doping of the material and its oxidation are energetically favoured (-0.29 and -0.25 eV respectively), implying that the formation of holes is favored over that of oxygen vacancies upon doping. This is consistent with the experimental data for small x (< 0.3) only, since for large x, oxygen vacancies form. Allan and Mackrodt [1988] calculated that VLaf' and holes h* are the majority defects and that copper and oxygen vacancies VCu" and Vo** serve as the minority defects. The formation energy of anti-site pairs, Lacu* +
CuLa', and Frenkel energies are high (> 4 eV). The calculations also predict strong electron/hole-lattice coupling. From the formation energy of the defects they consider the major redox reaction as:
LaLax + 3/4 02 (g) -+ VLa"' + 3h' + 1/2 La20 3.
From the mass action and electroneutrality equations, [VLa"'][h'] = K10P0 23/4exp(-E1/kBT),
and
3[VLa"'] - [h']
they derived a PO2 power dependence of 3/16 for [VLa'"] and [h']. [h'] = (3K 10)1/4Po 23/16exp(-E1/4kBT).
Unfortunately these relationships are not observed by conductivity or TGA measurements. This may be due to the fact that they neglected the oxygen interstitials which have been observed in oxidizing atmosphere [e.g. Chaillout et al., 1989]. The other
possibility is that the values they obtained are based on calculations at 0 *K, which might not be good at high temperatures.
The nature of the holes has been the focus of many studies. Emery [1987] proposed a theory based on the antiferromagnetic ordering of the Cu spins which requires 0 2p band holes in La2CuO4. Allan and Mackrodt [1988] suggested that this may not be the case and Cu3+ and 0- might both exist in La2CuO4. There is experimental evidence both for [e.g. Tranquada et al., 1987] and against [e.g. Alp et al., 1987] oxygen related holes. Sleight [1989] pointed out it is not proper to ask whether the hole is associated with an oxygen or a copper since there is a high degree of copper-oxygen admixture near the Fermi level. An alternative and perhaps more accurate description of this, which reflects the strong pda nearest-neighbour interaction between the Cu 3dx2-y2 and 0 2px.y orbitals, is that the holes are delocalized over Cu and 0 (covalent rather than ionic) atoms giving complexes of the type that Shafer et al. [1987] have designated as (Cu-0)+.
2.2
Nd2.xCexCuO4.
Tokura et al. [Tokura et al, 1989] and Takagi et al. [Takagi et al., 1989] recently discovered that this is the first high Tc superconducting oxide system with electrons as charge carriers. Unlike the other two systems in this study, it shows superconductivity above a critical electron density achieved by Ce doping with an x value between 0.14 and 0.18 and/or by thermal treatment under a low partial pressure of 02 at temperatures higher than 1000 *C [Hor et al., 1989]. The structure and properties of
undoped Nd2CuO 4 had been studied previous to its discovery as a
high Tc superconductor, as in the case of La2.xSrxCuO4.8 system.
2.2.1 Structure, Solid Solution and Stoichiometry
In 1973 when Ganguly and Rao [1973] and Goodenough [1973] studied the electrical properties of Nd2CuO4 they mistakenly
assumed that this material had the same structure as La2CuO4 (K 2NiF 4 structure). Only in 1975 [Muller-Buschbaum and Wollschlager, 1975] was it pointed out that it has a different structure (Nd 2CuO4 or T' structure) with a = 3.9422
A
and c = 12.168A
as shown in Fig. 2.2.1. The Nd2CuO4-type oxides are tetragonal with 14/mmm space group. Compared to La2CuO4 (Fig. 2.1.1) the cation positions are exactly the same. The major difference is that the apical oxygens of the Cu-0 octahedra are shifted so that it is composed of sheets of Cu-O squares. The coordination number of Cu is 6 (octahedra with Jahn-Tellar distortion) in (La, M)2CuO4 while it is4 (square planar) in Nd2-xCexCuO4..8 Nd2.xCexCuO4.- forms solid solution within the homogeneity region 0 < x < 0.2 even though sometimes second phase may appear for x < 0.2 [e.g. Markert et al., 1989]. The oxidation state of Ce is believed to be nearly 4+ based on iodometry and examination of the unit cell dimensions [e.g. Huang et al., 1989b].
Variation of the lattice constants has been studied as a function of dopant [e.g. Huang et al., 1989b; Wang et al.,1990]. The c axis decreases and a axis increases with increasing x as shown in Fig. 2.2.2. The variation of the c axis can be simply understood based on the ionic radius of the dopant (Ce4+: 1.11
A)
versus the host (Nd3+:0
0
0
0 0
0
Fig. 2.2.1 Unit cell of Nd2CuO4 structure
AM 0 4 [Muller-Buschbaum, 1975]. 0 0 0.1 0.2 0.3
x in Nd
2.xCeCuOz
Fig. 2.2.2 Variation of the a and c lattice parameters as a function of x for Nd2CuO4 [Wang et al., 1990].
.Nd
*CU
00
1.25
A).
The increase of the a parameter could be due to the charge transfer from Ce3+ to the (Cu-0) so that the bond is lengthened [Wang et al., 19901.Nd 2.,CexCuO4. is generally accepted to be oxygen deficient [Markert et al., 1989; Takayama-Muromachi et al., 1989; Suzuki et al., 1990; Izumi et al., 1989; Williams et al., 1989] for x = 0 to 0.2 although oxygen excess has also been reported [Moran et al., 1989; Wang et al.,1990]. Partial ordering of these oxygen vacancies have been observed by neutron diffraction [Izumi et al., 1989] and high-resolution TEM [Williams et al., 1989]. These vacancies proved to be preferentially introduced at site 0(2), but site 0(1) may also become slightly deficient upon thermal treatment under low partial pressures of 02 [Izumi et al., 1989]. Fig. 2.2.3 show how the oxygen stoichiometry changes as functions of temperature and oxygen partial pressure for x = 0 and 0.15 [Suzuki et al., 1990].
2.2.2 Transport Properties
Ganguly and Rao [1973] were the first to measure the resistivity and thermoelectric power of undoped Nd2CuO4 and
concluded that it is an n-type semiconductor in the range 120-1000 *K. Mehta, Hong and Smyth [1989] reported that undoped and Ce-doped Nd2CuO4 behave primarily as n-type material and undergo the
"semiconductor-metal transitions" at large charge carrier concentrations by either Ce doping or chemical reduction (Fig. 2.2.4). When the donor concentration is low ( x = 0, 0.02 and 0.05) the material shows "semiconducting characteristics" in terms of electrical
-4 -3 -2 -1 log(Po2/at@) (a)
Nd1.8 5Ce0. 15Cu0
-4 -3 -2
Iog(Po2/atm)
Fig. 2.2.3 Oxygen nonstoichiometry of Nd2CuO4 (a) and Nd2
-xCeCuO4,8 (b) as a function of oxygen partial pressure and temperature [Suzuki et al., 1990].
4.00 3.99 3.98 3.97 3.96 4.000 3.998 3.996 3.994 3.992 3.990 -1 (b)
~-~--1 2 3 1(X)0/T (k) (a) -4.2 0 4 0 I000/() (C) '42 Fs 900C GOO 30^C A t 1 2 3 (b) 1000/7 () (d)
Fig. 2.2.4 Log (conductivity) of Nd2.CexCuO 448 vs 1000/T for (a) x
= 0, log(PO2) = 0, (b)x = 0, log(PO2) = -3.5, (c) x = 0.05,
log(PO2) = 0, and (d) x = 0.05, log(PO2) = -3.9 [Mehta et al.,
1989].
soU sec so
concentration increases, the material shows "metallic" behavior. Su, Elsbernd and Mason [1989] pointed out that at low cerium levels, electron conduction in Nd2-x.CexCuO4. is apparently via small polaron hopping as evidenced by a difference in activation energy for conductivity (0.79 eV) and thermopower (0.45 eV). However for the mobility to be within the small polaron regime (= 0.1 cm2/Vsec) the oxygen nonstoichiometry (8) would have to be as high as - 0.1 according to their data, which is unusually high for this material. Besides, the redox reaction that usually accompanies the isobaric cooling process was not considered. This is important especially in the undoped Nd2CuO4.6 case where the oxygen stoichiometry is
believed to be a strong function of the oxygen partial pressure and temperature [e.g. Suzuki et al., 1990].
2.2.3 Defect Chemistry
Little effort has been applied towards clarifying the high temperature defect structure of this system. Hong, Mehta, and Smyth [1989] showed that the electrical conductivity increases with decreasing oxygen partial pressure (Fig. 2.2.5), presumably due to an increased electron concentration upon reduction. Since the PO2
dependence becomes shallower with increasing donor doping, this implies that the donors are compensated by electrons. There was no quantitative description on the relationship between dopant concentration and oxygen partial pressure. Pieczulewski et al. [1989] measured the conductivity and thermoelectric power of this system and proposed a defect model involving the following reactions:
4.5 a 900 C Undoped S&00 C Undoped * 700 C Undoped 40 LOG PO 2 (Pa) (a) 0 -' 35 -1 0 Fig. 2.2.5 1 2 LOG Po 2 (PC) (b) 3 4 5
Log (conductivity) of Nd2-x.CexCuO4+8 vs. log(P0 2) (a) x = 0 and (b) x = 0.05 at various temperatures [Huang et al.,
00 -+ Vo** + Oi", KF = [Vo**][Oi"] redox reaction:
2e' + 1/202 -+ Oi", KO = [Oi"]/n 2p021/2
and electroneutrality equation: n + 2[Oi"] = 2[Vo''] + [CeNd]
to generate the Brouwer diagram in Fig. 2.2.6a. This was to be compared with the conductivity and thermoelectric power data (Figs. 2.2.6b and 2.2.6c). Again for this comparison to be made they assume that either the mobility is independent of dopant concentration or the reduced thermoelectric power is proportional to log (carrier concentration), which is applicable for nondegenerate semiconductors only. Both assumptions need further justification.
2.3 YBa2Cu3-xTixO6+8
Unlike the other two systems discussed above, YBa2Cu30 6+8 was a completely new material at the time it was announced as being a new high Tc superconductor. The incentive in investigating such formulations was to find oxides with more Cu-0 layers in the unit cell of a layered perovskite structure. This was based on the observation that the Cu-0 layer is essential to superconductivity in La 2.xSrxCu0 4.s. It was believed that an increase of the Cu-O plane or
chain density might increase Tc. This proved to be a good approach although it is difficult to maintain more than three Cu-0 layers due to phase instability resulting from structural relaxations.
O 2 ---- h or -- S'or - or V0 or
z-e' Ce4, V0,
LOG DOPANT CONCENTRATON
(a) .eC.0 4. -WWm uAJ I ___u__ .- a 7
E
1L
. 4M 850'C ., 700'C 770'C 800'C 850'C - soLOG 0OPANT CONCENTRATON
(b) e_.,u 650*C .. m700'C 4.&A. 770'C um 800*C .ULLM 850*C -N .. -. 2, -c.Ae
.OG 0CPANT CONCLNTRArwCN
(C)
Fig. 2.2.6 Schematic Brouwer diagram of defect concentrations dopant concentrations in Nd2.Ce 1CuO4 or La2-xBaCuO4 (a) and reduced thermoelectric power(b) and electrical conductivity (c) vs dopant concentration of Nd 2.
xCexCuO 4...6 (Pieczulewski et al., 1989].
.'1
~72
WA
The so-called 123 compound has a basic structure of a layered perovskite as shown in Fig. 2.3.1. In between the barium and the yttrium layers, copper atoms are coordinated with oxygen in
pyramids(Cu(II)). The bases of the copper-oxygen pyramids face one another across a plane of yttrium atom. In between two consecutive layers of barium, copper atoms are coordinated with four oxygen atoms in a flat, diamond-like shape(Cu(I)). The corners of the diamonds are connected to form a chain of diamonds.
In YBa 2Cu 307 the copper atoms have an average valence of
+2.33 in both the chains and the bases of the pyramids. When the oxygen content is reduced from seven to six, the insulator YBa2Cu306 is formed. Oxygen is removed from one crystallographic site only i.e. the one connecting Cu(I). As the oxygen content is increased, oxygen is added to the site next to Cu(I) in such an ordered way to from as many copper-oxygen diamonds as possible [e.g. Cava, 1990]. The oxygen stoichiometry is critical to many important phenomena including the occurrence of superconductivity, metal-insulator transition at low temperature, structural transitions and even the p-n trap-nsitiop-n at high temperature. For example, quenching from a higher temperature in which oxygen content is less than a certain amount destroys the superconductivity, causes removal of the orthorhombic distortion in the perovskite structure and results in a metal-insulator transition at low temperatures [Budhani et al., 1987].
Unlike the other two systems, YBa2Cu306+8 (YBCO) is superconducting without doping. The purpose of doping YBCO has been to investigate the possibility of enhancing the transition temperature, or clarifying the mechanism of high-Tc
superconducti-Fig. 2.3.1 Structure of YBa2Cu306+8
7 OO
Fig. 2.3.2 Temperature dependence of the normalized resistance of YBa 2Cu3-xAxO6+8., where A = Cr, Mn, Fe, Co, Ni and Zn
vity. Substitution or doping has been studied on every cation and anion site in YBCO. For example: superconductivity remains essentially unaffected by the substitution of Y with isoelectronic rare-earth elements that have a large localized magnetic moment [Kanbe et al., 1987; Dunlap et al., 1987]; substitution on the Ba site with La will depress the superconductivity [e.g. Kwok et al., 1988]. In this study we focus on substitution of atoms on the Cu site where the superconducting electron holes are considered to move. Many elements, mostly the 3d transition metals have been used as dopants [e.g. Maeno et al., 1987; Kajitani et al., 1988; Xiao et al., 1987]. The solubility of these dopants are usually high (as high as 20% of the total Cu in the Fe case [Mazaki et al., 1987] and 33% in the Co case [Kajitani et al., 1988]) except W and Nb [Kuwabara and Kusaka, 1988]. The solubility of Ti is above 10% of the total Cu [Xiao et al., 1987]. The effect of most dopants is to induce the tetragonal phase and to decrease Tc without destroying the superconductivity (Fig.
2.3.2) [e.g. Xiao et al., 1987].
As mentioned before, there are two Cu sites in the structure (Cu(I) and Cu(II)). Since the superconductivity is believed to be confined in the CuO2-Ba-CuO2 layer assembly [Hor et al., 1987], the Cu site onto which substitution occurs is critical in determining the role of doping. This depends on the nature of the dopant. For example nickel atoms occupy only the Cu(II) sites; zinc atoms occupy the Cu(I) and Cu(II) sites with occupancies of 0.20 and 0.05; Co atoms were found at both Cu(I) and Cu(II) sites with occupancies of 0.83 and 0.08 [Kajitani et al., 1988]. However no study reports on the Ti site occupancy.
While most groups study the effects of doping on superconductivity, the influences of the dopant on oxygen stoichiometry and the oxidation state of the Cu are not particularly emphasized. The oxygen content of Ni- and Zn-doped samples were little changed by annealing in high-pressure oxygen, while the oxygen content increases to more than 7.0 in Co-doped samples [Shimakawa et al., 1988]. In Fe-doped samples, the oxygen content was proved to be constant (6.87 ± 0.05) with dopant concentration
(Obara et al., 1988]. Judging from the aliovalent nature of the Ti4
+
ion on the Cu2+ ion site, the charge density and/or the oxygen content should be altered by either electronic or ionic compensation.
2.3.2 Transport Properties
Studies of the high-temperature transport properties by electrical measurements of undoped YBCO have been performed by several groups. The temperature and oxygen partial pressure dependence of the conductivity and thermoelectric power reported by these groups are in good agreement with one another. Figs. 2.3.3a and 2.3.3b. show the conductivity and thermoelectric power as functions of temperature in various oxygen partial pressures [Choi et al., 1988]. When temperature is low and oxygen partial pressure is high, the conductivity is nearly temperature insensitive and of high magnitude, resembling typical metallic behavior (region I). In this region the thermoelectric power is positive and temperature insensitive. However, the conductivity becomes thermally activated, with negative activation energy, at intermediate temperatures and reduced P0 2 (region II). The corresponding thermoelectric power
600 70 60I 0 00 30* 1.0 1.2 1.4 1.6 1.8 1000/T (K-1) 800 700 600 500 400 300 ' 200 Log P02 (atm) 100 0-i j I 10 12 14 8 18 000/T (K-')
Fig. 2.3.3 Log (conductivity) (a) and thermoelectric power (b) 1000/T for YBa 2Cu 306.8 measured at a series of controlled
P0 2's as indicated [Choi et al.,1989).
Log 0 -- 1 -2 -3 I 300--10 vs.
w00
700 S00o 500 400 300 'c .remains positive but increases rapidly with temperature. Further, at high temperature and low oxygen partial pressure, the conductivity reverses and show a thermally activated process with positive activation enthalpy (region III). In this region the thermoelectric power passes through a maximum and reverses sign to n-type at the highest temperatures and lowest oxygen partial pressures, suggesting a p-n transition.
Both Choi et al. [1988] and Su et al. [1988] support at least in the low oxygen content regime that the transport in YBa2Cu 30 6+8 occurs by the small polaron mechanism. Nowotny and Rekas later [1990] modified this model by an adjustment in the calculation of conductivity and thermoelectric power, which involves both electrons and electron holes as carriers.
2.3.3 Defect Chemistry
P 0 2 dependent electrical measurements on undoped YBa 2Cu 306+8 was examined by the same groups [Choi, Tuller and Tsai, 1989; Su, Dorris and Mason, 1988; Mehta and Smyth, 1989; Yoo, 1989; Nowotny and Rekas, 1990]. Their data are quite consistent with one another. Typical data are shown in Figs. 2.3.4 where the conductivity and thermoelectric power are measured isothermally as functions of P0 2 [Choi et al., 1988]. It is indicated that there is a gradual change of slope from 1/2 to -1/2 from oxidizing to reducing conditions in conductivity and the thermoelectric power follows the same trends. In a more detailed study, Nowotny et al. [1990] express the reciprocal of the slope of thermoelectric power vs P02 as
3 2 C 0 -4 I -3I I Log P 2 (atm) (a) 0 YSCO 170016c
ITo
-3 -z - I Log P0 2 (atm) (b)Fig. 2.3.4 Log (conductivity) (a) and' thermoelectric power (b) vs. log (PO2) for YBa2Cu 30 6+8 measured at a series of controlled temperatures as indicated [Choi et al.,1989]
I
n
d(-qa/k)
= [d(In p o 2)Tand plot it as a function of temperature (Fig. 2.3.5). It is found that the trends are similar but the slopes in most cases are smaller than 1/2 even at low PO 2'S. This relationship is critical to the identification of the proper defect model [Choi et al., 1988; Su et al.,
1988].
A fixed composition measurement was also carried out by Choi et al. [1988] so the the property change due to the oxygen stoichiometry change during cooling could be isolated. The results are shown in Fig. 2.3.6 In contrast to the results of Fig. 2.3.3 , taken at constant PO2, the conductivity decreases monotonically with decreasing temperature. The temperature dependence, particularly at the lower temperatures, decreases rapidly with decreasing oxygen content. At the highest temperatures, all three curves appear to approach a common curve. The thermoelectric power data, though showing an inconsistency at the starting point of each curve with the constant P0 2 cooling curve, decreases with decreasing oxygen stoichiometry suggesting that the corresponding increase in conductivity is at least in large part due to an increase in carrier density. These data were correlated to the oxygen stoichiometry data from thermogravimetric analysis for a defect model that involves CuO, Cu+ and Cu2+ in the materials instead of Cu+, Cu2+ and Cu 3+ proposed by others [Su et al., 1988; Nowotny and Rekas, 1990].
It is postulated that the hole concentration will decrease with donor doping. The p-n transition observed in the high temperature regime will occur at lower temperature and in higher oxygen partial
TEMPERATURE (*C)
TlK)
Reciprocal oxygen exponent (na) as a function temperature for YBa2Cu 306+8 [Nowotny et al., 1990].
201 10 3 0 £ w
z
LUz
LU LL 0r Fig. 2.3.5 I1 03 I-. 1 0 -2 CW 3-3 compoSitIon 1.0 1.5 2.0 2.5 1000/T (K-C) (a) 1i0 1.5 2.0 1000/T 2.5 (K') Fig. 2.3.6 (b)
Log (conductivity) (a) and thermoelectric power (b) vs. 1000/T for YBa2Cu 306+6 with fixed values of S [Choi et
al.,1989]. YBCO Fixed -4 1--8., 0 C2 cr I., YBCO Fixed compostion 0.1 sO 0.35 a 02 1 S 0 3.0 3.5 3.0 3.5 I I I . I I I I I I I I I I I I I I 5 s
![Fig. 2.1.6 Schematic density of states vs. energy diagrams for the s- s-bonding 3d electrons of La 2 CuO4 (a) [Goodenough, 1973]](https://thumb-eu.123doks.com/thumbv2/123doknet/14672253.557070/29.918.130.781.264.750/schematic-density-states-energy-diagrams-bonding-electrons-goodenough.webp)
![Fig. 2.2.3 Oxygen nonstoichiometry of Nd 2 CuO4 (a) and Nd 2 - -xCeCuO4,8 (b) as a function of oxygen partial pressure and temperature [Suzuki et al., 1990].](https://thumb-eu.123doks.com/thumbv2/123doknet/14672253.557070/37.918.210.672.95.1027/oxygen-nonstoichiometry-xcecuo-function-partial-pressure-temperature-suzuki.webp)