HAL Id: hal-01717692
https://hal.sorbonne-universite.fr/hal-01717692
Submitted on 26 Feb 2018
HAL is a multi-disciplinary open access
archive for the deposit and dissemination of
sci-entific research documents, whether they are
pub-lished or not. The documents may come from
teaching and research institutions in France or
abroad, or from public or private research centers.
L’archive ouverte pluridisciplinaire HAL, est
destinée au dépôt et à la diffusion de documents
scientifiques de niveau recherche, publiés ou non,
émanant des établissements d’enseignement et de
recherche français ou étrangers, des laboratoires
publics ou privés.
Distributed under a Creative Commons Attribution| 4.0 International License
Analysis of the Genetic Diversity and Population
Structure of Austrian and Belgian Wheat Germplasm
within a Regional Context Based on DArT Markers
Mohamed A. El-Esawi, Jacques Witczak, Abd El-Fatah Abomohra, Hayssam
Ali, Mohamed Elshikh, Margaret Ahmad
To cite this version:
Mohamed A. El-Esawi, Jacques Witczak, Abd El-Fatah Abomohra, Hayssam Ali, Mohamed Elshikh,
et al.. Analysis of the Genetic Diversity and Population Structure of Austrian and Belgian Wheat
Germplasm within a Regional Context Based on DArT Markers. Genes, MDPI, 2018, 9 (1), pp.47.
�10.3390/genes9010047�. �hal-01717692�
genes
G C A T T A C G G C A T
Article
Analysis of the Genetic Diversity and Population
Structure of Austrian and Belgian Wheat Germplasm
within a Regional Context Based on DArT Markers
Mohamed A. El-Esawi1,2,*ID, Jacques Witczak1, Abd El-Fatah Abomohra2,3,Hayssam M. Ali4,5ID, Mohamed S. Elshikh4and Margaret Ahmad1,6
1 UMR CNRS 8256 (B2A), Université Paris VI, 75005 Paris, France; jacques.witczak@upmc.fr (J.W.);
margaret.ahmad@upmc.fr (M.A.)
2 Botany Department, Faculty of Science, Tanta University, Tanta 31527, Egypt
3 School of Energy and Power Engineering, Jiangsu University, Zhenjiang 212013, China;
abomohra@yahoo.com
4 Botany and Microbiology Department, College of Science, King Saud University, Riyadh 11451,
Saudi Arabia; hayhassan@ksu.edu.sa (H.M.A.); melshikh@ksu.edu.sa (M.S.E.)
5 Timber Trees Research Department, Sabahia Horticulture Research Station, Horticulture Research Institute,
Agriculture Research Center, Alexandria 21526, Egypt
6 Department of Biology, Xavier University, Cincinnati, OH 45207, USA
* Correspondence: mohamed.elesawi@science.tanta.edu.eg; Tel.: +20-1024824643 Received: 9 November 2017; Accepted: 21 December 2017; Published: 22 January 2018
Abstract:Analysis of crop genetic diversity and structure provides valuable information needed to broaden the narrow genetic base as well as to enhance the breeding and conservation strategies of crops. In this study, 95 Austrian and Belgian wheat cultivars maintained at the Centre for Genetic Resources (CGN) in the Netherlands were characterised using 1052 diversity array technology (DArT) markers to evaluate their genetic diversity, relationships and population structure. The rarefacted allelic richness recorded in the Austrian and Belgian breeding pools (A25 = 1.396 and 1.341, respectively) indicated that the Austrian germplasm contained a higher genetic diversity than the Belgian pool. The expected heterozygosity (HE) values of the Austrian and Belgian pools were 0.411 and 0.375, respectively. Moreover, the values of the polymorphic information content (PIC) of the Austrian and Belgian pools were 0.337 and 0.298, respectively. Neighbour-joining tree divided each of the Austrian and Belgian germplasm pools into two genetically distinct groups. The structure analyses of the Austrian and Belgian pools were in a complete concordance with their neighbour-joining trees. Furthermore, the 95 cultivars were compared to 618 wheat genotypes from nine European countries based on a total of 141 common DArT markers in order to place the Austrian and Belgian wheat germplasm in a wider European context. The rarefacted allelic richness (A10) varied from 1.224 (Denmark) to 1.397 (Austria). Cluster and principal coordinates (PCoA) analyses divided the wheat genotypes of the nine European countries into two main clusters. The first cluster comprised the Northern and Western European wheat genotypes, whereas the second included the Central European cultivars. The structure analysis of the 618 European wheat genotypes was in a complete concordance with the results of cluster and PCoA analyses. Interestingly, a highly significant difference was recorded between regions (26.53%). In conclusion, this is the first study to reveal the high diversity levels and structure of the uncharacterised Austrian and Belgian wheat germplasm maintained at the CGN as well as place them in a wider European context. The results should help plant breeders to utilise the most promising wheat genotypes of this study in future breeding programmes for enhancing wheat cultivars.
Keywords: wheat; genetic diversity; population structure; relationships; diversity array technology markers
1. Introduction
Wheat (Triticum aestivum L.) is an important allohexaploid cereal crop that originates from three diploid species: Triticum urartu (AA), a progenitor related to Aegilops speltoides (BB), and Aegilops tauschii (DD) [1]. Wheat is adaptable to grow in diverse environments, extending from the Caspian Sea to China [2,3]. Domestication has resulted in reducing the genetic variability in several crop species, including wheat [4]. The narrow genetic base is a major concern threatening crop genetic improvement progress [3]. A significant decrease in the genetic diversity of different crop cultivars registered during the last century has also been recorded [5]. Introgression of novel alleles from various plant genetic resources can enhance the reduced genetic diversity. Characterization and exploitation of the germplasm maintained at the plant genetic resource centres are, therefore, essential to enhance crop yield and resistance to pathogens in order to meet the needs of the growing human population [6]. Hundreds of thousands of wheat accessions, representing diverse geographical locations worldwide, have been maintained at numerous plant genetic resource centres without appropriate genetic characterization or revealing their potential value in crop improvement [1,7].
Characterisation of the genetic diversity and phylogenetic relationships provides valuable information needed to broaden the narrow genetic base as well as enhance breeding and conservation strategies for crops [8–11]. Analysis of population structure also facilitates a deeper understanding of germplasm diversity and association mapping studies [3,12]. Therefore, various approaches including coefficient of parentage, morphological traits and biochemical markers (storage proteins and isozymes) have been used for evaluating the genetic variation level and structure in many crops, including wheat, maize, soybeans and barley [13–20]. Analysis of genetic diversity based on these phenological, morphological and biochemical traits is affected by the environmental factors [3]. Therefore, molecular DNA markers have been developed and proved powerful in genetic diversity analysis.
DNA markers such as inter-simple sequence repeats (ISSR), amplified fragment length polymorphism (AFLP), restriction fragment length polymorphism (RFLP), microsatellites, and single nucleotide polymorphisms (SNPs) have been utilised to assess the relationships and genetic diversity levels in wheat germplasm [21–26]. Among these markers, microsatellites have been the most commonly suitable approaches in the plant genetic diversity analysis as they are abundant, codominant, highly polymorphic and widely distributed along chromosomes [22,27–30]. DNA markers have been also developed to involve diversity array technology (DArT [31]), which is a high-throughput microarray-based method used for genome profiling, association mapping, fingerprinting and assessing genetic diversity and structure in many crops, including wheat [32]. Diversity array technology markers have been further used and proved efficient for more wheat genetic diversity studies [1,3,33–35].
The main objectives of the current research were to utilise DArT markers to (i) evaluate the genetic diversity of Austrian and Belgian wheat breeding pools maintained, without appropriate genetic characterization, at the Centre for Genetic Resources (CGN) in the Netherlands; (ii) analyse the population structure of the Austrian and Belgian genetic pools, and reveal new information regarding their breeding and genetic structure; and (iii) place the Austrian and Belgian germplasm in a wider European context through accessing and exploiting a combined set of available DArT genotypes. 2. Materials and Methods
2.1. Plant Germplasm
2.1.1. Austrian and Belgian Wheat Breeding Pools
A set of 70 Austrian and 25 Belgian accessions of wheat (T. aestivum L.), maintained at the CGN, was obtained and analysed in the present study (Table S1).
Genes 2018, 9, 47 3 of 13
2.1.2. European Wheat Breeding Pool
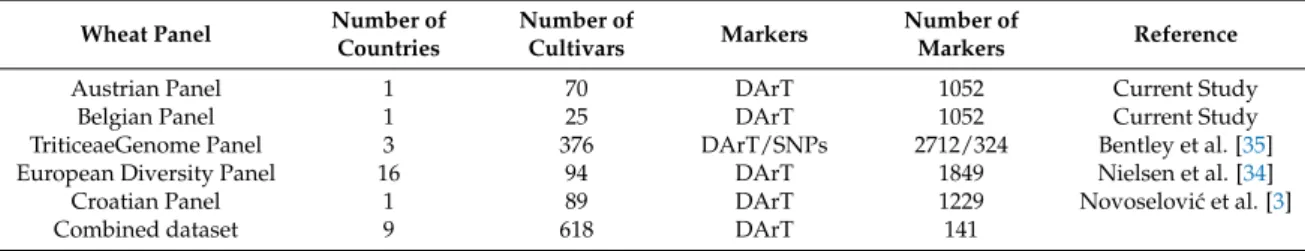
In order to place the Austrian and Belgian wheat breeding pools in a wider European context, DArTs accessible from three wheat pools previously published were involved in the current study, (i) The TriticeaeGenome panel comprising 376 wheat cultivars from the UK, Germany and France [35]; (ii) The European diversity panel comprising 94 European wheat cultivars [30]; and (iii) The Croatian wheat panel comprising 89 wheat cultivars [3]. The numbers of cultivars in each panel and represented countries are summarised in Table1.
Table 1. Wheat breeding panels analysed in this study, including numbers of countries, cultivars and markers.
Wheat Panel Number of Countries
Number of
Cultivars Markers
Number of
Markers Reference
Austrian Panel 1 70 DArT 1052 Current Study
Belgian Panel 1 25 DArT 1052 Current Study
TriticeaeGenome Panel 3 376 DArT/SNPs 2712/324 Bentley et al. [35] European Diversity Panel 16 94 DArT 1849 Nielsen et al. [34] Croatian Panel 1 89 DArT 1229 Novoselovi´c et al. [3]
Combined dataset 9 618 DArT 141
DArT, diversity array technology markers; SNPs, single nucleotide polymorphysms.
2.2. DNA Extraction and DArT Analysis
Genomic DNA (gDNA) was isolated from the young leaf tissue of each of the Austrian and Belgian wheat accessions using DNeasy Plant Mini Kit (Qiagen, Marseille, France) and was subjected to DArT analysis according to the general procedures previously described [31]. Out of all DArT markers scored, 1052 markers of a higher quality were selected for further genetic analysis of the Austrian and Belgian breeding pools. Furthermore, DArT data representing the European wheat breeding pool was accessed from the three published wheat panels [3,34,35]. Across the Austrian and Belgian wheat panels as well as the European wheat breeding pool, only countries of at least 10 varieties and common markers were included in the analysis. The final combined dataset of the Austrian and Belgian wheat panels and the European wheat breeding pool comprised 618 cultivars from nine countries and 141 common DArT markers (Table1).
2.3. Data Analysis
2.3.1. Genetic Diversity and Population Structure of Austrian and Belgian Wheat Pools
DArT-based diversity analysis of the Austrian and Belgian wheat cultivars was assessed using different diversity indices. Since the Austrian and Belgian breeding pools are different in sample size, rarefaction method was used to calculate the rarefacted allelic richness of the two pools, in a standardised sample size equivalent to the smallest population size of n = 25 (A25) using FSTAT version 2.9.3 [36]. The polymorphic loci percentage (%P), effective number of alleles (NE), expected heterozygosity (HE), and polymorphic information content (PIC) were also calculated using GenAlex v. 6.41 [37] and PowerMarker v. 3.25 [38].
A Jaccard dissimilarity matrix-based neighbour-joining tree with 1000 bootstraps was conducted for each of the Austrian and Belgian breeding pools, separately. The population structure analysis was conducted for each of the Austrian and Belgian breeding pools using Structure 2.4.1 software [39]. The hypothetical populations’ number (k) varied from 1 to 15, with 100,000 burn-in run iteration, followed by 100,000 Markov chain Monte Carlo replicates. Ten independent iterations were run. Structure Harvester [40] was then used to calculate the most likely number of k [41]. Analysis of molecular variance (AMOVA) was conducted to partition the molecular diversity between and within the populations (k), generated by Structure analysis, of each of the Austrian and Belgian wheat breeding pools using GenAlex v. 6.41 [37].
2.3.2. Diversity, Population Structure and Relationships among Wheat Varieties from Nine Countries Based on the 141 common DArT markers, the genetic diversity of the European wheat varieties from nine countries (Austria, Belgium, Croatia, Germany, France, Denmark, Sweden, Hungary and the UK) has been estimated using the same diversity indices mentioned above (%P, HE, NE, PIC). Rarefaction was used to calculate the rarefacted allelic richness of the nine European populations in a standardized sample size equivalent to the smallest population size of n = 10 (A10) using FSTAT version 2.9.3 [36].
Analysis of molecular variance analysis was performed to partition the molecular diversity between regions (Northern and Western Europe vs. Central Europe), within countries, and among countries within regions. The Northern and Western European region contained Belgium, Germany, Denmark, Sweden, France, and UK. The Central European countries included Austria, Croatia, and Hungary. The genetic differentiation (FST) values were calculated between pairs of countries and were used to construct the cluster analysis among the nine countries using the Unweighted pair group method with arithmetic mean (UPGMA) method. To reveal the relationships among the 618 wheat accessions representing the nine European countries, principal coordinate analysis (PCoA) was conducted using GenAlEx 6.41 software [37]. The genetic structure of all European wheat cultivars from the nine countries was evaluated using Structure software ver. 2.4.1, as described above. 3. Results
3.1. Genetic Diversity and Population Structure of Austrian and Belgian Wheat Pools
In this study, a total of 1052 DArT markers were used to assess the genetic diversity and structure of 95 Austrian and Belgian wheat cultivars. Table2shows the diversity indices estimated for the Austrian and Belgian pools based on 1052 DArT markers. The values of rarefacted allelic richness (A25) recorded in the Austrian and Belgian breeding pools were 1.396 and 1.341, respectively, indicating that the Austrian breeding pool contained a slightly higher diversity than the Belgian pool. Furthermore, the percentage of polymorphic markers recorded in the Austrian and Belgian breeding pools was 93.79% and 91.46%, respectively (Table2). The average values of the effective number of alleles per locus (NE) found in the Austrian and Belgian breeding pools were 1.698 and 1.602, respectively. The HE values of the Austrian and Belgian pools were 0.411 and 0.375, respectively. Furthermore, the values of PIC of the Austrian and Belgian pools were 0.337 and 0.298, respectively.
Table 2. Genetic diversity of the Austrian and Belgian wheat breeding panels based on 1052 DArT markers.
Wheat Panels N %P NE A25 HE PIC
Austrian Panel 70 93.79 1.698 1.396 0.411 0.337 Belgian Panel 25 91.46 1.602 1.341 0.375 0.298
N, number of cultivars; %P, polymorphic markers percentage; NE, effective number of alleles; A23, rarefacted
allelic richness (mean number of alleles rarefacted for a sample size of 25 cultivars); HE, expected heterozygosity;
PIC, polymorphic information content.
Jaccard dissimilarity matrix-based neighbour-joining tree performed for the Austrian wheat pool equally divided the Austrian pool into two main clusters (Figure1). The first main cluster comprised 33 cultivars, whereas the second contained 37 genotypes. The structure analysis of the Austrian wheat genotypes showed that the highest∆K value was recorded at K = 2 (315.68) followed by that at K = 6 (92.65) (Figure2). At K = 2, the Austrian wheat genotypes were divided into two populations (A and B), in a complete concordance with the neighbour-joining tree results (Figure1). Furthermore, the Jaccard dissimilarity matrix-based neighbour-joining tree performed for the Belgian wheat pool divided the Belgian pool into two main clusters (Figure3). The first cluster contained 11 cultivars, whereas the second comprised 14 genotypes. The structure analysis of the Belgian wheat genotypes
Genes 2018, 9, 47 5 of 13
showed that the highest∆K value was recorded at K = 2 (373.66) followed by that at K = 3 (92.78) (Figure4). At K = 2, 11 Belgian wheat genotypes were assigned to population A, whereas population B comprised 14 genotypes in a complete concordance with the neighbour-joining tree results (Figure3).
Genes 2017, 8, 47 5 of 13
population B comprised 14 genotypes in a complete concordance with the neighbour-joining tree results (Figure 3).
Figure 1. Neighbor-joining tree of the 70 Austrian wheat genotypes and their population structure (at K = 2) based on 1052 diversity array technology (DArT) markers. The numbers at the nodes of the phylogenetic tree represent the bootstrap values showing the probability of branching at 1000 replications. The red and blue colors represent two different populations.
Figure 1.Neighbor-joining tree of the 70 Austrian wheat genotypes and their population structure (at K = 2) based on 1052 diversity array technology (DArT) markers. The numbers at the nodes of the phylogenetic tree represent the bootstrap values showing the probability of branching at 1000 replications. The red and blue colors represent two different populations.
Genes 2018, 9, 47 6 of 13
Genes 2017, 8, 47 6 of 13
Figure 2. The log-likelihood and ΔK values based on the change rate of log-likelihood function between successive K [41] in the 70 Austrian wheat genotypes.
Figure 3. Neighbor-joining tree of the 25 Belgian wheat genotypes and their population structure (at
K = 2) based on 1052 DArT markers. The numbers at the nodes of the phylogenetic tree represent the
bootstrap values showing the probability of branching at 1000 replications. The red and blue colors represent two different populations.
0 100 200 300 400 -100000 -90000 -80000 -70000 -60000 -50000 -40000 -30000 0 1 2 3 4 5 6 7 8 9 10 11 12 13 14 15 Ln [Pr(X|K)] ΔK
ΔK
Ln [Pr(X|
K
)]
K
Figure 2.The log-likelihood and∆K values based on the change rate of log-likelihood function between successive K [41] in the 70 Austrian wheat genotypes.
Figure 2. The log-likelihood and ΔK values based on the change rate of log-likelihood function between successive K [41] in the 70 Austrian wheat genotypes.
Figure 3. Neighbor-joining tree of the 25 Belgian wheat genotypes and their population structure (at
K = 2) based on 1052 DArT markers. The numbers at the nodes of the phylogenetic tree represent the
bootstrap values showing the probability of branching at 1000 replications. The red and blue colors represent two different populations.
0 100 200 300 400 -100000 -90000 -80000 -70000 -60000 -50000 -40000 -30000 0 1 2 3 4 5 6 7 8 9 10 11 12 13 14 15
Ln [Pr(X|K)]
ΔK
ΔK
Ln [Pr(X|
K
)]
K
Figure 3. Neighbor-joining tree of the 25 Belgian wheat genotypes and their population structure (at K = 2) based on 1052 DArT markers. The numbers at the nodes of the phylogenetic tree represent the bootstrap values showing the probability of branching at 1000 replications. The red and blue colors represent two different populations.
Genes 2018, 9, 47 7 of 13
Genes 2017, 8, 47 7 of 13
Figure 4. The log-likelihood and ΔK values based on the change rate of log-likelihood function between successive K [41] in the 25 Belgian wheat genotypes.
Analysis of molecular variance was conducted to partition the molecular diversity between and within the populations (K = 2), generated by Structure analysis, of each of the Austrian and Belgian wheat breeding pools (Table 3). The results showed that the majority of the diversity was attributed to differences among varieties within populations for the Austrian and Belgian breeding pools (80% and 81%, respectively) (Table 3).
Table 3. Analysis of molecular variance (AMOVA) of wheat panels from Austria (between and within populations), Belgium (between and within populations), and all nine European countries (between regions, among countries within regions, within regions).
Wheat Panels Source of Variation Variance Components % Total Variance Probability Austrian Panel Between populations 59.239 20% 0.0001
Within populations 236.847 80%
Belgian Panel Between populations 40.161 19% 0.0001
Within populations 169.985 81%
All European Wheat Panels from Nine Countries *
Between regions 8.152 26.53% 0.0001 Among countries Within
regions 1.732 5.64% 0.0001
Within countries 20.847 67.83% 0.0001 * Nine countries: Austria, Belgium, Croatia, Germany, France, Denmark, Sweden, Hungary and the UK.
3.2. Diversity, Population Structure and Relationships among European Wheat Varieties from Nine Countries To place the Austrian and Belgian wheat breeding pools in a wider European context, a total of 141 common DArTs were used to calculate the genetic diversity indices of 618 European wheat
varieties that originated from nine countries (Table 4). The A10 varied from 1.224 (Denmark) to 1.397
(Austria) (Table 4). Moreover, the HE ranged from 0.250 (Denmark) to 0.372 (Austria). The PIC varied
from 0.202 (Denmark) to 0.301 (Austria). The average value of the effective NE varied from 1.332
(Denmark) to 1.588 (Austria) (Table 4). These results revealed that the Central European countries (Austria, Croatia and Hungary) contained higher level of diversity than that of the Northern and Western European countries (Belgium, Germany, Denmark, Sweden, the UK and France).
0 100 200 300 400 -45000 -35000 -25000 -15000 -5000 0 1 2 3 4 5 6 7 8 9 10 11 12 13 14 15
Ln [Pr(X|K)]
ΔK
ΔK
Ln [Pr(X|K)]
K
Figure 4.The log-likelihood and∆K values based on the change rate of log-likelihood function between successive K [41] in the 25 Belgian wheat genotypes.
Analysis of molecular variance was conducted to partition the molecular diversity between and within the populations (K = 2), generated by Structure analysis, of each of the Austrian and Belgian wheat breeding pools (Table3). The results showed that the majority of the diversity was attributed to differences among varieties within populations for the Austrian and Belgian breeding pools (80% and 81%, respectively) (Table3).
Table 3. Analysis of molecular variance (AMOVA) of wheat panels from Austria (between and within populations), Belgium (between and within populations), and all nine European countries (between regions, among countries within regions, within regions).
Wheat Panels Source of Variation Variance Components % Total Variance Probability Austrian Panel Between populations 59.239 20% 0.0001
Within populations 236.847 80%
Belgian Panel Between populations 40.161 19% 0.0001 Within populations 169.985 81%
All European Wheat Panels from Nine Countries *
Between regions 8.152 26.53% 0.0001
Among countries Within regions 1.732 5.64% 0.0001
Within countries 20.847 67.83% 0.0001
* Nine countries: Austria, Belgium, Croatia, Germany, France, Denmark, Sweden, Hungary and the UK.
3.2. Diversity, Population Structure and Relationships among European Wheat Varieties from Nine Countries To place the Austrian and Belgian wheat breeding pools in a wider European context, a total of 141 common DArTs were used to calculate the genetic diversity indices of 618 European wheat varieties that originated from nine countries (Table4). The A10varied from 1.224 (Denmark) to 1.397 (Austria) (Table4). Moreover, the HEranged from 0.250 (Denmark) to 0.372 (Austria). The PIC varied from 0.202 (Denmark) to 0.301 (Austria). The average value of the effective NEvaried from 1.332 (Denmark) to 1.588 (Austria) (Table4). These results revealed that the Central European countries (Austria, Croatia and Hungary) contained higher level of diversity than that of the Northern and Western European countries (Belgium, Germany, Denmark, Sweden, the UK and France).
Genes 2018, 9, 47 8 of 13
Table 4. Genetic diversity of 618 European wheat varieties from nine countries estimated based on 141 DArT markers. Country N %P NE A10 HE PIC Austria 70 92.8 1.588 1.397 0.372 0.301 Belgium 25 91.2 1.515 1.308 0.282 0.231 Croatia 89 100 1.538 1.331 0.351 0.296 Hungary 11 92.6 1.515 1.344 0.341 0.287 France 214 100 1.468 1.302 0.319 0.278 Germany 99 93.3 1.389 1.262 0.279 0.229 Denmark 22 90.7 1.332 1.224 0.250 0.202 Sweden 10 88.4 1.380 1.335 0.276 0.221 United Kingdom 78 90.5 1.333 1.248 0.251 0.204
A10, rarefacted allelic richness (mean number of alleles rarefacted for a sample size of 10 cultivars).
Analysis of molecular variance revealed that the majority of genetic variation was attributed to differences among varieties within countries (67.83%, Table3). The results also revealed a highly significant difference between the two regions (Northern and Western Europe vs. Central Europe; p < 0.0001), which accounted for 26.53% of the total variance, whereas the difference recorded among countries within regions represented 5.64% (Table3).
UPGMA cluster analysis showed that the wheat genotypes of the Northern and Western European countries were clustered separately from the genotypes of the Central European countries (Austria, Croatia and Hungary) (Figure 5), indicating that the cultivars of the Central European countries comprised variation levels not currently represented in the Northern and Western European wheat breeding pool. Furthermore, the Northern and Western European wheat cluster was subdivided into two distinct subclusters. The first subcluster comprised the German and Swedish cultivars, while the second included the genotypes of Belgium, Denmark, the UK and France (Figure5).
Table 4. Genetic diversity of 618 European wheat varieties from nine countries estimated based on 141 DArT markers. Country N %P NE A10 HE PIC Austria 70 92.8 1.588 1.397 0.372 0.301 Belgium 25 91.2 1.515 1.308 0.282 0.231 Croatia 89 100 1.538 1.331 0.351 0.296 Hungary 11 92.6 1.515 1.344 0.341 0.287 France 214 100 1.468 1.302 0.319 0.278 Germany 99 93.3 1.389 1.262 0.279 0.229 Denmark 22 90.7 1.332 1.224 0.250 0.202 Sweden 10 88.4 1.380 1.335 0.276 0.221 United Kingdom 78 90.5 1.333 1.248 0.251 0.204
A10, rarefacted allelic richness (mean number of alleles rarefacted for a sample size of 10 cultivars).
Analysis of molecular variance revealed that the majority of genetic variation was attributed to differences among varieties within countries (67.83%, Table 3). The results also revealed a highly significant difference between the two regions (Northern and Western Europe vs. Central Europe; p < 0.0001), which accounted for 26.53% of the total variance, whereas the difference recorded among countries within regions represented 5.64% (Table 3).
UPGMA cluster analysis showed that the wheat genotypes of the Northern and Western European countries were clustered separately from the genotypes of the Central European countries (Austria, Croatia and Hungary) (Figure 5), indicating that the cultivars of the Central European countries comprised variation levels not currently represented in the Northern and Western European wheat breeding pool. Furthermore, the Northern and Western European wheat cluster was subdivided into two distinct subclusters. The first subcluster comprised the German and Swedish cultivars, while the second included the genotypes of Belgium, Denmark, the UK and France (Figure 5).
Figure 5. Unweighted pair group method with arithmetic mean (UPGMA) phylogenetic tree based on the genetic differentiation (FST) values between countries.
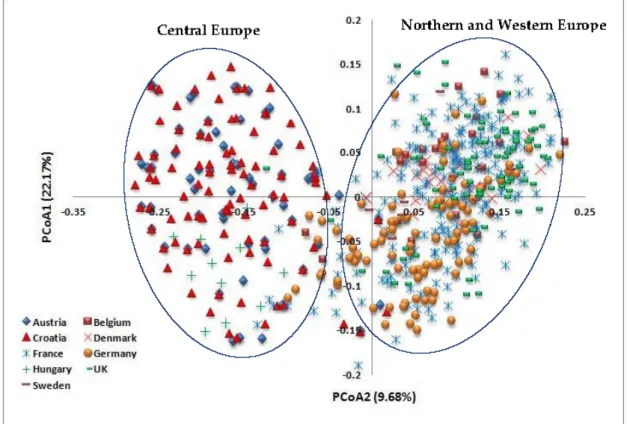
Principal coordinate analysis also revealed the relationships among the 618 wheat cultivars from the nine European countries (Figure 6). The first two axes accounted for 22.17% and 9.68% of the total variance, respectively. The wheat genotypes from the Northern and Western European countries (Belgium, Denmark, Germany, Sweden, France and the UK) were clustered separately from the genotypes from the Central European countries (Austria, Croatia and Hungary) along the first axis.
Figure 5.Unweighted pair group method with arithmetic mean (UPGMA) phylogenetic tree based on the genetic differentiation (FST) values between countries.
Principal coordinate analysis also revealed the relationships among the 618 wheat cultivars from the nine European countries (Figure6). The first two axes accounted for 22.17% and 9.68% of the total variance, respectively. The wheat genotypes from the Northern and Western European countries (Belgium, Denmark, Germany, Sweden, France and the UK) were clustered separately from the genotypes from the Central European countries (Austria, Croatia and Hungary) along the first axis.
Genes 2018, 9, 47 9 of 13
Genes 2017, 8, 47 9 of 13
Figure 6. Principal coordinates analysis (PCoA) of 618 European wheat cultivars from nine countries.
The structure analysis of the 618 European wheat genotypes showed that the highest ΔK value was recorded at K = 2 (4156.47) (Figure 7). Table 5 also shows the membership proportion of the 618 European wheat genotypes in each of the two populations (K = 2). The majority of wheat genotypes from the Northern and Western European countries were assigned to Population A, while the great majority of genotypes belonging to the Central European countries were assigned to population B (Table 5).
Figure 7. Analysis of population structure of 618 European wheat genotypes based on the 141 common DArT markers, the log-likelihood and ΔK values based on the change rate of log-likelihood function between successive K [41].
0 1000 2000 3000 4000 5000 -90000 -80000 -70000 -60000 -50000 -40000 -30000 -20000 0 1 2 3 4 5 6 7 8 9 10 11 12 13 14 15
Ln [Pr(X|K)]
ΔK
Ln [Pr(X|K)]
K
Figure 6.Principal coordinates analysis (PCoA) of 618 European wheat cultivars from nine countries.
The structure analysis of the 618 European wheat genotypes showed that the highest∆K value was recorded at K = 2 (4156.47) (Figure7). Table5also shows the membership proportion of the 618 European wheat genotypes in each of the two populations (K = 2). The majority of wheat genotypes from the Northern and Western European countries were assigned to Population A, while the great majority of genotypes belonging to the Central European countries were assigned to population B (Table5).
Genes 2017, 8, 47 9 of 13
Figure 6. Principal coordinates analysis (PCoA) of 618 European wheat cultivars from nine countries.
The structure analysis of the 618 European wheat genotypes showed that the highest ΔK value was recorded at K = 2 (4156.47) (Figure 7). Table 5 also shows the membership proportion of the 618 European wheat genotypes in each of the two populations (K = 2). The majority of wheat genotypes from the Northern and Western European countries were assigned to Population A, while the great majority of genotypes belonging to the Central European countries were assigned to population B (Table 5).
Figure 7. Analysis of population structure of 618 European wheat genotypes based on the 141 common DArT markers, the log-likelihood and ΔK values based on the change rate of log-likelihood function between successive K [41].
0 1000 2000 3000 4000 5000 -90000 -80000 -70000 -60000 -50000 -40000 -30000 -20000 0 1 2 3 4 5 6 7 8 9 10 11 12 13 14 15 Ln [Pr(X|K)]
ΔK
Ln [Pr(X|K)]
K
Figure 7.Analysis of population structure of 618 European wheat genotypes based on the 141 common DArT markers, the log-likelihood and∆K values based on the change rate of log-likelihood function between successive K [41].
Table 5.Membership proportion of wheat varieties of each of the nine European counties in each of the two populations (K = 2) generated by Structure analysis [39].
Country Membership in Population A (Pop. A) % Membership in Population B (Pop. B) %
Austria 10 90 Croatia 25 75 Hungary 12 88 Germany 61 39 Sweden 67 33 France 79 21 Belgium 91 09 United Kingdom 87 13 Denmark 82 18 4. Discussion
Evaluation of the genetic diversity, population structure and relationships provide valuable information needed to broaden the narrow genetic base and to enhance breeding and conservation strategies of crops. DArT markers showed their efficiency in assessing the genetic diversity of different crops. Raman et al. [1] assessed the diversity of 1057 wheat genotypes collected from different regions worldwide using DArT markers that revealed an average PIC value of 0.44 and Nei’s diversity index of 0.43. Zhang et al. [38] also characterised 111 Chinese wheat genotypes using DArT markers that revealed an average value of 0.40 for both of PIC and Nei’s diversity index. Novoselovi´c et al. [3] analysed 89 Croatian wheat genotypes using DArT markers and reported that the effective number of alleles per locus, PIC and expected heterozygosity were 1.64, 0.30 and 0.375, respectively. To the best of our knowledge, this is the first study to reveal the levels of genetic diversity and structure of the uncharacterised Austrian and Belgian wheat germplasm maintained at the CGN as well as place them in a wider European context. In this study, the characterization of Austrian and Belgian wheat pools showed different values for the diversity indices estimated. The rarefacted allelic richness recorded in the Austrian and Belgian breeding pools (A25= 1.396 and 1.341, respectively) indicated that the Austrian breeding pool contained a slightly higher diversity than the Belgian pool. The neighbour-joining tree divided the Austrian germplasm into two main clusters, which are in a complete concordance with the structure analysis results. These results suggest that the breeders used different genetic material as parental resources, which resulted in genetically diverse cultivars. Furthermore, the neighbour-joining tree divided the Belgian germplasm into two main clusters. The first cluster contained 11 cultivars, whereas the second comprised the majority of cultivars, in a complete concordance with the structure analysis. This study also revealed that the majority of the diversity was attributed to differences among varieties within populations. These clustering and AMOVA results suggest that the crossing among inter-cluster cultivars may develop cultivars with promising agronomic traits.
Combining the DArT genotypes from three wheat panels previously published [3,34,35] with the Austrian and Belgian panels provides valuable assessment of diversity levels in a regional context. Rarefaction also facilitated the comparison of the diversity levels between the nine European pools. The A10varied from 1.224 (Denmark) to 1.397 (Austria). The results revealed that the Central European countries (Austria, Croatia and Hungary) contained higher level of genetic diversity than that of the Northern and Western European countries (Belgium, Denmark, Germany, Sweden, France and the UK). This result is in accordance with that reported by Novoselovi´c et al. [3] who found higher level of genetic variation in wheat genotypes originating from Central Europe, when compared to those from Northern and Western European countries. The higher level of diversity might be attributed to the higher number of alleles resulting from breeding and crossing practices [3,42,43].
Analysis of molecular variance revealed that the majority of genetic variation was attributed to the differences among varieties within countries (67.83%). This is in agreement with previous studies [3,43]. White et al. [44] also revealed the significant role of the geographical factor in genetic diversity studies. The results revealed a highly significant difference between the two geographical
Genes 2018, 9, 47 11 of 13
regions (Northern and Western Europe vs. Central Europe), which accounted for 26.53% of the total variance, suggesting that the cultivars of the Central European countries comprised variation levels not currently represented in the Northern and Western European wheat pool and could be used in future breeding and crop improvement programmes.
Unweighted pair group method with arithmetic mean cluster analysis showed that wheat genotypes of the Northern and Western European countries were clustered separately from the genotypes of the Central European countries. Within the Northern and Western European wheat cluster, the German and Swedish genotypes were separated in a distinct subcluster, in a complete accordance with the findings of Novoselovi´c et al. [3]. Principal component analysis also revealed that the wheat genotypes from the Northern and Western European countries were clustered separately from the genotypes from the Central European countries, confirming our AMOVA results, which showed that the cultivars of the Central European countries comprised variation levels not currently represented in the Northern and Western European wheat breeding pool. The structure analysis divided the 618 European wheat genotypes into two populations. The majority of wheat genotypes from the Northern and Western European countries were assigned to one population, while the great majority of genotypes belonging to the Central European countries were assigned to the second population. These results are in accordance with our cluster analysis and PCoA data as well as with those previously reported by Novoselovi´c et al. [3] and Le Couviour et al. [45].
In conclusion, the present study confirmed that the use of combined datasets, regional contribution made by plant breeders, and genotyping approaches could provide a promising opportunity for unlocking the genetic potential and improving conservation strategies of wheat. It is considered the first study that successfully revealed the high levels of genetic diversity and structure of the uncharacterised Austrian and Belgian wheat germplasm maintained at the CGN as well as facilitated placing them in a wider European context using efficient DArT markers. In addition, current results would help plant breeders to utilise and maintain the high levels of diversity recorded as well as selecting and using the most promising wheat genotypes in future breeding programs for enhancing and developing wheat cultivars of highly valuable agronomic traits.
Supplementary Materials: The following are available online at www.mdpi.com/2073-4425/9/1/47/s1. Table S1: List of Austrian and Belgian accessions analysed in this study.
Acknowledgments:The authors would like to thank the University of Paris VI in France, and the Deanship of Scientific Research at King Saud University, Riyadh, Saudi Arabia for supporting this work through research group (RG 1435-011). We would like to express our gratitude to Pierre-Etienne Bouchet (University of Paris VI) for providing technical help in the lab. We would also like to thank Alison Bentley (National Institute of Agricultural Botany, Cambridge, UK) and Mario Novoselovi´c (Agricultural Institute Osijek, Croatia) for providing the accessible DArT dataset of their previous studies to be included in placing the Austrian and Belgian wheat germplasm in a wider European context.
Author Contributions:M.A.E., and M.A. designed the study. M.A.E., and J.W. performed the experiments. M.A.E. performed the data analysis and wrote the manuscript. M.A.E., M.A., J.W., A.A., H.M.A., and M.S.E. revised the manuscript. All authors approved the final manuscript.
Conflicts of Interest:The authors declare no conflict of interest.
References
1. Raman, H.; Stodart, B.J.; Cavanagh, C.; Mackay, M.; Morrel, M.; Milgate, A.; Martin, P. Molecular diversity and genetic structure of modern and traditional landrace cultivars of wheat (Triticum aestivum L.). Crop Pasture Sci. 2010, 61, 222–229. [CrossRef]
2. Zohary, D.; Harlan, J.H.; Vardi, A. The wild diploid progenitors of wheat and their breeding value. Euphytica 1969, 18, 58–65. [CrossRef]
3. Novoselovi´c, D.; Bentley, A.R.; Šimek, R.; Dvojkovi´c, K.; Sorrells, M.E.; Gosman, N.; Horsnell, R.; Drezner, G.; Šatovi´c, Z. Characterizing Croatian wheat germplasm diversity and structure in a European context by DArT markers. Front. Plant Sci. 2016, 7, 184. [CrossRef] [PubMed]
4. Morgante, M.; Salamini, F. From plant genomics to breeding practice. Curr. Opin. Biotechnol. 2003, 14, 214–219. [CrossRef]
5. Van de Wouw, M.; van Hintum, T.; Kik, C.; van Treuren, R.; Visser, B. Genetic diversity trends in twentieth century crop cultivars: A meta analysis. Theor. Appl. Genet. 2010, 120, 1241–1252. [CrossRef] [PubMed] 6. Reeves, T.G.; Pinstrup-Anderson, P.; Pandya-Lorch, R. Food Security and the Role of Agricultural Research;
CIMMYT: Mexico City, Mexico, 1997.
7. Hoisington, D.; Khairallah, M.; Reeves, T.; Ribaut, J.-M.; Skovmand, B.; Taba, S.; Warburton, M. Plant genetic resources: What can they contribute toward increased crop productivity? Proc. Natl. Acad. Sci. USA 1999, 96, 5937–5943. [CrossRef] [PubMed]
8. El-Esawi, M.A.; Sammour, R. Karyological and phylogenetic studies in the genus Lactuca L. (Asteraceae). Cytologia 2014, 79, 269–275. [CrossRef]
9. El-Esawi, M.A.; Germaine, K.; Bourke, P.; Malone, R. Genetic diversity and population structure of Brassica oleracea germplasm in Ireland using SSR markers. C. R. Biol. 2016, 339, 133–140. [CrossRef] [PubMed] 10. El-Esawi, M.A.; Germaine, K.; Bourke, P.; Malone, R. AFLP analysis of genetic diversity and phylogenetic
relationships of Brassica oleracea in Ireland. C. R. Biol. 2016, 339, 163–170. [CrossRef] [PubMed]
11. El-Esawi, M.A.; Mustafa, A.; Badr, S.; Sammour, R. Isozyme analysis of genetic variability and population structure of Lactuca L. germplasm. Biochem. Syst. Ecol. 2017, 70, 73–79. [CrossRef]
12. El-Esawi, M.A. Genetic diversity and evolution of Brassica genetic resources: From morphology to novel genomic technologies—A review. Plant Genet. Resour. 2017, 15, 388–399. [CrossRef]
13. Smith, J.S.C.; Smith, O.S. Associations among inbred lines of maize using electrophoretic, chromatographic, and pedigree data 1. Multivariate and cluster analysis of data from ‘Lancaster Sure Crop’ derived lines. Theor. Appl. Genet. 1987, 73, 654–664. [CrossRef] [PubMed]
14. Smith, J.S.C.; Smith, O.S. Associations among inbred lines of maize using electrophoretic, chromatographic, and pedigree data 2. Multivariate and cluster analysis of data from Iowa Stiff Stalk Synthetic derived lines. Theor. Appl. Genet. 1988, 76, 39–44. [CrossRef] [PubMed]
15. Cox, T.S.; Kiang, Y.T.; Gorman, M.B.; Rodgers, D.M. Relationship between coefficient of parentage and genetic similarity indices in the soybean. Crop Sci. 1985, 25, 529–532. [CrossRef]
16. Martin, J.M.; Blake, T.K.; Hockett, E.A. Diversity among North American spring barley cultivars based on coefficients of parentage. Crop Sci. 1991, 31, 1131–1137. [CrossRef]
17. Souza, E.; Fox, P.N.; Byerlee, D.; Skovmand, B. Spring wheat diversity in irrigated areas of two developing countries. Crop Sci. 1994, 34, 774–783. [CrossRef]
18. DeLacy, I.H.; Skovmand, B.; Huerta, J. Characterization of Mexican wheat landraces using agronomically useful attributes. Genet. Resour. Crop Evol. 2000, 47, 591–602. [CrossRef]
19. Guadagnuolo, R.; Bianchi, D.S.; Felber, F. Specific genetic markers for wheat, spelt, and four wild relatives: Comparison of isozymes, RAPDs, and wheat microsatellites. Genome 2001, 44, 610–621. [CrossRef] [PubMed] 20. Caballero, L.; Martín, L.M.; Alvarez, J.B. Genetic variability of the low molecular-weight glutenin subunits in spelt wheat (Triticum aestivum ssp. spelta L. em Thell.). Theor. Appl. Genet. 2004, 108, 914–919. [CrossRef] [PubMed]
21. Joshi, C.P.; Nguyen, H.T. RAPD (random amplified polymorphic DNA) analysis based intervarietal genetic relationships among hexaploid wheats. Plant Sci. 1993, 93, 95–103. [CrossRef]
22. Plaschke, J.; Ganal, M.W.; Röder, M.S. Detection of genetic diversity in closely related bread wheat using microsatellite markers. Theor. Appl. Genet. 1995, 91, 1001–1007. [CrossRef] [PubMed]
23. Paull, J.G.; Chalmers, K.J.; Karakousis, A.; Kretschmer, J.M.; Manning, S.; Langridge, P. Genetic diversity in Australian wheat varieties and breeding material based on RFLP data. Theor. Appl. Genet. 1998, 96, 435–446. [CrossRef] [PubMed]
24. Eujayl, I.; Sorrells, M.; Baum, M.; Wolters, P.; Powell, W. Assessment of genotypic variation among cultivated durum wheat based on EST-SSRs and genomic SSRs. Euphytica 2001, 119, 39–43. [CrossRef]
25. Soleimani, V.D.; Baum, B.R.; Johnson, D.A. AFLP and pedigree-based genetic diversity estimates in modern cultivars of durum wheat (Triticum turgidum L. subsp. durum (Desf.) Husn.). Theor. Appl. Genet. 2002, 104, 350–357. [CrossRef] [PubMed]
26. Reif, J.C.; Zhang, P.; Dreisigacker, S.; Warburton, M.L.; van Ginkel, M.; Hoisington, D.; Bohn, M.; Melchinger, A.E. Wheat genetic diversity trends during domestication and breeding. Theor. Appl. Genet. 2005, 110, 859–864. [CrossRef] [PubMed]
Genes 2018, 9, 47 13 of 13
27. Huang, Q.; Borner, A.; Roder, S.; Ganal, W. Assessing genetic diversity of wheat (Triticum aestivum L.) germplasm using microsatellite markers. Theor. Appl. Genet. 2002, 105, 699–707. [PubMed]
28. Laidò, G.; Mangini, G.; Taranto, F.; Gadaleta, A.; Blanco, A.; Cattivelli, L.; Marone, D.; Mastrangelo, A.M.; Papa, R.; De Vita, P. Genetic diversity and population structure of tetraploid wheats (Triticum turgidum L.) Estimated by SSR, DArT and pedigree data. PLoS ONE 2013, 8, e67280. [CrossRef] [PubMed]
29. Chen, X.; Min, D.; Yasir, T.A.; Hu, Y.-G. Genetic diversity, population structure and linkage disequilibrium in elite Chinese winter wheat investigated with SSR markers. PLoS ONE 2012, 7, e44510. [CrossRef] [PubMed] 30. El-Esawi, M.A. SSR analysis of genetic diversity and structure of the germplasm of faba bean (Vicia faba L.).
C. R. Biol. 2017, 340, 474–480. [CrossRef] [PubMed]
31. Jaccoud, D.; Peng, K.; Feinstein, D.; Killian, A. Diversity arrays: A solid state technology for sequence information independent genotyping. Nucleic Acids Res. 2001, 29, e25. [CrossRef] [PubMed]
32. Akbari, M.; Wenzl, P.; Caig, V.; Carling, J.; Xia, L.; Yang, S.; Uszynski, G.; Mohler, V.; Lehmensiek, A.; Kuchel, H.; et al. Diversity arrays technology (DArT) for high-throughput profiling of the hexaploid wheat genome. Theor. Appl. Genet. 2006, 113, 1409–1420. [CrossRef] [PubMed]
33. Stodart, B.J.; Mackay, M.C.; Raman, H. Assessment of molecular diversity in landraces of bread wheat (Triticum aestivum L.) held in an ex situ collection with Diversity Array Technology (DArT). Aust. J. Agric. Res. 2007, 58, 1174–1182. [CrossRef]
34. Nielsen, N.H.; Backes, G.; Stourgaard, J.; Andersen, S.U.; Jahoor, A. Genetic diversity and population structure analysis of European hexaploid bread wheat (Triticum aestivum L.) varieties. PLoS ONE 2014, 9, e94000. [CrossRef] [PubMed]
35. Bentley, A.R.; Scutari, M.; Gosman, N.; Faure, S.; Bedford, F.; Howell, P.; Cockram, J.; Rose, G.A.; Barber, T.; Irigoyen, J.; et al. Applying association mapping and genomic selection to the dissection of key traits in elite European wheat. Theor. Appl. Genet. 2014, 127, 2619–2633. [CrossRef] [PubMed]
36. Goudet, J. FSTAT version 1.2: A computer program to calculate F-statistics. J. Hered. 1995, 86, 485–486. [CrossRef]
37. Peakall, R.; Smouse, P.E. GENALEX 6: Genetic analysis in excel. population genetic software for teaching and research. Mol. Ecol. Notes 2006, 6, 288–295. [CrossRef]
38. Liu, K.; Muse, S.V. PowerMarker: An integrated analysis environment for genetic marker analysis. Bioinformatics 2005, 21, 2128–2129. [CrossRef] [PubMed]
39. Pritchard, J.K.; Stephens, M.; Donnelly, P. Inference of population structure using multilocus genotype data. Genetics 2000, 155, 945–959. [PubMed]
40. Earl, D.A.; von Holdt, B.M. STRUCTURE HARVESTER: A website and program for visualizing STRUCTURE output and implementing the Evanno method. Conserv. Genet. Resour. 2012, 4, 359–361. [CrossRef] 41. Evanno, G.; Regnaut, S.; Goudet, J. Detecting the number of clusters of individuals using the software
STRUCTURE: A simulation study. Mol. Ecol. 2005, 14, 2611–2620. [CrossRef] [PubMed]
42. Zhang, L.Y.; Liu, D.C.; Guo, X.L.; Yang, W.L.; Sun, J.Z.; Wang, D.W.; Sourdille, P.; Zhang, A. Investigation of genetic diversity and population structure of common wheat cultivars in northern China using DArT markers. BMC Genet. 2011, 12, 42. [CrossRef] [PubMed]
43. Hai, L.; Wagner, C.; Friedt, W. Quantitative structure analysis of genetic diversity among spring bread wheats (Triticum aestivum L.) from different geographical regions. Genetica 2007, 130, 213–225. [CrossRef] [PubMed] 44. White, J.; Law, J.R.; MacKay, I.; Chalmers, K.J.; Smith, J.S.C.; Kilian, A.; Powell, W. The genetic diversity of UK, US and Australian cultivars of Triticum aestivum measured by DArT markers and considered by genome. Theor. Appl. Genet. 2008, 116, 439–453. [CrossRef] [PubMed]
45. Le Couviour, F.; Faure, S.; Poupard, B.; Flodrops, Y.; Dubreuil, P.; Praud, S. Analysis of genetic structure in a panel of elite wheat varieties and relevance for association mapping. Theor. Appl. Genet. 2011, 123, 715–727. [CrossRef] [PubMed]
© 2018 by the authors. Licensee MDPI, Basel, Switzerland. This article is an open access article distributed under the terms and conditions of the Creative Commons Attribution (CC BY) license (http://creativecommons.org/licenses/by/4.0/).


![Figure 2. The log-likelihood and ΔK values based on the change rate of log-likelihood function between successive K [41] in the 70 Austrian wheat genotypes](https://thumb-eu.123doks.com/thumbv2/123doknet/14653184.552061/7.892.185.708.131.432/figure-likelihood-values-likelihood-function-successive-austrian-genotypes.webp)
![Figure 4. The log-likelihood and ΔK values based on the change rate of log-likelihood function between successive K [41] in the 25 Belgian wheat genotypes](https://thumb-eu.123doks.com/thumbv2/123doknet/14653184.552061/8.892.152.745.136.482/figure-likelihood-values-likelihood-function-successive-belgian-genotypes.webp)

![Table 5. Membership proportion of wheat varieties of each of the nine European counties in each of the two populations (K = 2) generated by Structure analysis [39].](https://thumb-eu.123doks.com/thumbv2/123doknet/14653184.552061/11.892.126.766.184.357/membership-proportion-varieties-european-counties-populations-generated-structure.webp)
