HAL Id: hal-01312914
https://hal.archives-ouvertes.fr/hal-01312914
Submitted on 9 May 2016
HAL is a multi-disciplinary open access
archive for the deposit and dissemination of
sci-entific research documents, whether they are
pub-lished or not. The documents may come from
teaching and research institutions in France or
abroad, or from public or private research centers.
L’archive ouverte pluridisciplinaire HAL, est
destinée au dépôt et à la diffusion de documents
scientifiques de niveau recherche, publiés ou non,
émanant des établissements d’enseignement et de
recherche français ou étrangers, des laboratoires
publics ou privés.
Stimuli Presented Synchronously to the Heartbeat
Roy Salomon, Roberta Ronchi, Jonathan Dönz, Javier Bello-Ruiz, Bruno
Herbelin, Remi Martet, Nathan Faivre, Karl Schaller, Olaf Blanke
To cite this version:
Roy Salomon, Roberta Ronchi, Jonathan Dönz, Javier Bello-Ruiz, Bruno Herbelin, et al.. The Insula
Mediates Access to Awareness of Visual Stimuli Presented Synchronously to the Heartbeat. Journal
of Neuroscience, Society for Neuroscience, 2016, �10.1523/JNEUROSCI.4262-15.2016�. �hal-01312914�
Behavioral/Cognitive
The Insula Mediates Access to Awareness of Visual Stimuli
Presented Synchronously to the Heartbeat
Roy Salomon,
1,2Roberta Ronchi,
1,2Jonathan Do¨nz,
1,2Javier Bello-Ruiz,
1,2Bruno Herbelin,
1,2Remi Martet,
1,2Nathan Faivre,
1,2Karl Schaller,
4and Olaf Blanke
1,2,31Laboratory of Cognitive Neuroscience and2Center for Neuroprosthetics, School of Life Sciences, Ecole Polytechnique Fe´de´rale de Lausanne, Geneva 1202, Switzerland;3Department of Neurology and4Neurosurgery Division, Department of Clinical Neurosciences, Geneva University Hospitals, Geneva 1211, Switzerland
The processing of interoceptive signals in the insular cortex is thought to underlie self-awareness. However, the influence of interoception
on visual awareness and the role of the insular cortex in this process remain unclear. Here, we show in a series of experiments that the
relative timing of visual stimuli with respect to the heartbeat modulates visual awareness. We used two masking techniques and show that
conscious access for visual stimuli synchronous to participants’ heartbeat is suppressed compared with the same stimuli presented
asynchronously to their heartbeat. Two independent brain imaging experiments using high-resolution fMRI revealed that the insular
cortex was sensitive to both visible and invisible cardio–visual stimulation, showing reduced activation for visual stimuli presented
synchronously to the heartbeat. Our results show that interoceptive insular processing affects visual awareness, demonstrating the role
of the insula in integrating interoceptive and exteroceptive signals and in the processing of conscious signals beyond self-awareness.
Key words: continuous flash suppression; high-resolution fMRI; insula; interoception; visual awareness
Introduction
Human awareness remains one of the most profound mysteries
for science (
Searle et al., 1997
). Significant advances have been
made regarding the mechanisms of awareness, notably through
psychophysical and neural measures of conscious and
uncon-scious processing of visual stimuli (
Dehaene and Changeux,
2011
). Another line of work has linked self-awareness to the
pro-cessing of interoceptive signals in the insular cortex (i.e., cardiac
signals; Damasio, 2000;
Craig, 2002
;
Critchley et al., 2004
;
Park et
al., 2014
) that monitor the internal state of the body (
Craig,
2009b
;
Singer et al., 2009
;
Craig, 2010
). Recently, theories have
suggested that the insula may be involved in interoceptive
infer-ence in which predictions regarding interoceptive signals are
compared with actual sensory and interoceptive afferent inputs
(
Critchley and Seth, 2012
;
Seth, 2013
;
Apps and Tsakiris, 2014
).
These predictive models of interoception are held to mediate
widespread sensory consequences of interoceptive signals such as
cardiac activity (
Barrett and Simmons, 2015
), thus reducing their
influence on perception (comparable to suppression of retinal
changes due to ocular motion). Early work on cardiac effects on
cortical processing has shown a general suppression of cortical
excitability related to cardiac activity (
Lacey and Lacey, 1970
;
Received Nov. 26, 2015; revised March 23, 2016; accepted March 29, 2016.
Author contributions: R.S., J.D., N.F., K.S., and O.B. designed research; R.S., R.R., J.D., and R.M. performed re-search; J.B.-R. and B.H. contributed unpublished reagents/analytic tools; R.S., R.R., J.D., J.B.-R., B.H., N.F., and O.B. analyzed data; R.S., R.R., J.D., N.F., K.S., and O.B. wrote the paper.
O.B. is supported by the Bertarelli Foundation, the Swiss National Science Foundation, and the European Science Foundation. R.S was supported by the National Center of Competence in Research, nCCR) “SYNAPSY - The Synaptic Bases of Mental Diseases” financed by the Swiss National Science Foundation (no. 51AU40_125759). N.F. is an E´cole Polytechnique Fe´de´rale de Lausanne Fellow cofunded by a Marie Skłodowska-Curie fellowship and was also sup-ported by the European Union Human Brain Project. We thank Rafael Malach, Aaron Schuger, and Andrea Serino for valuable comments on the study.
The authors declare no competing financial interests.
Correspondence should be addressed to Roy Salomon, Laboratory of Cognitive Neuroscience, E´cole Polytech-nique Fe´de´rale de Lausanne (EPFL), Chemin des Mines 9, Gene`ve 1202, Switzerland. E-mail:royesal@gmail.com.
DOI:10.1523/JNEUROSCI.4262-15.2016
Copyright © 2016 the authors 0270-6474/16/365115-13$15.00/0
Significance Statement
There is growing evidence that interoceptive signals conveying information regarding the internal state of the body influence
perception and self-awareness. The insular cortex, which receives sensory inputs from both interoceptive and exteroceptive
sources, is thought to integrate these multimodal signals. This study shows that cardiac interoceptive signals modulate awareness
for visual stimuli such that visual stimuli occurring at the cardiac frequency take longer to access visual awareness and are more
difficult to discriminate. Two fMRI experiments show that the insular region is sensitive to this cardio–visual synchrony even
when the visual stimuli are rendered invisible through interocular masking. The results indicate a perceptual and neural
suppres-sion for visual events coinciding with cardiac interoceptive signals.
Koriath and Lindholm, 1986
). Others have found evidence for
cardiac related modulation of sensory and cortical processing for
cutaneous (
Edwards et al., 2009
;
Gray et al., 2009
), nociceptive
(
Edwards et al., 2001
;
Gray et al., 2010
), and emotional stimuli
(
Garfinkel et al., 2014
). However, studies investigating cardiac
modulation of visual perception have produced conflicting
re-sults (
Elliott and Graf, 1972
;
Sandman et al., 1977
;
Walker and
Sandman, 1982
;
Park et al., 2014
). Therefore, although
intero-ceptive signals seem important for self and bodily awareness
(
Craig, 2009b
;
Aspell et al., 2013
;
Suzuki et al., 2013
), their role in
other forms of awareness such as visual awareness is yet unclear.
Here, we report data from a series of behavioral and brain
imag-ing studies investigatimag-ing the modulation of visual awareness by
interoceptive bodily signals in classical psychophysical tasks. We
explored the impact of interoceptive signals on visual awareness
in a series of nine separate experiments using novel adaptations of
the continuous flash suppression (CFS) (
Tsuchiya and Koch,
2005
) and visual crowding (
Bouma, 1970
) paradigms. These data
reveal an impact of interoceptive signals on visual awareness, in
which visual targets presented synchronously to the cardiac
fre-quency require more time (CFS) and are more difficult to
dis-criminate (visual crowding) than the same stimuli presented
asynchronously to the heartbeat. Two high-resolution fMRI
ex-periments show that the cardio–visual effect is reflected by
insu-lar cortex activity, thus demonstrating that the processing of
internal bodily signals in the insular cortex modulates
exterocep-tive awareness.
Materials and Methods
Participants
We recruited 153 right-handed healthy volunteers (46 females) from the student population at E´cole Polytechnique Fe´de´rale de Lausanne (EPFL) (age 18 –32 years, ⫽ 22.2 years) for the first 7 experiments (Experiment 1, n⫽ 31; Experiment 2, n ⫽ 18; Experiment 3, n ⫽ 23, i.e., participants in Experiment 1 who agreed to return; Experiment 4, n⫽ 33; Experiment 5, n⫽ 17; Experiment 6, n ⫽ 15; Experiment 7, n ⫽ 16). Ten participants were excluded from the analysis (Experiment 1, n⫽ 1; Experiment 2, n ⫽ 3; Experiment 4, n⫽ 3; Experiment 5, n ⫽ 2; Experiment 7, n ⫽ 1). Of these 10 participants, 6 were removed due to technical failures [electrode detachment during the experiment (4 of 6 participants); cluttered pre-sentation of the target stimuli due to malfunction in one of the head-mounted display (HMD) lenses (2 of 6 participants)]; the remaining four subjects were excluded due to accuracy scores 2.5 SDs below the mean (63%, 49%, 58%) and another one due to chance accuracy scores in the crowding experiment (37%). Therefore, the final data for analysis in the psychophysical experiments consisted of 143 participants. All partici-pants had normal or corrected-to-normal vision, were right-handed, had no psychiatric or neurological history, and were naive with respect to the purpose of the study. They participated in the study for payment (⬃30 Swiss Francs, CHF). All participants gave informed consent and the study was approved by the ethics committee of EPFL.
Stimuli and procedure
Experiment 1: CFS experiment
Stimuli. Stimuli consisted of high-contrast color dynamic noise patches
suppressors (“Mondrians”) and target stimuli. The target image con-sisted of a yellow octagon (RGB: 255,255,0; visual angle: H:4°, V:4°) positioned either above or below a central fixation cross (RGB: 0,0,0; visual angle: H:1°, V:1°). Mondrians were rapidly (10 Hz) flashed to the participants’ dominant eye (visual angle: H:48°, V:36°) and the target was presented simultaneously to the other eye. A black fixation cross (RGB: 0,0,0; visual angle: H:1°, V:1°) was presented to both eyes in all condi-tions. Stimuli were presented using ExpyVR custom-built multimedia stimuli presentation software developed with Python version 2.6 and the Open Graphics Library version 2.2. The stimuli were viewed via an HMD
(VR1280; Immersion, SXGA, 60° diagonal field of view, refresh rate 60 Hz).
Heartbeat detection and online graphical animation. For the acquisition
of the ECG signal, electrodes were placed on the subjects’ chest and plugged into a biometric analog signal amplifier (e-Health Sensor Plat-form version 2.0; Libelium) that was assembled together with a micro-controller (ATmega328; Arduino UNO) that performed the heartbeat detection.
Procedure. The CFS experiment included 160 trials divided into four
blocks. The total duration of the experiment was⬃1 h. Each trial began with the simultaneous presentation of the dynamic high-contrast color patterns (“masks”) and a target image to separate eyes (Fig. 1a). The trial
ended when participants pressed a key to indicate their response or after a maximum of 20 s. Target location (above/below fixation) and cardio– visual synchrony (synchronous/asynchronous) were randomized. Two different cardio–visual asynchronies were used, either 80% or 120% of the participant’s current heartbeat, and were counterbalanced between subjects. To ensure that trial onset did not maintain a specific phase in relation to participants’ heartbeat, an intertrial interval of 0.5, 0.8, or 1.3 s was presented between trials such that any spurious temporal relation between cardiac and visual stimuli would not be maintained.
Experiment 2: CFS replication within subjects
To verify and replicate the results found in Experiment 1, we ran a second experiment on 15 subjects in which both versions of the asynchronous cardio–visual stimulation were used in a within-subject design. The ex-perimental design was identical to that of the first experiment except, here, each participant had 80 synchronous and 80 asynchronous trials of cardio–visual stimulation (for asynchronous stimulation 40 trials were at 120% of the participant’s heartbeat and the other 40 were at 80% of their heartbeat).
Experiment 3: heartbeat awareness
In this experiment, we tested the ability of participants to judge whether the flashing stimuli were synchronous or asynchronous with their heart-beat (heartheart-beat awareness). Twenty-three participants from the cohort of the Experiment 1 were tested. Here, we presented the same visual stimuli as in Experiments 1 and 2 (an octagon flashing either synchronously or asynchronously to each participant’s heartbeat), but with no interocular suppression, for a duration of 6 s. Participants were required to report whether the flashing stimulus was synchronous or asynchronous to their current heartbeat by pressing a button on the keyboard. The participants were explicitly asked not to monitor their heartbeat by means other than interoceptive attention (such as taking their pulse). There were 100 trials in total (50 synchronous and 50 asynchronous randomized). The dura-tion of the experiment was⬃20 min.
Experiment 4: CFS control
We used a classical CFS control experiment (Jiang et al., 2007;Salomon et al., 2013) to control for possible differences in detection time due to response or detection biases. The control experiment was identical to Experiment 1 except that the target image (the yellow octagon) was blended into the masks (Fig. 1c) and presented to both eyes. Therefore, in
the control experiment, there was no interocular suppression. Compar-ison of the results from the control and CFS experiments allowed us to test whether the results in the CFS experiment reflected a mere response bias rather than a difference in conscious access.
Experiment 5: visual control
We used a visual control experiment to ensure that our results in Exper-iments 1 and 2 were not due to any visual characteristics relating to frequency effects of the stimulus presentation, but rather were due to subject specific cardio–visual coupling. This experiment was identical to Experiment 2 except that each participant in Experiment 5 was shown the precise visual stimulation shown previously to a participant in Exper-iment 2 (replayed) but without any relation to the participant’s own current heartbeat. The visual stimulation was thus identical in both ex-periments but the cardio–visual coupling was absent in Experiment 5. Therefore, if the visual features of the stimuli (such as frequency or timing differences) were driving the difference between synchronous and
asynchronous stimuli, then we would expect the participants to show similar differences between the trials that were synchronous and asyn-chronous in Experiment 2.
Experiment 6: phase-shifted CFS
We next investigated whether the frequency of presentation of a visual stimulus congruent to the heart rate was sufficient to cause visual sup-pression or if it also had to be presented at a precise moment relative to the heartbeat cycle. Therefore, we used the same CFS paradigm as in the previous experiments with the target flashing at the frequency of the participant’s heart rate in both conditions. However, in this experiment, we modulated the phase (delay) of the visual stimulation relative to an event of the heartbeat’s cycle. In the synchronous condition, the target was presented at the R peak of the QRS complex, as in the synchronous conditions of all previous experiments. In the present phase-shifted con-dition, target presentation was delayed by a half of the heartbeat period with respect to the R peak. Based on previous studies indicating large temporal variability for heartbeat detection and heartbeat-evoked elec-trophysiological responses (Brener and Kluvitse, 1988; Leopold and
Schandry, 2001;Knapp-Kline and Kline, 2005;van Elk et al., 2014a), we predicted that the frequency synchrony rather than precise phase is the target of cardio–visual suppression. If the visual suppression is related only to the heartbeat’s frequency information, that is, with no consider-ation of the phase of the stimulus relative to the heartbeat’s cycle, then we expected to see no difference in the duration of target presentation re-quired to break suppression in the two present conditions. However, if visual suppression is related to the exact moment of the QRS, then the present phase-shifted condition should show less suppression.
Experiment 7: visual crowding
To further address this issue of phase versus frequency modulation and to test the robustness of the frequency synchronous suppression of visual awareness, we used a novel experimental psychophysical design relying on visual crowding (Whitney and Levi, 2011). This is a drastically differ-ent paradigm from the previously used cardio–visual CFS paradigm be-cause it does not depend on interocular competition and does not rely on reaction times as a dependent measure. Rather, visual crowding involves limits of peripheral resolution in binocular vision and is reflected by a
Figure 1. Experimental setup and paradigm. a, The participant wore an HMD while her heart rate was recorded by ECG. The ECG signal was recorded in real time and was sent to a computer that generated visual stimuli flashing at the frequency of the participant’s heartbeat (synchronous trials) or at a modified frequency (asynchronous trials). b, Sequence of visual stimuli presented to the participant in the synchronous (top) and asynchronous condition (bottom). The Mondrian patterns were presented to the dominant eye at a fixed frequency of 10 Hz and the target (yellow octagon) was flashed to the other eye. In synchronous trials, the flashes of the target corresponded to the moment of the QRS complex obtained from the ECG signal and reflecting systolic contraction. The task of the participants was to indicate the position of the target with respect to the fixation cross (above or below). c, CFS control experiment (Experiment 4) in which Mondrian patterns and the target stimuli were presented to both eyes without any binocular rivalry to control for detection and response biases.
decrease of accuracy in nonspeeded discrimination tasks (for reviews see
Levi, 2008;Whitney and Levi, 2011).
Stimuli and procedure. The crowding experiment included 288 trials
divided into 6 blocks and lasted⬃1 h. Each trial began with the simulta-neous presentation of a H:1° by V:1° fixation cross at the top of the screen and an array of peripheral stimuli 8.7° below. This array comprised an 0.45° by 0.6° target (letter symbols: “ ”, “ ”, or “ ”) surrounded by eight flankers of the same size (letter symbol: “I”; center-to-center distance between target and flankers: 0.72°, 0.91°, 1.1°, or 1.29°; seeFig. 3a). All
stimuli were displayed in black against a white background (Michelson contrast⫽ 1). Although the flankers were displayed with a constant contrast, the target was flashed according to the participant’s heartbeat (synchronous, 80 –120% asynchronous, and delayed by 300 ms). The 500 ms flashing animation was done by applying a positive section of a sine function to the transparency of the target shape. Participants were asked to discriminate the target’s letter symbol as quickly and accurately as possible (i.e., three alternative forced-choice task) while constantly fixat-ing the fixation cross. Stimuli were presented for 6 s, durfixat-ing which par-ticipants could provide an answer with a key press at any time. If no response was provided at the end of this period, the 3 target letter symbols were presented for another 2 s, during which the subject provided a response. The target type, center-to-center distance between target and flanker, and cardio–visual synchronicity were fully randomized. A 1 s intertrial interval was used to avoid intertrial phase locking.
Experiment 8: high-resolution fMRI experiment without
interocular suppression
We designed two experiments using the same visual stimuli as presented to the nondominant eye of the participants from Experiments 1 and 2: a yellow octagon flashing above or below a fixation cross either synchro-nously (synchronous) or in one of the two asynchronous conditions (80% or 120%; asynchronous). However, in these experiments, the visual stimuli were presented with no masking so the stimuli were fully visible. The first experiment consisted of a localization task in which the subjects had to localize the octagon as being either above or below fixation while being uninformed of the relationship between the flashing of the target and their heartbeat (seeFig. 4a). The naivety of the subjects to this
rela-tionship was important to avoid recording any brain activity resulting from interoceptive attention to their heartbeat; therefore, this relation-ship was not mentioned before this task.
The second experiment was a heartbeat awareness task. The stimuli were identical to the localization task, but the participants were now informed about the cardio–visual feature of the target and they had to respond if the target was flashing synchronously or not with their heart-beat (seeFig. 4b). This second task served as a functional localizer for the
anterior insula regions, which have been shown previously to be acti-vated by interoceptive attention to one’s heartbeat (Critchley et al., 2004;
Wiebking et al., 2014).
Participants. Eight right-handed healthy volunteers (one female) from
the student population from Lausanne (age 20 –31 years, ⫽ 24.5 years) were scanned. One participant was removed from the data analysis due to motion artifacts⬎2 mm. All were right-handed by self-report; had a normal or corrected-to-normal vision; no cardiac, epilepsy, or psychiat-ric history; provided informed consent; and were paid for their partici-pation (⬃30 CHF). The study was approved by the Research Ethics Committee of EPFL.
Methods. An MR-compatible blood volume pulse (BVP) detection
sensor was placed on the middle finger of the left hand to record partic-ipants’ real-time heartbeat (Critchley et al., 2004). Following the findings of Experiments 6 and 7 showing that the cardio–visual suppression effect was related to the cardiac frequency rather than phase locked to the cardiac R peak, we used a BVP sensor in the fMRI studies. The BVP measures heart rate through detection of blood perfusion to the dermis and subcutaneous tissue of the skin. Pilot testing indicated that the BVP on the fingertip was delayed by⬃250 ms compared with the ECG R-wave, but that the frequency detected by the BVP and ECG systems was identical (also seeLu et al., 2009). An MR-compatible response box displaying two buttons was placed in the participant’s right hand. The visual stimuli were generated using ExpyVR, projected on a screen placed
inside the bore of the scanner behind the participant’s head, and were visible through a slanted mirror. The visual stimuli were presented bin-ocularly and the trials followed the same procedure using an event-related design in the localization and the heartbeat awareness tasks (see
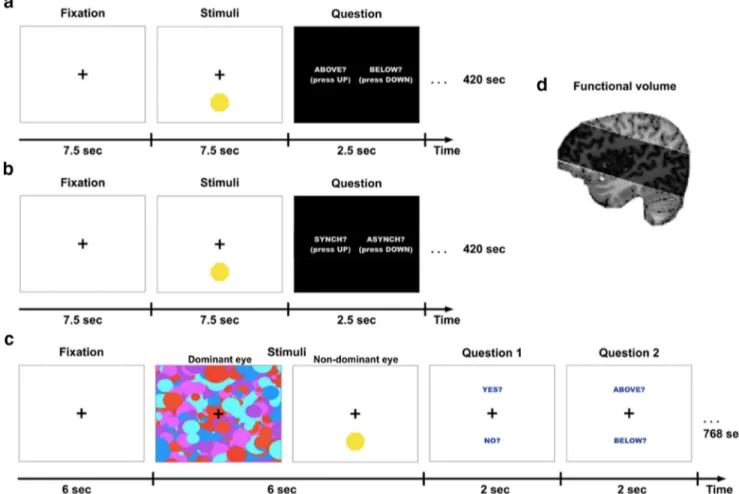
Fig. 4a,b). Trial duration was 17.5 s; the stimuli were presented for 7.5 s,
followed by 2.5 s for the question display, followed by a rest epoch lasting 7.5 s during which a fixation cross (RGB: 233,233,233) at visual angle: H:1°, V:1° was presented in the center of the screen. During the stimuli presentation, the fixation cross became black (RGB: 0,0,0) and the target (a yellow octagon; RGB: 255,255,0; visual angle: H:3°, V:3°) was flashed either above or below the black cross (3° of vertical distance from the cross) synchronously or asynchronously (80% or 120%) to the present heartbeat of the subject as recorded by the BVP sensor. This was followed by a response epoch lasting 2.5 s during which the possible responses “above” or “below” were presented in the trials of the localization task and “synchronous” or “asynchronous” in the trials of the heartbeat awareness task, with an indication of which response key to press for each choice (“up” or “down”; seeFig. 4a,b). In both the fMRI localization task
and the fMRI heartbeat awareness task, there were 24 trials per run and each run was repeated twice with the synchronous and asynchronous conditions presented in a random order. Each run had a duration of 420 s.
Scanning parameters. The MRI scanner was a 7T Siemens with a
32-channel Tx/Rx rf-coil (Nova Medical) (Salomon et al., 2014). The func-tional runs were acquired using echo-planar images of 34 axial slices (1.3 mm isotropic voxels with no gap) placed over the insular cortex (matrix size 160⫻ 160, FOV 210 mm, TE ⫽ 27 ms, TR ⫽ 2.5 s, GRAPPA 2; see
Fig. 4d). Each functional run comprised 168 volumes and lasted 420 s (7
min). The anatomical run was acquired using the MP2RAGE sequence (Marques et al., 2010; TE⫽ 2.63 ms, TR ⫽ 7.2 ms, TI1 ⫽ 0.9 s, TI2 ⫽ 3.2 s, TR⫽ 5 s) and lasted ⬃7 min.
Data analysis. fMRI data were analyzed using the “Brain-voyager”
software package (Brain Innovation) and complementary in-house soft-ware. The echo-planar images acquired during the functional runs were corrected for low frequencies (e.g., due to cardiac and breathing artifacts) and 3D motion and were then transformed to the native space of the anatomical run. The data of all participants were not transformed into a standardized space but rather were analyzed separately to benefit from the high spatial resolution offered by the 7T scanner. A general linear model (GLM) analysis was performed using a design matrix containing one regressor for the fixation epochs, one for the presentation of syn-chronous targets, one for asynsyn-chronous targets, one for the response epochs, and six additional ones taking into account the 3D motion cor-rections. Because respiration signals were not available, they were not regressed from the functional data. All regressors were modeled as boxcar functions convolved with a hemodynamic response function. Clusters of positive BOLD activity were used during the presentation of the stimuli (Synchronous⫹ Asynchronous ⬎ Rest contrast) in the heartbeat aware-ness task as localizers to select the regions of interest (ROIs) further used in the statistical analysis of the localization task. Noninsular brain regions activated by the localizer were analyzed to investigate whether the result obtained in the anterior insula was specific or if it was also found in other brain regions. The anterior cingulate cortex (ACC), right posterior supe-rior temporal gyrus (rSTG), and occipital visual regions were consis-tently activated and were selected as ROIs for each subject (at p⬍ 0.001 FDR).
ROIs in the right and the left anterior insula were selected manually for each subject using a p-value threshold of p⬍ 0.001 (FDR corrected). Other regions consistently activated in the localizer, such as ACC, rSTG, and occipital cortex, were also selected using the same threshold. The BOLD activity in the selected ROIs during the stimuli presentation of the localization task was further analyzed by means of an event-related aver-aging analysis. To determine the difference between these responses, the BOLD percentage signal change responses were averaged for the syn-chronous and asynsyn-chronous epochs corresponding to the two data points of the peak of the BOLD response (7.5–10 s) as well as the full time course. A repeated-measures ANOVA on the mean BOLD signal with side (left/right) and cardio–visual synchrony (synchronous/asynchro-nous) as within-subject factors was used to explore the effects of the
laterality of the anterior insula (right vs left) and the synchrony condi-tions (synchronous vs asynchronous) of the presented visual stimuli. To supplement the BOLD time course analysis, a ROI-GLM approach was used. ROI-GLM analysis was then applied to each of the ROIs (anterior insulae and other activated regions) independently using one predictor for synchronous trials and another one for asynchronous trials, as well as the motion predictors as nuisance regressors. The values of the two pre-dictors during the localization task were then compared with a t test for each ROI. To test for possible effects of cardiac activity on the results, the cardiac signal was regressed out using the RETROICOR approach (Glover et al., 2000). Using the BVP signal, the six cardiac specific regres-sors created by the RETROICOR toolbox were used used as control covariates in our design matrix. The data were then reanalyzed after the regression of the cardiac signals as described above.
Experiment 9: High-resolution fMRI experiment with CFS
In the second fMRI experiment, we presented the same visual stimuli as in Experiment 1 and 2: masks to the dominant eye and a yellow octagon flashing above or below a fixation cross either synchronously (synchro-nous) or in one of the two asynchronous conditions (80% or 120%; asynchronous) to the other eye. We used a method for dichoptic presen-tation of visual stimuli inside of the 7T MRI scanner (Schurger, 2009).
In the first experiment (CFS localization task), the participants were presented with the cardio–visual stimuli but were not able to see them consciously because they were suppressed by the dynamic high-contrast patterns presented simultaneously to their dominant eye. The second experiment was identical to the heartbeat awareness task of the first fMRI experiment and served the same purpose of functionally locating the anterior insula ROIs.
Participants. Nine right-handed healthy volunteers (two females; age:
22–27 years, ⫽ 24.6 years) were scanned. Participants were otherwise similar to those of Experiment 8. One participant was removed from the data analysis due to motion artifacts⬎2 mm.
Methods. The subjects were provided with a tailored pair of prism
glasses to wear inside the scanner and a piece of black-covered cardboard was used to separate the visual stream of each eye from the back of their head to the screen behind them to enable a dichoptic presentation of the stimuli. Trial duration was 24 s: after a 6 s fixation epoch, the stimuli were presented for 6 s. There were 2 s to respond to each of the 2 questions, which was followed by a rest epoch lasting 6 s. During rest, a fixation cross (RGB: 0,0,0; visual angle: H:1°, V:1°) was presented in the center of the field of view of both eyes (seeFig. 4c). During the stimulus presentation,
dynamic high-contrast masks were displayed to the dominant eye (visual angle: H:20°, V:10°) and the target (yellow octagon; RGB: 255,255,0; visual angle: H:3°, V:3°) was flashed either above or below the fixation cross (3° of vertical distance from the cross) to the nondominant eye synchronously or asynchronously (80% or 120%) to the present heart-beat of the subjects as calculated by the BVP sensor. This was followed by a first response epoch lasting 2 s, during which the possible responses “yes” or “no” were displayed, implying the question “Did you see a yellow octagon?” The second response epoch lasted 2 s, during which the words “above” or “below” were displayed, prompting the participants to re-spond to the question “Was the octagon above or below the fixation cross?” There were 32 trials in each run and each run was repeated twice with the synchronous and asynchronous conditions presented in a ran-dom order. Each run had a duration of 768 s. The heartbeat awareness task took place exactly in the same way as in the first fMRI experiment, with the stimuli sizes adapted to the CFS setup.
Scanning parameters. The same 7T MRI-scanner as in Experiment 8
was used and the functional runs were acquired using echo-planar im-ages of 34 axial slices (1.8 mm isotropic voxels with no gap) placed to comprise the primary visual cortex (V1), the insular cortex, and as much of the superior parietal cortex as possible (matrix size 160⫻ 160, FOV 210 mm, TE⫽ 27 ms, TR ⫽ 2.0 s, GRAPPA 2). Each functional run comprised 384 volumes and lasted 12.8 min.
Data analysis. Trials in which the participants reported to have seen
the yellow octagon (first question) were discarded. The same analysis as in fMRI Experiment 8 was then performed. The “Synchronous⫹ Asyn-chronous⬎ Rest” contrast (p ⬍ 0.05, FDR corrected) was used in the
heartbeat awareness task to locate the anterior insula and control ROIs functionally. The laterality (left/right) and synchronicity (synchronous/ asynchronous) effects of the BOLD activation in the unconscious task were then investigated on these ROIs and the other regions activated by the localizer (ACC, rSTG, and occipital cortex) by repeated-measures ANOVA and t tests. A similar ROI-GLM analysis as before was per-formed here. Once again, possible effects of cardiac activity on the results were tested for by regressing out the cardiac signal using the RETROI-COR approach (Glover et al., 2000) as described for Experiment 8.
Data analysis: all experiments
For all experiments, accuracy and response time were measured. Accu-racy was computed as the percentage of trials in which the location of the octagon was reported correctly. The main dependent measure was the duration of the target presentation (the yellow octagon) required to break suppression. Because heart rate showed considerable variability both within (SD range 1–12 BPM, mean ⫽ 3.7) and between ( ⫽ 12.4) participants, this measure was used because it normalized the data with respect to the within- and between-subject variance for heart rate. The duration of target presentation was recorded as the total time the visual stimulus was presented on the screen when the participants indicated that they had seen the stimulus. Only correct trials were analyzed. For each participant, trials in which the reaction time exceeded 2.5 SDs from the participant’s mean were defined as outliers and excluded from fur-ther analyses (total loss 5.2% of trials). For all CFS experiments (Exper-iments 1, 2, 4, 5, and 6), a t test was used to compare the mean accuracy and target presentation duration for synchronous and asynchronous tri-als. Null effects were assessed using Bayes factor (BF) tests with default prior scales (Rouder et al., 2009) using JASP (version 0.7.11). The BF allows assessment of the likelihood of the results based on the Bayesian prior. Therefore, a BF of⬍0.33 implies substantial evidence for the null hypothesis because it is 3 times more likely than the alternative hypoth-esis, 0.33⬍ BF ⬍ 3 suggests insensitivity of the data, and BF ⬎ 3 implies substantial evidence for the alternative hypothesis. Heartbeat data from all experiments were extracted from the ECG recording and analyzed using t tests.
Results
Suppression of synchronous cardio–visual stimuli: CFS
In the first experiment, we found that interoception modulated
visual awareness as synchronous cardio–visual stimuli took
lon-ger presentation durations to reach visual awareness ( ⫽ 3.6 s,
⫽ 1.2) compared with asynchronous cardio–visual ones ( ⫽
3.4 s,
⫽ 1.05, t
(29)⫽ 2, p ⫽ 0.02, Cohen’s d⬘ ⫽ 0.38;
Fig. 2
a).
This result provides empirical evidence for a direct influence of
the heartbeat on visual awareness (Experiment 1).
To ensure the robustness of the present heartbeat effect on
visual awareness, we repeated the experiment in a new group of
participants using a within-subject design (Experiment 2;
Fig.
1
b). Once again, synchronous cardio–visual stimulation required
more time to break suppression than asynchronous stimulation
(t
(14)⫽ 3.5, p ⫽ 0.008, Cohen’s d⬘ ⫽ 0.65;
Fig. 2
b).
We next tested whether our participants were able to
discrim-inate the synchrony between the flashing stimuli and their
heartbeat to assess whether explicit perception of cardio–visual
synchrony could have confounded our data. To assess the
partic-ipants’ interoceptive awareness, we conducted Experiment 3, in
which we presented the same visual stimuli (flashing either
syn-chronously or asynsyn-chronously to each participant’s heartbeat) to
both eyes (without any suppression), for a duration of 6 s. On
each trial, participants were asked to indicate whether the
stimu-lus was synchronized to their heartbeat. The results showed that
participants were at chance for judging cardio–visual synchrony
even when the flashing visual stimuli were fully visible ( ⫽ 52.8
⫽ 13.1, t
(22)⫽ 1.03, n.s., BF ⫽ 0.22), suggesting substantial
evidence for the null hypothesis (one-sample t test vs 50% chance
value). We investigated this further by correlating the
interocep-tive awareness accuracy scores with the cardio–visual
suppres-sion effects from the same subjects in Experiment 1. No
correlation was found between these scores (r
⫽ ⫺0.14, p ⫽ 0.52,
n.s.). A Bayesian Pearson correlation indicated a BF
⫽ 0.31,
which implies substantial evidence for the null hypothesis.
Therefore, these data indicate that explicit perception of cardio–
visual synchrony was unlikely to underlie the present cardio–
visual suppression effect. To ensure that the cardio–visual effect
on visual awareness was not caused by a response or detection
bias (e.g., faster responses for asynchronous stimuli after stimuli
became aware), we further conducted a classical CFS control
ex-periment (
Jiang et al., 2007
;
Salomon et al., 2013
) (Experiment 4),
in which the same stimuli were presented to both eyes with the target
superimposed on the patterned masks, thus not inducing any
intero-cular suppression (
Fig. 1
c). Performance in Experiment 4 showed no
difference between the synchronous and asynchronous
cardio–vi-sual stimulation (t
(29)⫽ 0.27, p ⫽ 0.39, BF ⫽ 0.34).
In addition, to ensure that the difference between
synchro-nous and asynchrosynchro-nous cardio–visual stimulation was not due to
subtle visual differences in the frequency of stimulation between
the synchronous and asynchronous conditions, we conducted a
fifth experiment (Experiment 5). Here, new subjects were shown
the exact same visual stimuli that were presented to participants
of Experiment 2 so that the stimuli were shown as temporally
decoupled from their heartbeats (i.e., subjects in Experiment 5
saw stimuli that were recorded from other participants in
Exper-iment 2). We reasoned that, if the difference between the
syn-chronous and asynsyn-chronous conditions found in Experiments 1
and 2 was driven by basic visual differences (e.g., stimulation
frequency) rather than by cardio–visual coupling, then such
dif-ferences should also be found in Experiment 5 because the visual
stimuli were identical apart from their decoupling from the
car-diac signal. The results showed that, when the visual stimuli were
coupled to the subjects’ heartbeat, the suppression effect was
sig-nificantly larger (t
(14)⫽ 2.69, p ⫽ 0.01) than when it was not
coupled to the subjects heartbeat. Furthermore, when decoupled
(Experiment 5), no differences between visual stimuli that were
“synchronous” or “asynchronous” to the heartbeat in
Experi-ment 2 (t
(14)⫽ 1.2, p ⫽ 0.12, BF ⫽ 0.5) were found and the
suppression effect was not different from 0 (t
(14)⫽ 1.23, p ⫽ 0.23,
BF
⫽ 0.5). These BFs suggest that the results are inconclusive
regarding the null or alternative hypothesis. Therefore, the same
visual stimulation shown to the participants of Experiment 2, but
without any cardio–visual coupling, did not induce significant
differences in CFS between synchronous and asynchronous
car-dio–visual stimulation found for the same stimuli presented in
Experiment 2 while coupled to the heartbeat. Furthermore, if the
visual stimuli themselves rather than cardio–visual coupling were
driving the effect, then we would expect the suppression effect
(i.e., the synchronous–asynchronous difference) to be correlated
between the participants of Experiment 2 and Experiment 5
be-cause they experienced the identical visual stimulation.
Subject-by-subject correlation analysis, however, did not indicate any
significant correlation (r
⫽ 0.26, p ⫽ 0.34). This indicates that
cardio–visual effects on CFS (Experiments 1 and 2) depend on
cardio–visual coupling and not on visual differences between
synchronous and asynchronous visual stimulation.
We next sought to test whether the suppression of
synchro-nous cardio–visual stimuli was phase-selective (i.e., locked to a
specific delay after the R-wave) or if it would occur for visual
stimuli that were at the same frequency of the heart but occurred
at different phases of the cardiac cycle. To this end, we conducted
a further CFS experiment (Experiment 6) in which the visual
stimuli were either synchronous to the participants’ heartbeat
or delayed (by half a phase) while maintaining the same
fre-quency. The results of Experiment 6 confirmed our
predic-tions as there was no significant difference in the duration
required to detect synchronous (
⫽ 5.5 s, ⫽ 1.7) versus
delayed phase-shifted ( ⫽ 5.5 s, ⫽ 1.6; t
(14)⫽ 0.036, n.s.,
BF
⫽ 0.25, i.e., suggesting substantial evidence for the null
hypothesis) cardio–visual stimuli.
Suppression of synchronous cardio–visual stimuli:
visual crowding
Next, we sought to exclude the possibility that the influence of
cardiac-interoceptive signals on visual awareness was specific to
the CFS task and determine whether the effect was a more general
Figure 2. Suppression of synchronous cardio–visual stimuli compared with asynchronous stimuli. a, Duration of target presentation required for synchronous and asynchronous cardio–visual stimuli to break suppression in Experiment 1 (n⫽ 30). b, Duration of target presentation required for synchronous and asynchronous cardio–visual stimuli to break suppression in Experiment 2 (n⫽ 12). Note that, in both experiments, when the stimuli were synchronous to the heartbeat, they required more presentations to enter consciousness. Error bars indicate SEM (*p⬍ 0.05, **p ⬍ 0.01).
phenomenon that also extended to other stimulation conditions.
We relied on visual crowding (Experiment 7), a drastically
differ-ent paradigm. Compared with CFS, which stems from
interocu-lar competition and relies on reaction time as a dependent
measure, crowding is due to limits of visual discrimination in
peripheral vision and is reflected by changes in accuracy measures
(
Whitney and Levi, 2011
). While constantly fixating at the top of
the screen, participants were presented with a letter-shaped visual
target that was surrounded by an array of eight similar flankers at
the bottom of the screen (
Fig. 3
a). The presence of flanking
dis-tractors causes the central target stimulus to be difficult to
recog-nize. Although the flankers were displayed constantly, the target
was flashed either synchronously or asynchronously with respect
to the participants’ heartbeat frequency and phase. An additional
condition in which the frequency was synchronous but the visual
stimulus was delayed by 300 ms (constant delay condition) was
also included to further test the effect of frequency versus
phase-related cardio–visual signals. Participants were asked to
discrim-inate the target (three-alternative forced choice task). As
predicted (based on our CFS results), we found that cardio–visual
stimulation affected the discrimination of crowded stimuli:
accu-racy was lower for stimuli presented synchronously with respect
to the heartbeat (accuracy for the smallest center-to-center
dis-tance:
⫽ 56.1 vs ⫽ 69.4, t
(14)⫽ 3.93, p ⫽ 0.0007, Cohen’s d⬘
⫽ 1.1;
Fig. 3
b). No effect on reaction times was found. This
ex-periment also provided additional evidence regarding the
sup-pression of frequency-shifted, but not phase-shifted stimuli
because the accuracy for the phase delay condition was
signifi-cantly lower than that for the asynchronous condition (t
(14)⫽
2.3, p
⬍ 0.05) and did not differ from the synchronous condition
(t
(14)⫽-0.22, n.s., BF ⫽ 0.86, i.e., inconclusive regarding the null
or alternative hypothesis), replicating the findings of Experiment
6. Previous results have shown that cardiac awareness is
modu-lated by increased cardiac activity (
Khalsa et al., 2009
). To assess
whether the heart rate per se had any effect on the cardio–visual
suppression effect, we compared effect sizes between participants
with higher heart rates and lower heart rates based on a median
split. Two-sample t tests indicated no differences in the cardio–
visual suppression effects sizes as a
func-tion of high versus low heart rates in any
of the experiments (Experiment 1, p
⫽
0.25, BF
⫽ 0.57; Experiment 2, p ⫽ 0.82,
BF
⫽ 0.47; Experiment 7, p ⫽ 0.87, BF ⫽
0.44; BF were inconclusive regarding the
null or alternative hypothesis).
Our results (Experiments 1 and 2)
show that visual stimuli presented
syn-chronously with one’s heartbeat take
more time to break suppression and enter
visual awareness compared with stimuli
presented asynchronously to the
heart-beat. These results indicate that the
car-diac rhythm affects how an external visual
stimulus gains access to awareness. This
effect is not related to explicit heartbeat
awareness (Experiment 3) or to a response
or detection bias (Experiment 4) and is
induced by subject-specific cardio–visual
coupling and not any other information
contained in the visual stimuli
(Experi-ment 5). Importantly, we also found that
this suppression extends to stimuli
pre-sented at the same frequency but phase
shifted (Experiments 6 and 7) and that this effect is not
depen-dent on interocular competition mechanisms or reaction time
measures because it was also found in accuracy measures in the
visual crowing experiment (Experiment 7).
These data show that cardiac interoceptive signals affect visual
awareness. We argue that the present findings are compatible
with predictive coding between the interoceptive and the visual
system. Previous work has shown attenuation (or suppression) of
sensory consequences for self-generated arm or eye movements
(
Guthrie et al., 1983
;
Blakemore et al., 1998
;
Shergill et al., 2013
).
The present data indicate that “self-generated” cardiac
move-ments (i.e., heartbeats) are also associated with suppression of
exteroceptive sensory consequences (i.e., visual signals) even if
artificially produced and rarely encountered in everyday life.
Our data point to the frequency of the cardiac cycle, which is
identical for all afferent and efferent signals relating to cardiac
information as the target for predictive suppression of these
sensory consequences.
Neural suppression of seen synchronous cardio–visual
stimuli: fMRI
We next wanted to investigate the neural mechanisms underlying
such cardio–visual stimulation. A prime candidate region
re-sponsible for suppressing such signals is the insular cortex
be-cause of the following: (1) it is involved in the processing of
interoceptive information including cardiac signals (
Craig, 2002
;
Critchley et al., 2004
), (2) it is involved in the the comparison of
auditory and cardiac signals (
Critchley et al., 2004
), and (3) it has
recently been hypothesized as a site for multimodal integration
and sensory prediction related to the self (
Critchley and Seth,
2012
;
Seth, 2013
). We therefore predicted that this region would
respond differently depending on the synchrony of cardio–visual
stimulation. We used high-resolution fMRI at 7T (see Materials
and Methods for full information concerning Experiment 8) and
tested whether activity in the insular cortex reflects differences
between synchronous and asynchronous cardio–visual
stimula-tion. Regions sensitive to interoceptive attention were localized
using an independent functional localizer task (
Fig. 4
b) adapted
Figure 3. Crowding experiment. a, Schematic of the crowding paradigm. Participants gazed on the fixation cross at the top of screen and were presented with a letter-shaped visual target that flashed either synchronously or asynchronously with respect to their heartbeat and was surrounded by an array of eight similar flankers. Participants were asked to discriminate the target as quickly and accurately as possible (three-alternative forced choice task). b, Results of the crowding experiment for distance 1. Participants showed reduced accuracy for the targets flashing synchronously compared with those flashing asynchronously to the heartbeat. Error bars indicate SEM (***p⬍ 0.001).
from an interoceptive attention task (
Critchley et al., 2004
)
known to activate the anterior insula region. Several regions were
consistently activated during the interoceptive attention task
in-cluding the bilateral anterior insulae, ACC, rSTG, and occipital
visual regions ( p
⬍ 0.001, FDR corrected). In the main
experi-ment, 8 participants viewed an unmasked octagon flashing
syn-chronously or asynsyn-chronously to their heartbeat and were asked
to report its location (i.e., above or below fixation;
Fig. 4
a). This
task was always performed before the localizer task to ensure that
participants were naive to the purpose of Experiment 8.
Estimat-ing the mean BOLD signal response in the left and right anterior
insulae (as defined above) for the synchronous and asynchronous
cardio–visual conditions, we found that insula activation was
weaker during synchronous than asynchronous cardio–visual
stimulation (F
(1,6)⫽ 17.7, p ⫽ 0.005), compatible with
suppres-sion of visually induced activation in the insula depending on
cardio–visual synchrony (
Fig. 5
a: single representative subject;
Fig. 5
b: group data). Analysis of other regions activated by the
interoceptive task (ACC, rSTG, occipital cortex) showed no
dif-ference between the synchronous and asynchronous
cardio–vi-sual stimulation (
Fig. 6
). Regressing out the cardiac signal using
the RETROICOR approach (
Glover et al., 2000
) did not affect the
results. The difference between the BOLD activity in the anterior
insulae between synchronous and asynchronous conditions was
significant (F
(1,6)⫽ 18.4, p ⫽ 0.005), with no difference between
the left and right insulae (F
(1,6)⫽ 1.3, n.s.). This suggests that the
results in the anterior insulae are independent of vascular
fluctu-ations and are more likely to reflect neuron-related BOLD
changes. Furthermore, these results show that the insula is
sensi-tive to cardio–visual synchrony, as characterized by a decreased
activation during synchronous cardio–visual stimulation.
Neural suppression of unseen synchronous cardio–visual
stimuli: fMRI
We next wanted to test whether this insular suppression of BOLD
activity extends to cases in which the visual stimulus is rendered
invisible, as was the case in our CFS experiments. To this end, we
used an MRI-compatible CFS system (
Schurger, 2009
) and
pre-sented participants with stimuli identical to those of the first
imaging experiment except that they were rendered fully invisible
by CFS (see Materials and Methods for further details;
Fig. 4
c).
CFS successfully rendered the visual stimuli invisible (as
deter-mined by subjective and objective measures). We restricted our
analysis to trials in which the participants were fully unaware of
the visual stimuli (78.6% of trials). Even when the visual stimuli
were rendered fully invisible through CFS, we found lower
acti-vations in the anterior insulae for synchronous compared with
asynchronous stimuli (F
(1,7)⫽ 9.3, p ⫽ 0.018; see
Fig. 7
a for a
single representative subject and
Fig. 7
b for group data).
There-fore, we replicated the findings of the first fMRI experiment in an
Figure 4. High-resolution imaging paradigms. a, fMRI localization task in which participants viewed the same stimuli used in Experiments 1 and 2 but with no binocular masking. Participants were asked to report the location (above or below fixation) of the octagon which, unbeknownst to them, was flashing synchronously or asynchronously with their heartbeat. b, fMRI heartbeat awareness task in which participants viewed the exact same stimuli as the localization task but were now informed that the flashing was related to their heartbeat and were requested to detect whether the flashes were synchronous or asynchronous to their current heartbeat. This was used as a functional localizer for the anterior insula regions. c, CFS localization task. In Experiment 9, the octagon (flashing synchronously or asynchronously to their heartbeat) was rendered continuously invisible by high-contrast masks presented to the dominant eye (as in Experiments 1 and 2). Participants were asked to guess the location of the stimuli and report whether they saw the target at any time during the trial. d, Functional volume scanned in high-resolution fMRI at 7T.
independent subject sample and extended this finding to unseen
cardio–visual stimuli. Importantly, this effect was robust and
sta-ble in 14 of the 15 present fMRI participants, showing lower
BOLD activity in the synchronous condition in the right anterior
insula. This provides important support for the role of the
ante-rior insula in unconscious processing of cardio–visual stimuli. To
ensure further that the suppression effect was only found in the
insula, we analyzed control regions as in the first fMRI
experi-ment, which showed no differential activity between the two
car-dio–visual conditions. After regressing out the cardiac signal, the
difference between synchronous and asynchronous conditions in
the insulae was significant (F
(1,7)⫽ 6.4, p ⫽ 0.039), with no
difference between the left and right insulae (F
(1,7)⫽ 0.008, n.s.).
Discussion
Collectively, the present data show that interoceptive signals of
cardiac origin modulate access to visual awareness. Visual stimuli
presented synchronously to the cardiac frequency required
lon-ger presentations to reach awareness (CFS: Experiments 1 and 2)
and were discriminated with lower accuracy (crowding:
Experi-ment 7). Control experiExperi-ments indicated that this effect is
inde-pendent of explicit heartbeat awareness (Experiment 3), not due
to a response or detection bias (Experiment 4), and is induced by
subject-specific cardio–visual coupling (Experiment 5).
Impor-tantly, we found that this suppression extends to stimuli
pre-sented at the same frequency but phase-shifted compared with
the periodic heartbeat (Experiments 6 and 7). High-resolution
imaging indicated that insular cortex showed decreased BOLD
activation in response to both visible (Experiment 8) and
invisi-ble (Experiment 9) visual stimuli that were synchronous to the
participants’ heartbeat.
We suggest that this effect is due to the conflicting
require-ments of monitoring the heartbeat while minimizing its effects on
perception. The heartbeat is a lifelong and critical signal for the
organism, which must be monitored continuously and kept
within tight limits to avoid, for example, arrhythmia or asystolia;
such monitoring, in most instances, occurs outside of awareness
because one does not experience control over one’s heart.
How-ever, our heartbeat also produces widespread sensory
conse-quences in the tactile, proprioceptive, auditory, and visual
domains. For example, the heartbeat affects tactile afferent
out-put (
Macefield, 2003
), muscle spindle discharge (
Birznieks et al.,
2012
), and generates mechanical effects on the eyes modulating
interocular pressure and eye movements (
de Kinkelder et al.,
2011
). Suppression of the sensory consequences related to these
cardiac effects is thus desired for an accurate perception of
exter-nal stimuli. Comparable to suppression of the consequences of
our actions in tactile (
Blakemore et al., 1998
;
Bays et al., 2006
;
Shergill et al., 2013
), auditory (
McGuire et al., 1995
;
Baess et al.,
2009
;
van Elk et al., 2014b
), and visual domains (
Volkmann et al.,
1980
;
Guthrie et al., 1983
), we propose that the present effects of
the heartbeat on visual awareness reflect a basic and likely
predic-tive mechanism to suppress the “self-generated” sensory
conse-quences of the heartbeat from awareness. The present effect is
consistent with suggested interoceptive predictive mechanisms
(
Seth et al., 2011
;
Seth, 2013
;
Barrett and Simmons, 2015
),
pre-dicting the sensory consequences of interoceptive activity and
reducing its effects on perception.
Although CFS techniques have been used extensively to
inves-tigate unconscious processing (
Jiang et al., 2007
;
Faivre et al.,
2014
;
Salomon et al., 2015a
;
Salomon et al., 2015b
), the breaking
CFS measure as a proxy for conscious access has been criticized
recently (
Stein et al., 2011
;
Yang et al., 2014
). It has been proposed
that the typical control condition in which no interocular
sup-pression is used and no difference in supsup-pression is found may be
Figure 5. High-resolution imaging of cardio–visual sensitivity in the anterior insulae. a, Average BOLD signal response for synchronous (blue) and asynchronous (red) cardio–visual stimuli from left and right anterior insulae of a single subject (outlined in green on axial slices). b, Group average of BOLD time course for synchronous (blue) and asynchronous (red) cardio–visual stimuli from the left and right anterior insulae of all subjects. Middle, Mean of BOLD peak response for group. Error bars indicate SEM (**p⬍ 0.01).
insufficient to rule out that differences in reaction times are due
to postperceptual processes. In the current study, however, the
breaking CFS paradigms were supplemented with an additional
psychophysical method of visual crowding (Experiment 7),
which allowed us to replicate our finding in the accuracy domain,
thus circumventing the possible limitations of time to emergence
used with the CFS method. Furthermore, using Bayesian statistics
to complement nonsignificant effects, we found a BF of 0.34 for
the CFS control experiment (Experiment 4), which indicates that
the null effect is nearly three times as likely as the alternative
hypothesis. Finally, we found cortical suppression effects under
full suppression, in which the participants are completely
un-aware of the stimuli, independently of time to emergence
mea-sures. Therefore, by using multiple paradigms, Bayesian statistics,
and full-suppression methods, we are confident that our finding
is independent of possible confounds related to time to
emer-gence measures.
Interoceptive information regarding cardiac activity is
con-veyed by several afferent sources, including cardiac and
somato-sensory mechanoreceptors as well as blood vessel baroreceptors
(
Knapp and Brener, 1998
), and is affected by several cardiac
fac-tors (
Schandry et al., 1993
). Previous investigations of cardiac
Figure 6. BOLD response in noninsular regions activated in the heart awareness task. Mean time course of the group for noninsular regions activated in the heart awareness task in fMRI Experiment 8 is shown. Note that no difference was found in BOLD response between the synchronous and asynchronous conditions in any of these regions.
influences on behavior and neural processing have focused on
specific epochs of the cardiac cycle (e.g., systole vs diastole) and
have been successful in showing cardiac effects on somatosensory
(
Edwards et al., 2009
;
Gray et al., 2009
), nociceptive (
Edwards et
al., 2001
;
McIntyre et al., 2006
;
Edwards et al., 2008
;
Gray et al.,
2010
), and emotional (
Gray et al., 2007
;
Gray et al., 2012
;
Garfin-kel et al., 2014
) processing. Importantly, these afferent signals
have variable delays in respect to the R-wave, as shown by
previ-ous studies on heartbeat awareness (
Brener et al., 1993
;
Ring and
Brener, 1996
) and heart-related neural activity (
Leopold and
Schandry, 2001
;
van Elk et al., 2014a
). In contrast, the frequency
of cardiac-related effects is identical across all afferent inputs.
Here, we extend the aforementioned findings and show
behav-ioral and neural suppression for visual targets synchronous to the
participants’ cardiac frequency. Although the heartbeat is a
peri-odic signal, its sensory consequences differ in their temporal
de-lay as a function of the distance from the heart. Accordingly, a
predictive model (
Seth et al., 2011
;
Brown et al., 2013
) based on
the frequency but regardless of the phase of the cardiac cycle
could be effective for the suppression of its sensory consequences
no matter where they occur compared with the heart. Consistent
with this view, a previous study investigating the neural
suppres-sion of cardiac-related auditory stimuli indicated auditory
sup-pression depending on cardiac frequency but not cardiac phase
(
van Elk et al., 2014a
). Therefore, the present results indicate a
role for cardiac frequency in the attenuation of the sensory
con-sequences of interoceptive signals (see
Aspell et al., 2013
;
Suzuki
et al., 2013
for frequency-based effects on behavior).
At the neural level, our data show that the insular cortex is
sensitive to the synchronicity of visual and cardiac signals for
both visible and invisible visual stimuli. This region is thought to
enable the convergence of interoceptive and exteroceptive signals
(
Craig, 2002
;
Critchley et al., 2004
;
Wiebking et al., 2014
) and has
recently also been proposed to underlie self-awareness (Damasio,
2000;
Craig, 2009b
;
Craig, 2010
;
Apps and Tsakiris, 2014
) and
exteroceptive multisensory bodily perception and movement
control in healthy and neurological patients (
Karnath et al., 2005
;
Heydrich and Blanke, 2013
). These results converge in suggesting
the possible role of the insula for multimodal predictive coding
(
Singer et al., 2009
;
Seth et al., 2011
;
Apps and Tsakiris, 2014
) and
salience processing (
Seeley et al., 2007
). The current findings
fur-ther suggest that the anterior insular cortex may constitute a site
for multimodal integration of internal and external sensory
sig-nals through interoceptive predictions (
Seth et al., 2011
;
Brown et
al., 2013
;
Seth and Critchley, 2013
;
Barrett and Simmons, 2015
).
We propose that these predictive mechanisms allow suppressing
the sensory consequences of cardiac activity by integrating
inter-nal somatic states with exterinter-nal sensory information (
Craig,
2002
;
Critchley et al., 2004
;
Preuschoff et al., 2008
).
Although the data are consistent with interoceptive predictive
coding accounts in the anterior insular cortex, we cannot rule out
other possible interpretations of the findings. The insular cortex
has been found to be activated by a wide range of perceptual and
cognitive processes (
Kurth et al., 2010
). The anterior insula has
been implicated in temporal processing (
Craig, 2009a
;
Wiener et
al., 2010
), which has been suggested to relate to its role in
inte-grating internal interoceptive temporal cues with external signals
(
Wittmann, 2009
;
Wittmann et al., 2010
). Indeed, the anterior
insula has been activated in studies investigating temporal
syn-chrony (
Bushara et al., 2001
) and the sense of agency and error
monitoring that require matching exteroceptive sensory signals
with self-generated actions (
Menon et al., 2001
;
Klein et al., 2007
;
Karnath and Baier, 2010
;
Sperduti et al., 2011
;
Klein et al., 2013
).
Therefore, it is possible that the observed increased anterior
in-sular activation by asynchronous cardio–visual stimuli reflects
sensitivity to the temporal disparity between the visual stimulus
Figure 7. High-resolution imaging of cardio–visual sensitivity in the anterior insulae during CFS. a, Average BOLD signal response for synchronous (blue) and asynchronous (red) cardio–visual stimuli from left and right anterior insulae of a single subject (outlined in green on axial slices). b, Group average of BOLD time course for synchronous (blue) and asynchronous (red) cardio–visual stimuli from the left and right anterior insulae of all subjects. Middle, Mean of BOLD peak response for group. Error bars indicate SEM (*p⬍ 0.05).