HAL Id: inserm-00292150
https://www.hal.inserm.fr/inserm-00292150
Submitted on 22 May 2014HAL is a multi-disciplinary open access archive for the deposit and dissemination of sci-entific research documents, whether they are pub-lished or not. The documents may come from teaching and research institutions in France or abroad, or from public or private research centers.
L’archive ouverte pluridisciplinaire HAL, est destinée au dépôt et à la diffusion de documents scientifiques de niveau recherche, publiés ou non, émanant des établissements d’enseignement et de recherche français ou étrangers, des laboratoires publics ou privés.
The Data from an Epidemiologic Study on the Insulin
Resistance Syndrome Study: the change and the rate of
change of the age-blood pressure relationship.
Michel Safar, Céline Lange, Jean Tichet, Jacques Blacher, Eveline Eschwège,
Beverley Balkau, The Desir Study Group
To cite this version:
Michel Safar, Céline Lange, Jean Tichet, Jacques Blacher, Eveline Eschwège, et al.. The Data from an Epidemiologic Study on the Insulin Resistance Syndrome Study: the change and the rate of change of the age-blood pressure relationship.: Rate of change of the age-blood pressure re-lationship. Journal of Hypertension, Lippincott, Williams & Wilkins, 2008, 26 (10), pp.1903-11. �10.1097/HJH.0b013e32830b8937�. �inserm-00292150�
The D.E.S.I.R. study: the change and the rate of change of the
age-blood pressure relationship.
Michel E Safar
a,b, Céline Lange
c,d, Jean Tichet
e, Jacques Blacher
a,b,
Eveline Eschwège
c,d, Beverley Balkau
c,d, and the D.E.S.I.R. Study Group
ea
Paris-Descartes University, Faculty of Medicine, Hôtel-Dieu Hospital (MES, JB), F-75001 Paris, France;
b
AP-HP, Diagnosis Center (MES, JB), F-75001 Paris, France;
c
INSERM U780 (CL, EE, BB), Epidemiological and Biostatistical Research, F-94807 Villejuif, France ;
d
Univ Paris-Sud (CL, EE, BB), IFR69, F-94807 Villejuif, France;
e
Institut inter Régional pour la Santé (JT, D.E.S.I.R. Study Group), F-37521 La Riche, France.
Running title: Rate of change of the age-blood pressure relationship
Correspondence to
Beverley Balkau INSERM U780
16 Ave Paul Vaillant-Couturier F-94807 Villejuif, France Tel.: 00 33 1 45 59 51 61 Fax: 00 33 1 47 26 94 54 Email: [email protected]
Abstract
Objective: Systolic and diastolic blood pressure (SBP and DBP) increase significantly until around
55 years, when SBP increases, DBP decreases. Whether the rates of change of SBP and DBP with age
exhibit a similar dissociation has never been investigated.
Design and participants: D.E.S.I.R., a 9-year longitudinal study included 2,278 men and 2,314 women,
30-65 years and SBP, DBP, and other cardio-metabolic risk factors were determined every three years.
Results: Both SBP and DBP increased with age, more rapidly in women than in men. SBP and DBP were
higher in the presence of risk factors (except smoking) but the increases with age were similar. For the
rates of change, whereas ∆SBP increased linearly with age, ∆DBP declined as early as 45 years. This
finding was not influenced by gender, menopause or other risk factors but was significantly attenuated in
the presence of hypertension at baseline, whether treated or not, and mainly in men.
Conclusions: DBP increases with age between 30 and 60 years, ∆DBP tends to be markedly reduced as
early as 45 years, in contrast with ∆SBP. Consequences for the understanding of vascular aging and antihypertensive therapy remain to be explored.
Number of words: 191
Introduction
Antihypertensive therapy has considerably improved cardiovascular (CV) risk in people treated for
hypertension [1,2].The major beneficial effect of CV prevention has been for stroke, congestive heart
failure and renal insufficiency. Less progress has been made for the prevention of coronary heart disease.
Despite an adequate drug treatment, a significant residual coronary risk is commonly observed during the
long-term follow-up of hypertensive subjects [3]. Furthermore, a very particular haemodynamic pattern is
frequently observed during antihypertensive therapy: while diastolic blood pressure (DBP) is adequately
controlled (≤ 90 mm Hg), systolic blood pressure (SBP) remains frequently elevated above 140 mm Hg [4]. This haemodynamic profile, which is commonly observed in the elderly, even in the total absence of
antihypertensive drug treatment, is traditionally attributed to an age-induced increase in arterial stiffness
together with the presence of altered wave reflections [5, 6]. This observation suggests that, during chronic
drug therapy, consistent interactions occur in the long term between aging, high SBP and/or DBP, and
antihypertensive treatment. Such interactions are difficult to clarify because the duration of therapeutic
trials approximates 3–5 years, while that of antihypertensive therapy is close to 30 years (and even longer).
Taken together, these findings indicate the need to develop studies evaluating in parallel the changes of
brachial SBP and DBP and the progressive development of vascular aging.
D.E.S.I.R. (Data from an Epidemiologic Study on the Insulin Resistance syndrome) is a cohort of more
than 4,500 men and women aged 30–65 years at inclusion, who were investigated every 3 years for a total
of 9 years follow-up [7]. From this long-term survey, it is possible to evaluate not only the mean values of
SBP and DBP with age, but also the rate of change of this classical relationship, i.e. the change in SBP or
DBP per unit year (∆SBP or ∆DBP), in each gender, according to age at baseline. From the present D.E.S.I.R. study and other investigations [7-12], we know that the mean values of SBP and DBP increase
progressively with age but also that, above 50-60 years of age, mean values of SBP increase with age while
mean values of DBP begin to lower. Our working hypothesis is that the evolution of ∆SBP and ∆DBP also differ consistently, particularly ∆DBP, and that this process might influence the effects of drug treatment.
The role of major cardiovascular risk factors such as smoking, blood pressure (BP), body weight, plasma
cholesterol and glucose was systematically investigated.
Methods
Participants
The main objective of the 9-year longitudinal study D.E.S.I.R., was to clarify the development of the
insulin resistance syndrome. It is not a population based study, but a study of individuals who volunteered
for a heath check-up and who were willing to participate in a 9-year study. Participants were recruited over
the period 1994 to 1998 from ten Health Examination Centres from volunteers insured by the French Social
Security system, which offers periodic health examinations free of charge: 85% of the French population is
eligible for these examinations [7]. The total population in the geographical area of our study was over four
million inhabitants, and 90,000 individuals benefit from such examinations each year.. The protocol was
approved by the CCPPRB (“Comité Consultatif de la Protection des Personnes pour la Recherche
Biomédicale”) of Bicêtre Hospital, Paris, and participants signed an informed consent.
The analysis included 2,278 men and 2,314 women, aged 30 to 65 years, with measures at baseline for all
studied parameters and at least one other measure of BP at one of the follow-up examinations at 3, 6 and 9
years after inclusion.
Measures
Arterial blood pressures were measured in a supine position after 5 minutes rest. Both at inclusion and at
the 3-year follow-up examination, a mercury sphygmomanometer was used and at the 6- and 9-year
examinations, an OMRON HEM-705CP. According to the validation study by O’Brien et al. [13] the
OMRON HEM-705O device measures SBP 2 mmHg and DBP 1 mmHg lower than a standard mercury
sphygmomanometer; we added these differences to the Omron measured blood pressures. Participants were
calculated. The waist was measured as the smallest circumference between the lower ribs and the iliac
crest. Hypertensive treatment and hormone replacement therapy were recorded.
All biochemical measurements were from one of four health-centre biological laboratories located in
France at Blois, Chartres, La Riche or Orléans. Total cholesterol, HDL-cholesterol and triglycerides, were
assayed by DAX 24 (Bayer Diagnostics, Puteaux, France) or KONE (Evry, France). The fasting plasma
glucose, measured by the glucose-oxidase method, was applied to fluoro-oxalated plasma using a
Technicon RA1000 (Bayer Diagnostics, Puteaux, France) or a Specific or a Delta device (Konelab, Evry,
France). The inter-laboratory variability was assessed monthly on normal and pathological values for each
biologic variable, the coefficients of variation for laboratories being lower than 6% over the inclusion
period.
The examining physician noted the menopausal status of the women at each of the four examinations; no
hormonal tests to validate this status were carried out. The information was inconsistent for some of the
women, so that we were able to class only 2,202 of the 2,314 women: 878 were postmenopausal at entry
into the study, 575 were menopaused during the study, and 749 were premenopausal at the end of the
nine-year follow-up. Hormone replacement therapy was taken by 853 women, of whom 361 were
postmenopausal: 69 women did not provide information about hormonal replacement therapy.
Cardio-metabolic risk factors were defined as follows [14]:
- Overweight: BMI ≥ 25 kg/m2;
- Abdominal obesity: waist circumference > 102 / 88 cm, men/women;
- High blood pressure: SBP ≥ 130 mmHg and/or DBP ≥ 85 mmHg; - Smoker: current smoker;
- Hyper-cholesterolaemia: cholesterol: ≥ 5.70 mmol/l; - Hyper-triglyceridaemia: triglycerides ≥ 1.69 mmol/l;
Glucose status (diabetic: treated or fasting plasma glucose ≥ 7.0 mmol/l, impaired fasting glucose: fasting plasma glucose between 6.1 and 6.9 mmol/l, normal: fasting plasma glucose < 6.1 mmol/l.)
Statistical methods
The characteristics of the individuals, their SBP, DBP are presented at inclusion in the study, according to
sex, by means (standard deviations) and percentages. We studied, the SBP and DBP of each individual,
over the 9 years of follow-up, by two metrics: their values at baseline, and their rate of change per year,
∆SBP, ∆DBP, assuming a linear relation over the time period.
The relations between baseline SBP and DBP mean values and age, called “SBP and DBP mean values”,
were modelled by linear regression with respect to baseline age (as a continuous parameter) [11], and
likelihood ratio tests determined whether these relations were better described by a linear or a curvilinear
relation with age, by the addition of a squared term in age. These relations are shown graphically, with the
observed data as points on the graphs by 5-year age groups, along with the modelled curve. We compared
the relations between men and women, using likelihood ratio tests and present the regression relations with
a) separate curves or lines, or with b) a combined curve or line if they did not differ significantly according
to sex. These relations were also studied according to strata of cardio-metabolic risk factors, presence of
anti-hypertensive drug treatment, menopausal status and hormone replacement therapy. For the different
classes of antihypertensive agents, the numbers treated were too small to allow an adequate statistical
evaluation (Table 1).
The changes per year in SBP and DBP were studied according to age at entry into the study, and by sex.
For each subject a slope, or a change per year, was calculated for SBP and DBP over the nine years of the
study, called “∆SBP” and “∆DBP”. These values are shown graphically by 5-year age groups and modelled by regression analysis, according to age at entry into the cohort, with tests for linearity in age. These
relations are shown graphically. We compared the relations between men and women using likelihood ratio
differ according to sex. These relations were also studied according to strata of cardio-metabolic risk
factors and other factors indicated above.
A change in the intercept without any change in slope indicated a shift of the curve. A change in the slope
indicated a change in the sensitivity of the system.
Analyses used SAS Version 8.2 (SAS Institute Inc. Cary, NC USA).
Results
General characteristics of the studied population
Table 1 shows the mean value of clinical and biological parameters and their evolution per year, assuming
a linear progression. For the same age, and a similar percentage of antihypertensive drug therapy, women
had a significantly lower mean weight, height, waist circumference, SBP and DBP than men, but a higher
mean heart rate. Changes per year in weight and waist circumference were higher in women than in men,
but an opposite finding was observed for the changes per year in SBP and DBP. Changes in biological
parameters slightly differed between men and women during the follow-up. Antihypertetnsive treatment
was mainly with beta blockers and ACE inhibitors; at inclusion angiotensin receptor blockers were not
available.
Mean values of brachial SBP and DBP at inclusion by age and sex
At each age range at inclusion, the mean SBP was lower in women than in men (Fig. 1A). However, both
in men and women, SBP increased linearly and significantly with age, at a higher rate (P < 0.0001) and
with a lower intercept (P < 0.0001) in women than in men. In women, this latter finding was even more
pronounced in postmenpause than in the premenopause; women who became menopaused during the
follow-up having the greatest increase (data not shown). For SBP, the same model was studied in
populations divided according to values of cardio-metabolic risk factors (BMI, BP status, smoking, total
cholesterol, glucose status as well as waist circumference, HDL-cholesterol, triglycerides, menopause (data
risk factors, antihypertensive drug treatment and hormonal replacement therapy (Table 2). There was one
other exception: when individuals were divided according to BP status, for men and women without high
BP at inclusion, there was little variation in mean SBP with age (Fig. 2A); for men and for women with
high BP the intercepts were higher, with almost identical SBP-age coefficients.
There was a significant increase in DBP with age (Fig. 1B), with lower values in women than in men at
each age range. In men and women, the best model was curvilinear, with a significantly steeper slope with
age in women than in men. These relations were little changed in the presence of other cardiovascular risk
factors or according to menopause (Table 2): when one of these risk factors was increased, equations of the
model generally did not change their slope but had a significantly higher intercept, except for smoking in
men. This was also true for men and women with high and with low BP where there were similar relations
between DBP and age (Table 2, Fig. 2B).
In summary, the mean values of SBP and DBP increased with age, both in men and women. The increase
in SBP and DBP with age was steeper in women than in men, particularly in postmenopausal women. The
model relating BP to age was linear for SBP and curvilinear for DBP. The presence of other cardiovascular
risk factors changed little the slope with age but was associated with a consistent increase in the intercept,
except for smoking. These conclusions held when account was taken of blood pressure treatment (Table 2).
Mean change of SBP and DBP per year (∆SBP and ∆DBP) by age at inclusion and by sex
Figure 3 shows the mean change per year of SBP, ∆SBP (Fig. 3A), and of DBP, ∆DBP (Fig. 3B), according to age and sex in the overall population.
For ∆SBP in the total population (Fig. 3A), the mean change per year increased significantly with age, with higher values (P < 0.0001) in men than in women. There was a similar slightly curvilinear model
(P < 0.05) in both sexes with the increase being less pronounced at higher ages. The presence of the factors
cited above did not modify this description (Table 3), and there was no longer a significant curvature when
or without high BP at inclusion, there was an increase in ∆SBP with age of 0.4 mmHg per 10 years of age, with a similar increase for women (Table 3). However, men and women with high BP had respectively, a
yearly change 0.82 and 0.89 mmHg lower than those without high BP at inclusion.
The ∆DBP by age model exhibited a very particular aspect (Fig. 3B), as it was identical and curvilinear for both men and women, with a maximum value around 45 years of age, after which ∆DBP decreased with age, showing negative values, after the age of 60 years. The finding was unaffected by the presence of the
various covariates (Table 3), with the exception of high BP. In all of these cases the ∆DBP curves were separated, with the men and women at lower risk having a higher ∆DBP. The ∆DBP-age relation remained curvilinear only for the men. This result indicates that over 45 years of age, ∆DBP is reduced more and more with increasing age, particularly in those with high BP at baseline.
In summary, the relation between age and ∆SBP and ∆DBP differed markedly, increasing with age for ∆SBP and decreasing for ∆DBP. This latter observation was not influenced by sex, or other possible confounders, excepting for antihypertensive treatment in women (Table 3).
Discussion
This analysis of the D.E.S.I.R. study of 2,278 men and 2,314 women, was focused on the long term
changes of SBP and DBP with age, between the ages of 30 and 65 years. While some participants were
over 60 years at inclusion, D.E.S.I.R. did not include a "true" geriatric population. Indeed, it is well
established in studies of CV epidemiology that around 55-60 years of age, the increase in SBP with age is
associated with a progressive and consistent reduction of DBP with age [8-12]. In the present longitudinal
study (Fig. 1A and B), we showed that both the mean values of SBP and DBP increased markedly with
age-class and were influenced by sex, menopausal status and metabolic disorders (cholesterol, glycaemia,
obesity, …). All these factors are usually associated with a shift of SBP and DBP toward higher BP values
was shown for the first time: the rate of change in SBP or DBP per year with age differed markedly for
each of the two parameters. This rate increased progressively as function of age for SBP, but in contrast,
decreased significantly with age for DBP, as soon as the age of 40–45 years had been reached. Thereafter,
the rate of change of DBP per year decreased progressively and markedly with increasing age. This finding
was independent of sex, menopausal status and increased levels of BMI, waist circumference, plasma
cholesterol, glucose and triglycerides. The only exception to this rule was the case of high BP, in which,
particularly in men, the process of reduced ability to decrease DBP with age was consistently attenuated or
even disappeared.
This investigation was performed on the basis of non-invasive brachial BP measurements.
A limitation of the study was that, primarily, a mercury sphygmomanometer was used for BP
measurements, and, then after 3 years follow-up, an OMRON-device was used. However, in the present
study, we accounted for this change and verified that it did not modify at all the classification of the overall
population. Furthermore, our longitudinal study gave similar results to those previously obtained in the
literature. In fact, as in all epidemiological reports, the principal limitation of the investigation was the site
of BP measurements: the brachial artery [12]. Indeed, SBP is the most reproducible parameter to determine
at the brachial artery site. However as a consequence of the presence of physiological SBP amplification,
brachial SBP must be considered as a local parameter, which does not reflect central SBP measurements,
except in subjects above 50 years of age without any tachycardia [11,12]. On the other hand, DBP, which is
known to involve many errors in its measurement, is not a totally local parameter since its value is almost
the same in the entire arterial tree. Brachial DBP may reflect adequately central DBP, and thus might be an
index of the perfusion pressure of coronary arteries. In the present study, it is the change in DBP according
to age, which was mostly studied. Thus, the errors of DBP measurements during the long-term follow-up
might be largely minimized. On the other hand, it is well accepted that the OMRON device that was used
for many of the measures in this study is known to predict very adequately the level of CV risk [15]. The
results can be generalised to the population, taking into account the characteristics of the French Social
Security System.
The principal result of this investigation was obtained from the calculation of the mean change of
SBP and DBP per unit year (ie. the rate of change) during the follow-up. Whereas the mean values of SBP
and DBP both increased across the different age ranges, the rates of changes of SBP and DBP per year
were strikingly dissociated. Across the age ranges, this change increased markedly with age for SBP but
markedly decreased with age for DBP (Fig. 3A and 3B). The mathematical model was curvilinear for
∆DBP with age, the maximum value being observed around 45 years and it then fell progressively for the higher ages. This evolution suggests an active process relating the reduction of DBP to vascular aging. This
aspect differs from that of SBP but occurred similarly in men and women and was independent of
traditional CV risk factors such as hypercholesterolemia, glycaemic status, BMI. Note that in the past,
many studies have shown that the mean value of DBP decreased with age, but not the rate of change per
unit age [8-12]. However, this decrease in the mean value of DBP with age before 55 years of age and was
not observed in the present study because the cohort had only a very small geriatric population at inclusion.
In the present study, the increase in the mean values of SBP and DBP with age was shifted toward
higher values of SBP and DBP when studied by strata of traditional cardiovascular risk factors (such as
higher BMI, diabetes mellitus, and increased cholesterol); the relations however remained parallel. In
contrast, the relationship of the SBP or DBP slope with age was influenced exclusively by the presence of
high BP, and not by any of the other cardiovascular risk factors. This finding might indicate that the
presence of structural changes of arterioles and capillary rarefaction contributes consistently to maintain
the elevated values of blood pressure in this population [16]. Further studies are needed to show which
factors are responsible for the specific defect in the well-established process of DBP reduction with age.
Perspectives
This investigation has shown that, in a long-term follow-up, whereas for SBP the rate of change of the
years. The finding is independent of gender and metabolic disorders but disappears in the presence of
hypertension at inclusion, particularly in men. Whether this particularity is influenced by drug treatment is
Acknowledgements
The D.E.S.I.R. Study Group: INSERM-U780: B.Balkau, P.Ducimetière, E.Eschwège; INSERM-U367: F.Alhenc-Gelas;
CHU-D'ANGERS: Y.Gallois, A.Girault; HOPITAL-BICHAT: F.Fumeron, M.Marre; CENTRES D'EXAMENS DE SANTÉ: Alençon, Angers, Blois, Caen, Chartres, Chateauroux, Cholet, Le Mans, Orléans, Tours; INSTITUT DE RECHERCHE EN MÉDECINE GÉNÉRALE: J.Cogneau; MEDECINS GÉNERALISTES des Départements; INSTITUT INTER-RÉGIONAL POUR LA SANTÉ: C.Born, E.Cacès, M.Cailleau, JG.Moreau, F.Rakotozafy, J.Tichet, S.Vol.
Sources of Funding
INSERM, CNAMTS, Lilly, Novartis Pharma, Sanofi-Aventis, Association Diabète Risque Vasculaire, Fédération Française de Cardiologie,La Fondation de France, ALFEDIAM, ONIVINS, Ardix Medical, Bayer Diagnostics, Becton Dickinson,
Cardionics, Merck Santé, Novo Nordisk, Pierre Fabre, Roche, Topcon.
Disclosures
References
1 Hansson L. Are these benefits from any antihypertensive agent additional to blood pressure lowering
per se? In: Birkenhäger H, Robertson JI, Zancheti A, ed. Handbook of Hypertension. Amsterdam:
Elsevier, 2004, pp 526-540.
2 Staessen JA, Li Y, Thijs L, Wang JG. Changing concepts on the role of blood pressure reduction in
cardiovascular prevention. In: Birkenhäger WH, Reid JL ed. Handbook of Hypertension, Vol.23
Arterial Stiffness in Hypertension, Safar ME, O’Rourke MF. Edinburgh: Elsevier, 2006, pp 485-502.
3 Blacher J, Evans A, Arveiller D, Amouyel P, Ferrieres J, Bingham A, Yarnell J, Haas B, Montaye M,
Ruidavets JB, Ducimetiere P. Residual coronary risk in men aged 50-59 years treated for hypertension
and hyperlipidaemia in the population: the PRIME study. J Hypertens 2004; 22:415-423.
4 Black HR, Yi J-Y. A new classification schema for hypertension based on relative and absolute risk
with implications for treatment and reimbursement. Hypertension 1996; 28:719-724.
5 Safar ME, Blacher J, Protogerou A, Achimastos A. Arterial stiffness and central hemodynamics in
treated hypertensive subjects according to brachial blood pressure classification. J Hypertens 2008;
26:130-137.
6 Vergnaud AC, Protogerou AD, Blacher J, Safar ME. From ‘optimal’ to ‘borderline’ blood pressure in
subjects under chronic antihypertensive therapy. J Hypertens 2008; 26:138-144.
7 Balkau B, Vernay M, Mhamdi L, Novak M, Arondel D, Vol S, Tichet J, Eschwege E, The D.E.S.I.R.
Study Group. The incidence and persistence of the NCEP (National Cholesterol Education Program)
metabolic syndrome. The French D.E.S.I.R. study. Diabetes Metab 2003; 29:526-532.
8 Kannel WB, Gordon T, Schwartz MJ. Systolic versus diastolic blood pressure and risk of coronary
heart disease: The Framingham Study. Am J Cardiol 1971; 27:335-346.
9 Kannel WB. Blood pressure as a cardiovascular risk factor: Prevention and treatment. JAMA 1996;
275:1571-1576.
10 Stamler J, Neaton JD, Wentworth DN. Blood pressure (systolic and diastolic) and risk of fatal coronary
11 Franklin SS, Gustin IV W, Wong ND, Larson MG, Weber MA, Kannel WB, Levy D. Hemodynamic
patterns of age-related changes in blood pressure. Circulation 1997; 96:308-315.
12 Safar ME, Smulyan H. Systolic versus diastolic blood pressure: In Handbook of Hypertension Bulpitt
CJ ed. Elsevier Science BV 2000, Amsterdam, pp 73-85.
13 O’Brien E, Mee F, Atkins N, Thomas M. Evaluation of three devices for self-measurement of blood
pressure according to the revised British Hypertension Society Protocol: the Omron HEM-705CP,
Philips HP5332, and Nissei DS-175. Blood Pressure Monitoring 1996; 1:55-81.
14 Executive Summary of the Third Report of the National Cholesterol Education Program (NCEP)
Expert Panel on Detection, Evaluation, and Treatment of High Blood Cholesterol in Adults (Adult
Treatment Panel III). JAMA 2001; 285:2486-2497.
15 Bobrie G, Chatellier G, Genes N, Clerson P, Vaur L, Vaisse B, Menard J, Maillion JM. Cardiovascular
prognosis of "masked hypertension" detected by blood pressure self-measurement in elderly treated
hypertensive patients. JAMA 2004; 29:1342-1349.
16 Izzard AZ, Rizzoni D, Agabiti-Rosei E, Heagerty AM. Small artery structure and hypertension:
Figure legends
Fig. 1A. Mean values of systolic blood pressure (SBP) mmHg by age (5 years), and sex: points
indicate observed mean SBP by age class and the lines are the best-fit regressions; both the slope and the intercept differ significantly (P < 0.0001) between men and women.
Fig. 1B. Mean values of diastolic blood pressure (DBP) mmHg by age (5 years), and sex: points
indicate observed mean DBP by age class with the lines are the best-fit regressions; both the slope and the intercept differ significantly (P < 0.006, 0.001 respectively) between men and women.
Fig. 2A. Mean values of systolic blood pressure (SBP) mmHg by age and sex, according to strata of
blood pressure at inclusion. The slope and the intercept differ significantly between the strata for both men and women.
Fig. 2B. Mean values of diastolic blood pressure (DBP) mmHg by age and sex. Only the intercepts
differ significantly between the strata, for both men and women.
Fig. 3A. Mean change per year (∆SBP) mmHg by age (5 years), and sex: points indicate observed
mean changes per year by age class with the lines as the best-fit regressions; intercepts differed significantly (P = 0.0001) but identical curvature.
Fig. 3B. Mean change per year (∆DBP) mmHg by age (5 years), and sex: points indicate observed
mean changes per year by age class with the lines as the best-fit regressions; relations are identical for men and women.
Table 1. Characteristics [mean, (standard deviation) or n (%)] of the men and women at inclusion in
the study, and the evolution of the parameters per year, assuming a linear increase.
Variables Men (n=2,278) Women (n=2,314) P-value
Baseline levels: Age (years) 47.1 (10.0) 47.1 (10.0) 0.8 BMI (kg/m2) 25.4 (3.3) 24.0 (4.0) <0.0001 Weight (kg) 75.8 (10.7) 61.1 (10.3) <0.0001 Height (cm) 172.6 (6.5) 159.6 (6.0) <0.0001 Waist circumference (cm) 89.7 (9.4) 77.1 (10.2) <0.0001
Systolic blood pressure (mmHg) 134.5 (14.8) 127.8 (15.6) <0.0001 Diastolic blood pressure (mmHg) 82.1 (9.5) 77.6 (9.0) <0.0001
Treated for hypertension 234 (10%) 275 (12%) 0.08
Beta blockers 94 (40%) 140 (51%) 0.01 ACE 102 (44%) 69 (25%) <0.0001 Diuretics 65 (28%) 96 (35%) 0.08 Calcium channel blockers 63 (27%) 43 (16%) 0.002
Heart rate (beats per min) 66.4 (10.3) 68.2 (9.5) <0.0001
Fasting glucose (mmol/l) 5.57 (0.86) 5.13 (0.76) <0.0001
Cholesterol (mmol/l) 5.85 (1.01) 5.62 (0.97) <0.0001
HDL-cholesterol (mmol/l) 1.48 (0.38) 1.78 (0.42) <0.0001
Triglycerides (mmol/l) 1.37 (1.35) 0.97 (0.54) <0.0001
Smoking (n, %) 616 (27%) 335 (14%) <0.0001
Alcohol intake (g/day) 25.2 (24.8) 7.3 (11.4) <0.0001
Postmenopausal (n,%) 878 (40%)
Hormonal replacement therapy (n,%) 853 (38%)
Change per year in:
BMI (kg/m2) 0.11 (0.28) 0.15 (0.32) <0.0001
Weight (kg) 0.27 (0.82) 0.32 (0.77) 0.06
Waist circumference (cm) 0.32 (0.93) 0.45 (0.99) <0.0001
Systolic blood pressure (mmHg) 0.94 (2.49) 0.53 (2.28) <0.0001 Diastolic blood pressure (mmHg) 0.27 (1.59) 0.19 (1.43) 0.09
Heart rate (beats per min) -0.22 (1.63) -0.18 (1.57) 0.3
Fasting glucose (mmol/l) 0.001 (0.13) -0.002 (0.10) 0.4
Cholesterol (mmol/l) -0.02 (0.14) 0.01 (0.13) <0.0001
HDL-cholesterol (mmol/l) -0.01 (0.04) -0.01 (0.05) 0.0002
Triglycerides (mmol/l) -0.001 (0.25) 0.01 (0.08) 0.03
TABLE 2. Equations for mean systolic and diastolic blood pressure (mmHg), according to age for men and women, by strata of cardio-metabolic risk factors. Abbreviations: see text.
SBP DBP
men women men women
General relation 114 + 0.42 age 96 + 0.66 age 65 + 0.53 age - 0.0033 age2 57 + 0.60 age - 0.0033 age2
BMI < 25 kg/m² 115 + 0.36 age 97 + 0.60 age 72 + 0.17 age 56 + 0.63 age -0.0040 age2
≥ 25 kg/m² 120 + 0.36 age* 103 + 0.60 age* 75 + 0.17 age* 59 + 0.63 age -0.0040 age2* Blood pressure SBP and DBP < 130/85 mmHg 117 + 0.051 age 109 + 0.17 age 69 + 0.12 age 58 + 0.58 age - 0.0052 age2
SBP or DBP ≥ 130/85 mmHg 126 + 0.31 age** 122 + 0.35 age** 80 + 0.12 age* 68 + 0.58 age - 0.0052 age2*
Smoking non-smoker 114 + 0.42 age 96 + 0.67 age 72 + 0.21 age 57 + 0.61 age - 0.0036 age2
current 114 + 0.42 age 96 + 0.67 age 72 + 0.21 age 56 + 0.61 age - 0.0036 age2*
Cholesterol ≤ 5.7 mmol/l 114 + 0.40 age 97 + 0.64 age 72 + 0.20 age 56 + 0.64 age - 0.0039 age2
> 5.7 mmol/l 117 + 0.40 age* 99 + 0.64 age* 74 + 0.20 age* 57 + 0.64 age - 0.0039 age2*
Glucose status normal 116 + 0.38 age 97 + 0.65 age 73 + 0.18 age 56 + 0.65 age - 0.0040 age2
impaired fasting glucose 120 + 0.38 age 101 + 0.65 age 76 + 0.18 age 59 + 0.65 age - 0.0040 age2
diabetic 126 + 0.38 age* 101 + 0.65 age* 79 + 0.18 age* 59 + 0.65 age - 0.0040 age2*
non-treated 117 + 0.34 age 99 + 0.59 age 73 + 0.18 age 55 + 0.70 age - 0.0047 age2
Anti-hypertensive
treatment treated 127 + 0.34 age* 108 + 0.59 age* 87 + 0.010 age* 59 + 0.70 age - 0.0047 age
2
*
premenopausal 93 + 0.75 age 56 + 0.66 age - 0.0040 age2
Menopausal
status postmenopausal 91 + 0.75 age 56 + 0.66 age - 0.0040 age2
non treated 93 + 0.73 age 52 + 0.76 age - 0.0046 age2
Hormonal replacement therapy
treated 101 + 0.58 age** 57 + 0.65 age - 0.0046 age2**
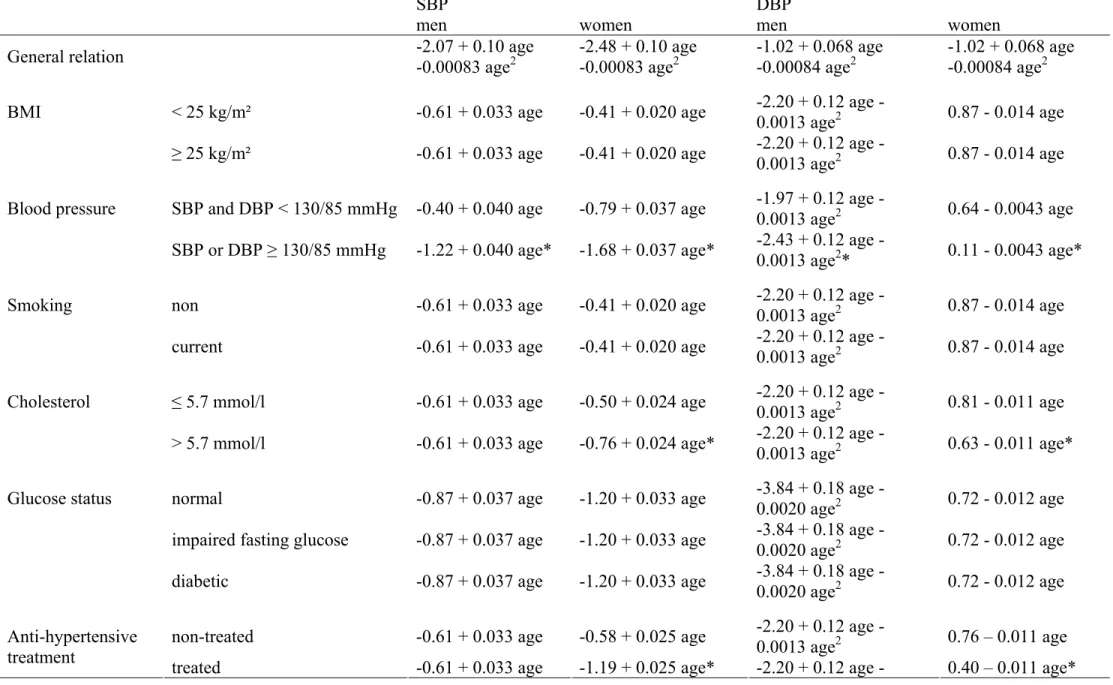
TABLE 3. Equations for rates of change of systolic (∆SBP) and diastolic (∆DBP) blood pressure (mmHg), according to age for men and women, by strata of metabolic risk factors. Abbreviations: see text.
SBP DBP
men women men women
General relation -2.07 + 0.10 age
-0.00083 age2 -2.48 + 0.10 age -0.00083 age2 -1.02 + 0.068 age -0.00084 age2 -1.02 + 0.068 age -0.00084 age2
BMI < 25 kg/m² -0.61 + 0.033 age -0.41 + 0.020 age 2.20 + 0.12 age
-0.0013 age2 0.87 - 0.014 age ≥ 25 kg/m² -0.61 + 0.033 age -0.41 + 0.020 age 2.20 + 0.12 age
-0.0013 age2 0.87 - 0.014 age
Blood pressure SBP and DBP < 130/85 mmHg -0.40 + 0.040 age -0.79 + 0.037 age 1.97 + 0.12 age
-0.0013 age2 0.64 - 0.0043 age SBP or DBP ≥ 130/85 mmHg -1.22 + 0.040 age* -1.68 + 0.037 age* 2.43 + 0.12 age
-0.0013 age2* 0.11 - 0.0043 age*
Smoking non -0.61 + 0.033 age -0.41 + 0.020 age 2.20 + 0.12 age
-0.0013 age2 0.87 - 0.014 age
current -0.61 + 0.033 age -0.41 + 0.020 age 2.20 + 0.12 age
-0.0013 age2 0.87 - 0.014 age
Cholesterol ≤ 5.7 mmol/l -0.61 + 0.033 age -0.50 + 0.024 age 2.20 + 0.12 age
-0.0013 age2 0.81 - 0.011 age > 5.7 mmol/l -0.61 + 0.033 age -0.76 + 0.024 age* 2.20 + 0.12 age
-0.0013 age2 0.63 - 0.011 age*
Glucose status normal -0.87 + 0.037 age -1.20 + 0.033 age -3.84 + 0.18 age -
0.0020 age2 0.72 - 0.012 age impaired fasting glucose -0.87 + 0.037 age -1.20 + 0.033 age -3.84 + 0.18 age -
0.0020 age2 0.72 - 0.012 age
diabetic -0.87 + 0.037 age -1.20 + 0.033 age -3.84 + 0.18 age -
0.0020 age2 0.72 - 0.012 age
non-treated -0.61 + 0.033 age -0.58 + 0.025 age 2.20 + 0.12 age
-0.0013 age2 0.76 – 0.011 age Anti-hypertensive
treatment
0.0013 age2
Menopausal status premenopausal -0.41 + 0.020 age 0.87 - 0.014 age
postmenopausal -0.41 + 0.020 age 0.87 - 0.014 age
non treated -0.41 + 0.020 age 0.87 - 0.014 age
Hormonal
replacement therapy treated -0.41 + 0.020 age 0.87 - 0.014 age
115
120
125
130
135
140
145
30-34
35-39
40-44
45-49
50-54
55-59
60-65
Age at inclusion (years)
Mean
systolic b
lood
pressure (mm
H
g) at inclusio
n
men : SBP=114 + 0.42age women : SBP= 96 + 0.66ageFigure 1B
70
75
80
85
90
30-34
35-39
40-44
45-49
50-54
55-59
60-65
Age at inclusion (years)
Mean diastolic bloo
d pressu
re (m
mHg
) at in
clusion
men : DBP=65 + 0.53 age – 0.0033 age² women : DBP=57 + 0.60 age - 0.0033 age²
Figure 2A
110
115
120
125
130
135
140
145
150
155
30-34
35-39
40-44
45-49
50-54
55-59
60-65
Age at inclusion (years)
Mean systolic blood pressu
re (mm
H
g) at inclu
s
ion
men without HTA : SBP=117 + 0.051age men with HTA : SBP=126 + 0.31age women without HTA : SBP=109 + 0.17age women with HTA : SBP=122 + 0.36age
Figure 2B
70
75
80
85
90
95
30-34
35-39
40-44
45-49
50-54
55-59
60-65
Age at inclusion (years)
Mean diasto
lic blood p
ressu
re (mmHg) at inclusion
men without HTA : DBP=69 + 0.12age men with HTA : DBP=80 + 0.12age
women without HTA : DBP=58 + 0.58age - 0.0052age2 women with HTA : DBP=68 + 0.58age - 0.0052age2
Figure 3A
0
0.5
1
1.5
2
30-34
35-39
40-44
45-49
50-54
55-59
60-65
Age at inclusion (years)
∆
SBP (mmHg) per year
men : ∆ SBP=-2.07 + 0.10 age – 0.00083 age2
Figure 3B
-0.4
-0.2
0
0.2
0.4
0.6
0.8
Age at inclusion (years)
∆
DBP (mmHg) per year
men : ∆ DBP=-1.02 + 0.07 age – 0.00084 age2 women : ∆ DBP= =-1.02 + 0.07 age – 0.00084 age2
![Table 1. Characteristics [mean, (standard deviation) or n (%)] of the men and women at inclusion in the study, and the evolution of the parameters per year, assuming a linear increase](https://thumb-eu.123doks.com/thumbv2/123doknet/15011569.679189/18.892.71.782.179.1066/characteristics-standard-deviation-inclusion-evolution-parameters-assuming-increase.webp)