On the morphological characteristics of
overdeepenings in high-mountain glacier beds
Wilfried Haeberli,1* Andreas Linsbauer,1,2Alejo Cochachin,3Cesar Salazar3and Urs H. Fischer4
1Geography Department, University of Zurich, Zurich, Switzerland 2Department of Geosciences, University of Fribourg, Fribourg, Switzerland 3Glaciology and Water Resources Unit, Huaraz, Peru
4National Cooperative for the Disposal of Radioactive Waste, Nagra, Wettingen, Switzerland
*Correspondence to: Wilfried Haeberli, Geography Department, University of Zurich, Winterthurerstrasse 190. 8057 Zurich, Switzerland. E-mail: [email protected]
ABSTRACT: Overdeepenings, i.e. closed topographic depressions with adverse slopes in the direction of flow, are characteristic for glacier beds and glacially sculpted landscapes. Quantitative information about their morphological characteristics, however, has so far hardly been available. The present study provides such information by combining the analysis of (a) numerous bed overdeepenings below still existing glaciers of the Swiss Alps and the Himalaya-Karakoram region modelled with a robust shear stress approximation and (b) detailed bathymetries from recently exposed lakes in the Peruvian Andes. The investigated overdeepenings exist where glacier surface slopes are low (< 5°–10°), occur in bedrock or morainic material and are most com-monly a fraction of a kilometre squared in surface area, hundreds of metres long, about half the length in width and tens of metres deep. They form under conditions of low to high basal shear stresses, at cirque, confluence, trunk valley and terminus positions. The most striking phenomenon, however, is the high variability of their geometries: Depths, surface areas, lengths and widths of the overdeepenings vary over orders of magnitude and are only weakly– if at all – interrelated. Inclinations of adverse slopes do not dif-fer significantly from those of forward slopes and are in many cases higher than so far assumed theoretical limits for supercooling of ascending water and corresponding closure of sub-glacial channels. Such steep adverse slopes are a robust observation and in sup-port of recently developed new concepts concerning the question about where supercooling of sub-glacial water and closure of ice channels can or must occur. However, the question of when and under what climatic, topographic and ice conditions the overdeepenings had formed remains unanswered. This open question constitutes a key problem concerning the interpretation of ob-served overdeepenings, the understanding of the involved glacio-hydraulic processes and the possibility of realistic predictive modelling of overdeepening formation. Copyright © 2016 John Wiley & Sons, Ltd.
KEYWORDS: high mountains; glacier beds; glacier erosion; overdeepenings; glacial lakes
Introduction
Overdeepenings or closed basins in glacier beds are common features in glaciated landscapes (Cook and Swift, 2012; Swift et al., 2014). Models by Hooke (1991) and Alley et al. (2003) predict them to be equilibrium forms that all glacier beds tend towards. This study provides the first systematic quantification of overdeepening morphometry for glaciated high-mountain environments.
While areal denudation by glaciers is primarily associated with abrasion by debris-laden ice and quarrying/plucking of rock at the ice base, local maxima of depth erosion and the for-mation of overdeepenings may more strongly be linked to the complex system of sub-glacial meltwater drainage, which can in places be linearly concentrated (Creyts et al., 2013; Beaud et al., 2016). Water flow in pressurized sub-glacial drainage systems at warm-based parts of glaciers not only affects basal sliding and the efficiency of direct glacier-bed erosion but likely also plays a predominant role in evacuating sediments produced by erosion and, hence, keeps eroded bed surfaces
accessible for further erosion. The coupling of sub-glacial hydraulics and erosion to models of glacier flow has so far only been attempted in a few studies (e.g. Herman et al., 2011; Egholm et al., 2012; Creyts et al., 2013; Beaud et al., 2016) but remains an important research challenge for the future. An important aspect thereby relates to the topographic and gla-ciological characteristics, which may be typical for sites where glacial overdeepenings occur (cf. Frey et al., 2010). What factors or factor combinations with their changes along the direction of flow are related to the occurrence of glacial overdeepenings: surface slope, ice thickness, driving stress, flow velocity, sub-glacial discharge, basal thermal conditions (temperate, cold, polythermal), water pressure, effective normal pressure, debris content, bed characteristics (sediment, rock)? Can empirical ‘rules’ be found for understanding and predicting the formation and evolution of overdeepenings in glacial systems, past and future?
A need for quantitative morphological data of over-deepenings also exists in connection with safety aspects concerning flood hazards from outbursts of lakes developing
http://doc.rero.ch
Published in "Earth Surface Processes and Landforms 41(13): 1980–1990, 2016"
which should be cited to refer to this work.
within de-glaciating overdeepenings or related to the possibil-ity of deep glacial erosion excavating repositories for radioac-tive waste during future glacials (Fischer et al., 2014; Haeberli et al., 2016; see Supporting Information S1). This quantitative information, however, is not easily accessible. In currently glacier-covered regions, bed-overdeepenings are not directly visible and in formerly glacier-covered regions they are often filled with sediments and must be explored using labour- and cost-intensive methodologies (drillings, geophysical sound-ings). Two developments recently ameliorated the situation: the availability of high-resolution digital terrain information and the exposure of glacier beds as a consequence of the rapid glacier retreat.
High-resolution digital terrain information enables the modelling of realistic and detailed bed topographies for existing glaciers across entire mountain chains (Farinotti et al., 2009; Linsbauer et al., 2009, 2012; Huss and Farinotti, 2012; Clarke et al., 2013) and provides corresponding data about bed-overdeepenings and potential future lakes (see also Patton et al., 2015; Supporting Information S2). For the Swiss Alps, for instance, several hundred overdeepenings were modelled in the beds of currently existing glaciers (Linsbauer et al., 2012) and comparable information is now available for thousands of glaciers in the Himalaya-Karakoram region (Linsbauer et al., 2016). For the first time, this opens up opportunities to analyse a large statistical sample with respect to morphological characteristics of bed-overdeepenings. The plausibility of the corresponding database can be assessed but the data remain a modelling product that depends on model assumptions including the applied basal shear stresses and the smoothing function to account for effects of longitudinal stress coupling in glaciers (cf. Adhikari and Marshall, 2013).
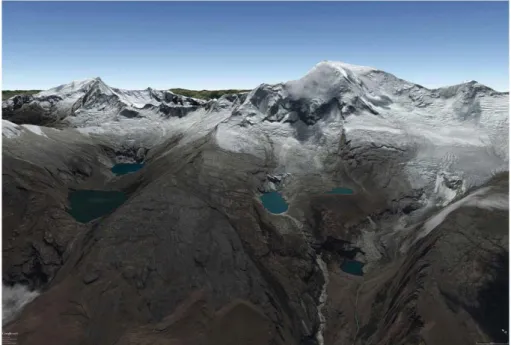
The rapid retreat of glaciers leads to the formation of numer-ous new pro-glacial lakes in high mountain regions. Bathyme-tries of new lakes that became recently exposed as a consequence of de-glaciation and that are still weakly affected by sedimentation processes constitute directly measured model-independent information about morphological charac-teristics of bed overdeepenings (Figure 1). In connection with safety questions, numerous and detailed lake bathymetries
have been measured in the Cordillera Blanca of Peru. Such measured bathymetries are much less numerous than the modelled data but provide an important independent check of the latter.
The present study attempts to analyse quantitative data about the morphological characteristics of glacial overdeepenings by using high-resolution glacier-bed models and measured bathymetries of newly formed lakes. The question is investi-gated whether such data may have the potential to be used for calibrating numerical models of glacial erosion (Herman et al., 2011; Egholm et al., 2012) and for testing hypotheses of stabilizing feedbacks associated with the erosion of glacial overdeepenings (Alley et al., 2003; Hooke, 1991; Werder, 2016).
Three main steps were followed:
1. Development of a strategy and geographic information sys-tem (GIS)-based automated procedure for extracting mor-phometric data on the basis of modelled overdeepenings in the Swiss Alps.
2. Inclusion of morphometric information from modelled overdeepenings in the Himalaya-Karakoram region and from measured lake bathymetries in the Cordillera Blanca, Peru.
3. Expert judgements about general morphological character-istics and statistical analysis of morphometric data concerning the investigated overdeepenings.
Study Sites and Methods
Swiss alps
Ice thickness and bed topography of the glaciers in the Swiss Alps were calculated with GlabTop (Linsbauer et al., 2009, 2012) which only requires three data sets as input: a digital elevation model (DEM), glacier outlines and a set of manually digitized glacier branch lines. The DEM used is the DHM25 (Swisstopo, 2005); two versions are available – level 1 from around 1985 and level 2 from around 1995. The glacier
Figure 1. Newly formed lakes in bed overdeepenings of formerly glacier-covered bedrock at the foot of Nevado Hualcán, Cordillera Blanca, Peru. Laguna 513, the lake in the centre of the image, has a maximum depth exceeding 100 m (cf. Figures 4 and 9) as measured in connection with hazard assessments (cf. the rock/ice avalanche causing impact waves and corresponding floods/debris flows down to the main valley at Carhuaz; Carey et al., 2012). Google Earth view, image date 20 August 2013. This figure is available in colour online at wileyonlinelibrary.com/journal/espl
outlines are from the Swiss Glacier Inventory 1973 (Müller et al., 1976, Maisch et al., 2000) which covers a glacier area of about 1304 km2and from the Swiss Glacier Inventory 2000 (Paul, 2007) which covers a glacier area of about 1040 km2
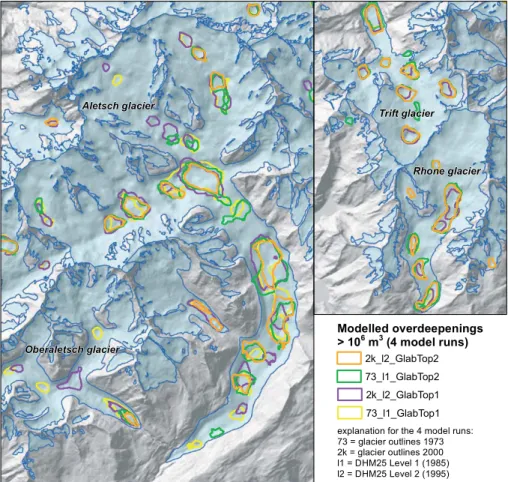
and includes an estimated ice volume of 68 ± 20 km3. Detailed comparison with ice depths obtained from field measurements (mainly radio-echo soundings) shows that the uncertainty range of absolute depth values calculated by GlabTop is about ±30% (Linsbauer et al., 2012). The data sample concerning bed topographies comprises results from four different model runs using variations in input data and interpolation methods, each with more than 500 modelled overdeepenings. These modelled overdeepenings have a total area of about 50 to 60 km2, a total volume of about 1.5 to 2.5 km3 (about 3% of the existing glacier volume) and can be seen as sites of potential future lake formation when becoming exposed as a consequence of glacier retreat. While the modelled overdeepenings based on the four different model runs differ in exact shape, their locations are mostly robust and the values for the extracted parameters are comparable (cf. Figure 2).
Himalaya-Karakoram region
The estimate of glacier coverage for the Himalaya-Karakoram region is about 40 800 km2resulting in a total ice volume of 2955 to 3360 km3. To model the ice thickness distribution for the very large region, the fully automated GlabTop2 was developed (Frey et al., 2014), which requires only a DEM and glacier outlines as input. GlabTop2 is based on the same concept as GlabTop (Linsbauer et al., 2009, 2012; Paul and Linsbauer, 2012), but involves two major changes from the original approach: branch lines become obsolete, and surface slope is not derived along lines but as the average surface
slope of all grid cells within a certain distance. This avoids the laborious process of manually drawing branch lines and allows for applying the model to the immense glacier sample of the entire Himalaya-Karakoram region. By sub-tracting the modelled ice thickness distribution from the input surface DEM, the overdeepenings in the Himalaya-Karakoram mountain range are extracted (Figure 3). The limited quality (filled data voids) and the coarse resolution (about 90 m) of the surface DEM [SRTM (Shuttle Radar Topography Mission); Jarvis et al., 2008] causes the calculation of bed overdeepenings to be correspondingly more uncertain for the Himalaya-Karakoram region than for the Swiss Alps where the DHM25 with a 25 m grid was used. Furthermore, the geo-referencing of glacier outlines in the Randolph glacier inventory (Pfeffer et al., 2014) remains problematic in some areas.
For the Himalaya-Karakoram region about 16 000 modelled overdeepenings larger than 104m2 were detected in the
modelled glacier-bed topography (Linsbauer et al., 2016), cov-ering an area of about 2200 km2and having a total volume of
about 120 km3(3–4% of the currently existing glacier volume). About 5000 of these overdeepenings (1800 km2) have a
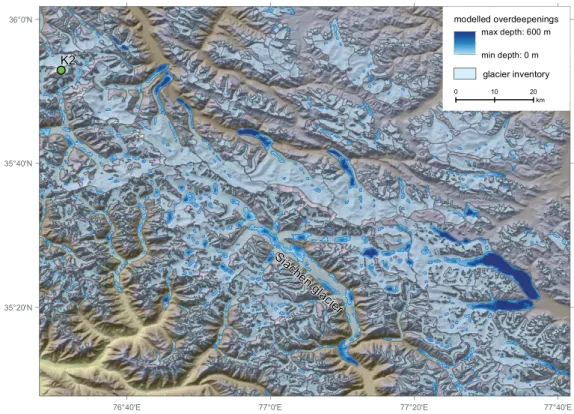
vol-ume larger than 106m3. The largest calculated bed depression (cf. Figure 3) covers an area of more than 50 km2and has a
volume of about 11 km3.
Peruvian andes
In connection with questions of lake hazards, detailed bathym-etries have been measured since the 1960s in lakes exposed by ongoing glacier retreat in the Cordillera Blanca by the Glaciol-ogy and Water Resources Unit, ANA, Huaraz, and its predeces-sor organizations. In the earlier years probes and later a graphic
Figure 2. Map showing modelled overdeepenings with volumes larger than 106m3based on four different model runs for Aletsch/Oberaletsch (left) and Trift/Rhone glaciers (right). This figure is available in colour online at wileyonlinelibrary.com/journal/espl
echo sounder were used in combination with geo-referencing by theodolite triangulation. Since the year 2000 measurements (Figure 4) were carried out with a Zodiac rubber boat and a dig-ital echo sounder (GARMIN GPS MAP 188C SOUND). With long- and cross-profiles arranged at a distance of ±20 m, a dense network of measured points was obtained. Even closer spacing was chosen at sites where sharp irregularities in the lake-bottom topography were observed. Topographic surveys using a total station (TOPCON GPT 7005 L) were made to de-fine the lake perimeters, the surrounding surface topography and interesting points like river entrances and lake outlets. Data analysis was achieved with MAPSOURCE of the global posi-tioning system (GPS) map applying a value of 1400 m s 1to the propagation speed of the ultrasonic pulse in freshwater. The data sample comprises 92 lakes, covering an area of about 24 km2 and resulting in a volume of 0.6 km3. Most lakes in this sample are moraine-dammed and only 15 are bedrock overdeepenings. Emphasis here is on the bedrock overdeep-enings (cf. Figures 1, 4, and later Figure 6).
Parameters
Qualitative/quantitative information is available from (a) gen-eral model assumptions (average basal shear stress) or expert judgements (for instance, rock/moraine glacier bed, topological situation with respect to glacier flow, morphological indica-tions) and from (b) numerical values of morphometric parame-ters for a very large number of modelled bed overdeepenings in the Swiss Alps and the Himalaya-Karakoram region and for a few measured lake bathymetries in the Cordillera Blanca, Peru. Of primary interest for a statistical analysis of the morphometric characteristics of overdeepenings are area, maximum and mean depth, volume, length (longest line and orientation), maximum width (perpendicular to the longest line) and mean width, elongation (width-to-length ratio to obtain convenient numbers between zero and one), length and orientation with respect to the ice flow direction, maximum and mean
inclination of adverse and normal slopes. Average basal shear stress of the glaciers, basal ice temperature, topological classification with respect to glacier flow (cirque, confluence, diffluence, trunk valley, terminus) and substrate/dam material represent important complementary information. The technical procedures used for the determination and GIS-extraction of these parameters are described in the Supporting Information S3.
Results
Information estimated using general model assumptions and expert judgements is first summarized. This information pro-vides an impression of the general geomorphological and glaciological characteristics involved. The morphometry of the investigated overdeepenings is then quantified in a sec-ond step using statistics (histograms, correlations). This is the basis for discussing possibilities and limitations of quanti-tative predictions in comparison with existing theories where available.
Parameters estimated using general model
assumptions and expert judgements
Values for the average basal shear stress as a function of eleva-tion range (governing mass turn-over) result from the basic model assumption in the GlabTop approach. Information about the bed characteristics (rock/moraine), topological situations with respect to glacier flow and morphological indications for sites with overdeepenings are based on expert judgements or independent model calculations and require some additional commentary. One key uncertainty thereby relates to the un-known time of overdeepening formation and the corresponding glacier characteristics (in particular geometry and thermal aspects).
Figure 3. Bed overdeepenings modelled with GlabTop2 for the glaciers between K2 and the Karakoram-Pass in the Karakoram Range, including the largest modelled depression (lower right of image). This figure is available in colour online at wileyonlinelibrary.com/journal/espl
Average basal shear stress
GlabTop estimates an average basal shear stress for every gla-cier as a function of its elevation range (cf. Haeberli and Hoelzle, 1995). Aletsch glacier, for instance, with its large overdeepenings at Konkordiaplatz and other locations receives the maximum possible value of 150 kPa (1.5 bar) while smaller glaciers like the cirque glacier at Chüebodenhorn (Figure 5) have lower values of a few tens of kilopascals. If the
overdeepenings in such cirque situations had formed during time periods with larger glaciers (glacial maxima, for instance) the attributed shear stress could have been larger. In the case of Chüebodenhorn, however, ice flux in such situations would have been to both sides of the ridge and, hence, small shear stress values even close to zero remain plausible. This under-pins the impression that marked overdeepenings can form where basal shear stresses are small or large.
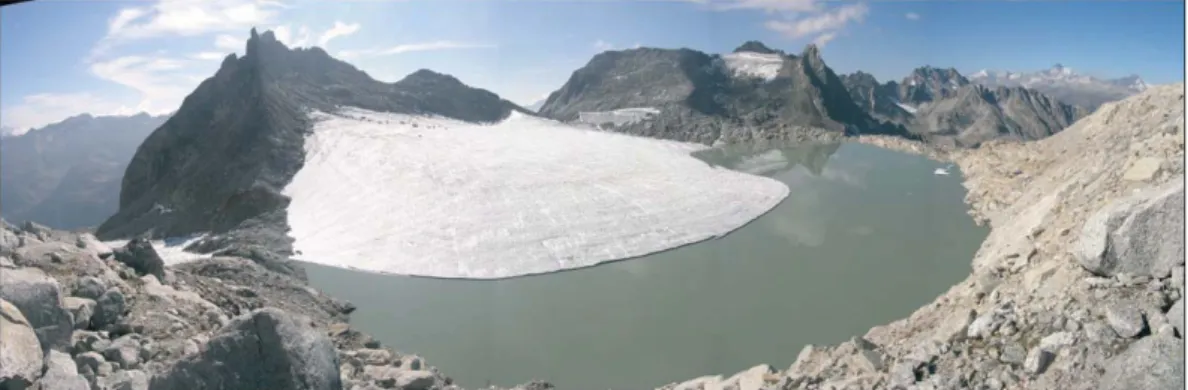
Figure 4. Measured bathymetry of the Laguna 513 above Carhuaz, Cordillera Blanca of Peru. This lake formed after 1980 in a bedrock overdeepening (cf. Figures 1 and 9) as a consequence of glacier retreat. For safety reasons, the lake level had been artificially lowered by about 20 m in the early 1990s through construction of tunnels (left-hand side of the long profile across the lake). Note that the local maximum adverse slope of the lake bottom is much steeper than the average between the deepest point of the lake and the lake outlet (at left). This figure is available in colour online at wileyonlinelibrary.com/journal/espl
Figure 5. Overdeepening at the cirque of Chüehbodenhorn (Gotthard region, central Swiss Alps) with a new and expanding lake. Maximum depth of the lake is 30 m, width about 170 m. Photograph: Y. Schaub 2012. This figure is available in colour online at wileyonlinelibrary.com/journal/espl
Rock and sediment beds
For the glaciers of the Swiss Alps, bed characteristics were esti-mated based on an erosion/sedimentation-index (Zemp et al., 2005; see Supporting Information S4). Most glaciers have mixed beds with combinations of sedimentary and rocky parts. Large glaciers tend to have more rock components, because their abundant meltwater can evacuate debris more easily. The largest overdeepenings are found in the beds of the largest valley glaciers (Aletsch, Fiescher, Gorner, Corbassière) and are thus probably cut into rock beds. Where debris-providing rock walls are absent or ice-covered, bedrock overdeepenings can also exist underneath small glaciers (cf. Figure 1). Modelled overdeepenings in the morainic beds of heavily debris-covered glaciers like Unteraar or Zmutt are especially uncertain. In short: overdeepenings can form in rock and sediment beds but the large ones seem to preferably form in rock beds. Topological situation with respect to glacier flow
Thirty-two overdeepenings in the beds of Swiss glaciers, which are among the largest modelled, were analysed concerning their topological situation with respect to ice flow [cf. a similar analysis for the Himalaya-Karakoram region presented by Linsbauer et al. (2016)]. In this Swiss sample, trunk valley situations in sections without confluence/diffluence are most frequent (16 = 50%), followed by confluence situations (10 = 31%), cirque situations (5 = 16%) and undefined (1 = 3%). No marked diffluence situation presently exists in the Swiss Alps. Terminus (end of tongue-) situations were disregarded, because these situations have in many cases been trunk valley situations until most recently. The proportion of cirque situations would become larger if smaller over-deepenings were to be included.
Morphological indications
Frey et al. (2010) used three morphological criteria indicating overdeepenings from surface features of glaciers:
1. down-glacier increase of surface slope;
2. transition from a crevasse-free to a crevassed area; 3. lateral narrowing.
It is interesting to test the 32 analysed overdeepenings with respect to these morphological criteria as defined by the present-day surface conditions (using Google Earth images). All the analysed overdeepenings had a break (steepening) in slope – even though sometimes rather weak – in the down-glacier direction, which can indicate the existence of a riegel in the glacier bed. A transition from crevasse-free compressing flow to extending flow with crevasses can be observed in 27 cases. Lateral narrowing which points to the possible occur-rence of hard bedrock riegels exists in 25 out of the 32 studied cases. All three criteria together are found for 23 cases, six cases fulfil two criteria and three cases satisfy one criterion only. In this sample, the probability for confluence and cirque sites to satisfy three criteria is 80%, while it is only 56% for trunk valley situations. An application of these morphological criteria to old maps (Topographischer Atlas; very close to Little Ice Age maximum glacier extent) in the Swiss Alps documents that lakes had formed with a probability of 75% where all three criteria applied (Rüesch, 2013). The limited quality of the topo-graphic information on the past glacier parts makes further in-terpretation difficult. Overall, these tests show that the overdeepenings modelled with GlabTop are reasonably well documented by indications of surface morphology and obser-vations of lakes, which had already formed in the recent past. Trunk valley, confluence and cirque situations are most typical.
Thermal conditions at glacier beds
Even though a good number of the investigated mountain gla-ciers – especially in the dry parts of the Alps and of the Himalaya-Karakoram – may be polythermal with some cold parts at high elevation or even cold ice margins in contact with peri-glacial permafrost (Haeberli and Hoelzle, 1995; Suter et al., 2001), most of the analysed overdeepenings most proba-bly exist or have formed underneath glaciers with a temperate base and an unfrozen glacier bed. The presence and influence of water is plausible in such cases. The existence of overdeepenings in the bed of cold-based glaciers can, how-ever, not be excluded.
Quantification of overdeepening morphometry
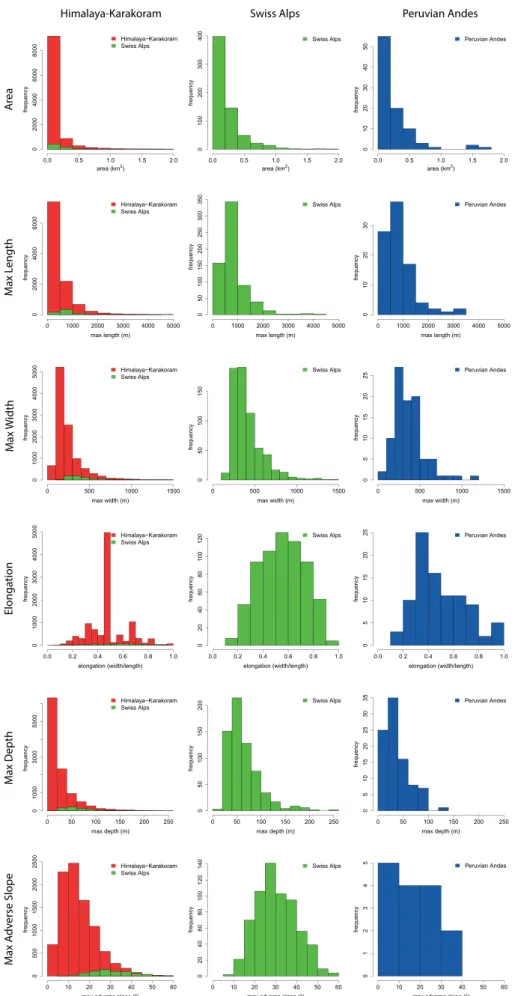
Selected histograms of the automatically extracted parameters concerning the morphology of bed overdeepenings in the Swiss Alps, the Himalaya-Karakoram region and the Peruvian Cordil-lera Blanca are provided in Figure 6. The statistics are influ-enced by the fact that only overdeepenings with sizes >106m3 were included. The emphasis is therefore onmaxi-mum rather than minimaxi-mum values. Modelled overdeepenings in the Swiss Alps are mostly less than 1 km2 in area, a few
kilometres in length and 1 km in width. Elongation appears to have a peak around 0.5 indicating that oval-shaped overdeepenings are most common. Maximum depths of several hundred metres are possible but mean depth rarely exceeds 100 m and volumes commonly remain below a few tens of mil-lions of cubed metres. Mean adverse slopes have a maximum around 10°–20°, which largely exceeds the glacier-surface slope of<5°–10° considered critical for overdeepening forma-tion (cf. Frey et al., 2010) and hence is in many cases above the critical slope ratio (1.6 times the surface slope) for supercooling and channel closure as commonly mentioned in the literature (Hooke, 1991; Alley et al., 2003; Cook and Swift, 2012; Werder, 2016). Maximum adverse slope is most frequently around 25°–30°, which in some cases could be high enough for sub-glacial lake formation (Clarke, 2005; Cook and Swift, 2012). Mean normal slope at the upper end of the overdeepenings shows similar characteristics, however with a tendency to somewhat less inclined geometries. The largest modelled overdeepenings, for instance the one at Konkordiaplatz with an estimated mean/maximum depth of around 100/300 m, an area of around 2.5 km2and a total vol-ume of some 200 million m3, are found at Aletsch glacier, the largest glacier in the Alps.
Length, area and volume of the overdeepenings in Peru and in the Himalaya-Karakoram are generally comparable to the ones in the Swiss Alps but have more extreme volumes in the Himalaya-Karakoram where the largest modelled form (cf. Figure 3) has an area of 56 km2, a maximum length of 18 km,
a maximum width of 3 km, a maximum depth of 400 m and a volume of 11 km3. Maximum and mean depth of the
mea-sured Cordillera lakes appear to be a bit smaller than in the Alps, an effect which may be partly due to sediment infilling. The fact that some levels of Peruvian lakes had been artifi-cially lowered (cf. Figures 1, 4 and 7) should also be taken into account. In such cases, morphometric information relates to the remaining water body. Despite the large size of some involved glaciers, maximum and mean depths for the modelled Himalaya-Karakoram overdeepenings are hardly dif-ferent from the ones in Peru and in the Alps. This somewhat surprising result may be due to the stronger smoothing by the coarser DEM.
Elongation of the lakes in Peru has a peak at 0.3–0.4 rather than 0.5–0.6 as in the modelled overdeepenings. This
difference, if significant, may be due to the mostly simpler ge-ometry of the smaller Cordillera glaciers in comparison with
the larger and more complex Swiss glaciers with many pro-nounced confluences.
Figure 6. Selected histograms of morphological overdeepening parameters for the modelled overdeepenings from the Himalaya-Karakoram and the Swiss Alps and the measured lake bathymetries from the Peruvian Andes. Note that extreme values (mainly for the Himalaya-Karakoram sample) have been cutoff to obtain the same horizontal and thus comparable scale for the three datasets. This figure is available in colour online at wileyonlinelibrary.com/journal/espl
Figure 7. Exposed adverse slope of the Laguna 513 bedrock overdeepening in the Cordillera Blanca (cf. Figures 1 and 4). The level of the lake had been artificially lowered by 20 m with the construction of tunnels in the bedrock threshold for hazard prevention (Carey et al., 2012); the original overflow was about 20 m above the person in the foreground. Note the absence of a deeply incised rock channel in the smoothly polished‘riegel’. Photograph: C. Giraldez 2012. This figure is available in colour online at wileyonlinelibrary.com/journal/espl
Figure 8. Scatter plots of maximum depth as a function of area, length, width and elongation. This figure is available in colour online at wileyonlinelibrary.com/journal/espl
Adverse slopes of the few measured lakes in bedrock-overdeepenings of the Cordillera Blanca have a higher percent-age of low values but include inclinations well above 20°. The case of the adverse slope of Laguna 513 (Figure 7) made visible as a consequence of artificial lake level lowering is quite unique– such adverse slopes of overdeepenings without deep cuts (gorges) cannot usually be seen, because they are under water or under sediments. Again, a great number of modelled overdeepenings in the Himalaya-Karakoram region have ad-verse slopes steeper than 10° with a weak tendency for normal slopes to be slightly less steep.
As a general result the modelled and measured overdeepenings show well-comparable morphological characteristics. This points to the fact that the modelling of overdeepenings in the beds of currently existing glaciers is quite realistic despite uncertainties about smoothing in the models/DEMs and about sediment infill in the freshly exposed lakes. Maximum depth of bed overdeepenings below high mountain glaciers seems to be limited to a few hundred metres.
In a next step, statistical regressions were calculated for all retrieved parameters of the Swiss Alps. The highest correlations are from meaningless self-correlations. An example is the re-gression between volume and area, which relates a mathemat-ical product (volume = area times depth) to one of the factors (area) from which it had been calculated. All plots without self-correlation effects show very large scatter and weak to near-zero correlations (see also Supporting Information S5). The primary conclusion is, therefore, that the variability of mor-phological parameters is extreme.
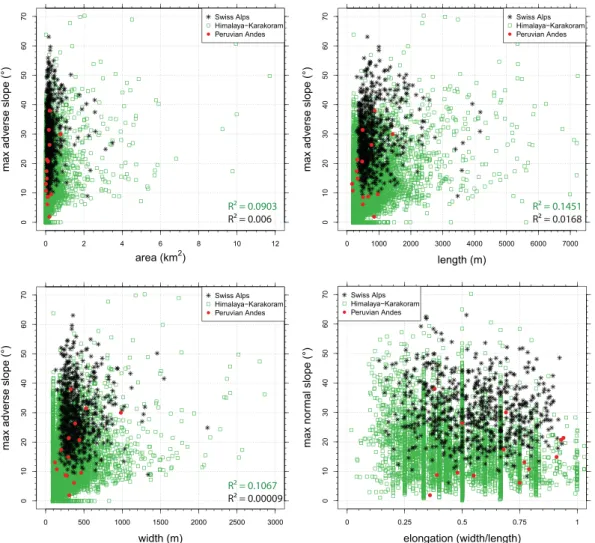
Selected plots of especially relevant parameters (maximum depth and maximum adverse slope as a function of length, area, width and elongation) for all investigated overdeepenings are presented in Figures 8 and 9 (for Peru only bedrock lakes are included). These scatter plots show only vague relation-ships with high scatters.
As a general rule, the larger, longer or wider an over-deepening is the deeper it can be. There is, however, no clear relation. The relation between maximum depth and area ap-pears to be especially weak: overdeepenings with small surface areas can be deep and those with larger surface areas shallow. Somewhat better confined in the sample of modelled overdeepenings in the Swiss Alps and the measured Peruvian bathymetries are upper-bound ratios between maximum depth and length of about 0.2 and between maximum depth and width of about 0.3. The values from modelled overdeepenings in the Himalaya-Karakoram region seem to confirm that such ratios tend to decrease with increasing size but are less reliable because of the coarse DEM resolution. This can be seen as a– still weak– indication of decelerating depth erosion following a rapid initial phase and perhaps even an upper limit of overall erosion depths. Similarly, a still weak indication exists that ero-sion depth can reach a maximum within an optimal elongation range (width/length ratio) of about 0.25 to 0.75. Normal and adverse slopes seem to be rather independent of each other and maximum values of the latter can be much higher than mean values.
For overdeepenings with a mean depth less than 50 m the range of the observed maximum adverse slope ranges from 10° to 60° but narrows down to 25° to 55° with larger mean
Figure 9. Scatter plots of maximum adverse slope as a function of area, length, width and elongation. This figure is available in colour online at wileyonlinelibrary.com/journal/espl
depths for the Swiss and Peruvian samples. Furthermore, the range for deeper overdeepenings is far above the critical slope (1.6 times the glacier surface slope or about 10°–20° in the case of mountain glaciers) so far often assumed for supercooling and channel closure along the adverse slopes of overdeepenings (Alley et al., 2003; Cook and Swift, 2012; but see also Werder, 2016).
Discussion
The need for quantitative information about the morphology of glacial overdeepenings is growing. Special interest relates to the challenge of estimating maximum possible glacial erosion depths during future glacial periods for the case of long-term disposal of radioactive waste. Similarly, overdeepening mor-phometry is important for anticipating hazards from lake out-bursts but also options for use (hydropower, water supply, tourism) in the case of newly forming lakes in presently still glacier-covered areas. Despite the encouraging new possibili-ties from numerical model calculations of glacier-bed topogra-phies and from bathymetric measurements in newly exposed lakes, such quantitative information is still limited and associ-ated with considerable uncertainties. Important improvements are possible. On the model side, a better definition of filtering approaches to account for longitudinal stress coupling would help. On the side of field evidence, the rapid formation with continued glacier retreat of numerous new lakes offers an opportunity to collect many more lake bathymetries of overdeepenings before lake sedimentation increasingly hides the original geometry.
The main result of the analysis presented here is nevertheless clear: the variability of overdeepening geometries is extreme and useful empirical statistical relations are hardly recogniz-able. This confirms what has long been known from statistics about glacial lake area and depth (Huggel et al., 2002; Cook and Quincey, 2015): lake/overdeepening area is not a good general predictor of lake/overdeepening depth. The very large scatter in the relations between the extracted parameters indi-cates little hope for significant improvement with the use of so-phisticated statistical analysis such as, for instance, multiple regressions. A more promising way out of the dilemma may be to consider geomorphological context and processes of lake formation possibly affecting lake geometries (Cook and Quincey, 2015). These processes, however, should be better understood. Especially the role of sub-glacial water in connec-tion with erosion and evacuaconnec-tion of sediments on adverse slopes could be critical (Creyts et al., 2013). The steep adverse slopes documented in this study should receive special atten-tion as they clearly exceed the‘classical’ value of 1.6 for the ra-tio of adverse slope to surface slope (Alley et al., 2003; cf. critical discussion by Creyts and Clarke, 2010; Werder, 2016). The rather unique case of Laguna 513 in the Cordillera Blanca with a very steep adverse bedrock slope recently exposed by artificial lake-level lowering illustrates in a striking way that this result is not simply an artefact from model calculations. A re-cent analysis by Werder (2016) indicates that the ‘classical’ value of 1.6 for the ratio of adverse slope to surface slope rep-resents the limit where supercooling is possible but not inevita-ble. Correcting for water pressure below overburden at the downstream end of the overdeepening provides a higher criti-cal limit at which supercooling must occur. Even though an ex-act test is hardly possible, the values for the adverse slopes documented in the present study seem to be in much better agreement with such concepts.
A crucial and unsolved question relates to the time of forma-tion of the overdeepenings and the related glacier condiforma-tions.
As good answers to this key question are not in sight for the near future, large uncertainties will likely continue to exist in relation to quantitative assessments of glacial depth erosion and corresponding geometries of glacial lakes.
Conclusion
A first systematic morphometric analysis of a large number of overdeepenings modelled for the currently glacier-covered parts of the Swiss Alps and of the Himalaya-Karakoram region was carried out and compared to precisely measured bathyme-tries (water depths) from recently exposed lakes in bedrock overdeepenings of the Cordillera Blanca in Peru. Parameters were extracted manually (bathymetries) or with specifically developed/adapted GIS-based algorithms (modelled bed topographies), which define corresponding morphological characteristics. The results of the study primarily document that the morphometric variability of the investigated overdeepenings is extreme– only weak and hardly significant correlations exist between the investigated parameters. This variability especially also concerns the relation between depth and area, length or width– overdeepenings with small surface areas can be deep and those with larger surface areas can be shallow. Adverse slopes can be markedly steeper than ‘classi-cal’ theoretical threshold values for supercooling and channel closure but are in better agreement with new concepts recently introduced by Werder (2016). Overdeepenings can exist under very small cirque glaciers with low shear stresses, but also at confluences and in straight trunk valley configurations under larger glaciers with higher shear stresses. A fundamental prob-lem with respect to the interpretation/analysis is the uncertainty about the time of formation of the overdeepened glacier beds and about the corresponding glacier characteristics (geometry, thermal state, flow). Empirical‘rules’ for estimating overdeepening geometries remain at best vague.
It becomes clear from such results that the knowledge and process understanding about depth erosion by glaciers and overdeepened topography of their rock beds is still strongly lim-ited and must be greatly improved to enable quantitative predictions.
Acknowledgements—The authors are grateful to the Swiss National Co-operative for the Disposal of Radioactive Waste (Nagra) for providing funding within the framework of investigating effects of glacial erosion related to the long-term safety of radioactive waste disposal. The study makes use of work about new lakes in the Swiss Alps performed by the recently completed NELAK-project within the framework of the Swiss National Research Program 61 on sustainable water management. The Peruvian lake bathymetries measured over the years by the Unidad de Glaciologia y Recursos Hidricos (UGRH) of the Autoridad Nacional del Agua (ANA) in Peru were analysed as part of the Swiss–Peruvian collaborative project GLACIARES 513 funded by the Swiss Agency for Development and Cooperation (SDC). The Glaciology and Geomorphodynamics Group (3G) at the Geography Department of the University of Zurich provided the modelled glacier-bed topogra-phies of all glaciers in the Swiss Alps and the Himalaya-Karakoram region. Thanks are due to Mauro Werder and an anonymous reviewer who provided constructive comments which helped improve an earlier version of the manuscript.
References
Adhikari S, Marshall SJ. 2013. Influence of high-order mechanics on simulation of glacier response to climate change: insights from Haig Glacier, Canadian Rocky Mountains. The Cryosphere 7(5): 1527–1541. DOI:10.5194/tc-7-1527-2013.
Alley RB, Lawson DE, Evenson EB, Larson GJ. 2003. Sediment, glaciohydraulic supercooling, and fast glacier flow. Annals of Glaci-ology36: 135–141.
Beaud F, Flowers GE, Venditti JG. 2016. Efficacy of bedrock erosion by subglacial water flow. Earth Surface Dynamics 4: 125–145. DOI:10.5194/esurf-4-125-2016.
Carey M, Huggel C, Bury J, Portocarrero C, Haeberli W. 2012. An inte-grated socio-environmental framework for glacier hazard manage-ment and climate change adaptation: lessons from Lake 513, Cordillera Blanca, Peru. Climatic Change112(3): 733–767. Clarke GKC. 2005. Subglacial processes. Annual Review of Earth and
Planetary Sciences33: 247–276.
Clarke GKC, Anslow SF, Jarosch AH, Radić V, Menounos B, Bolch T, Berthier E. 2013. Ice volume and subglacial topography for western Canadian glaciers from mass balance fields, thinning rates, and a bed stress model. Journal of Climate26: 4282–4303.
Cook SJ, Quincey DJ. 2015. Estimating the volume of Alpine glacial lakes. Earth Surface Dynamics 3: 559–579. DOI:10.5194/esurf-3-559-2015.
Cook SJ, Swift DA. 2012. Subglacial basins: their origin and importance in glacial systems and landscapes. Earth Science Reviews115: 332– 372. DOI:10.1016/j.earscirev.2012.09.009.
Creyts TT, Clarke GKC. 2010. Hydraulics of subglacial supercooling: theory and simulations for clear water flows. Journal of Geophysical Research115 . DOI:10.1029/2009JF001417.F03021
Creyts TT, Clarke GKC, Church M. 2013. Evolution of subglacial overdeepenings in response to sediment redistribution and glaciohydraulic supercooling. Journal of Geophysical Research: Earth Surface118(2): 423–446. DOI:10.1002/jgrf.20033.
Egholm DL, Pedersen VK, Knudsen MF, Larsen NK. 2012. Coupling the flow of ice, water, and sediment in a glacial landscape evolution model. Geomorphology141–142: 47–66. DOI:10.1016/j. geomorph.2011.12.019.
Farinotti D, Huss M, Bauder A, Funk M, Truffer M. 2009. A method to estimate the ice volume and ice-thickness distribution of alpine glaciers. Journal of Glaciology55: 422–430. DOI:10.3189/002214309788816759. Fischer UH, Bebiolka A, Brandefelt J, Follin S, Hirschorn S, Jensen M, Keller S, Kennel lL, Näslund J-O, Normani S, Selroos J-O, Vidstrand R. 2014. Radioactive waste under conditions of future ice ages. In Snow and Ice-related Hazards, Risks and Disasters, Haeberli W, Whiteman C (eds). Elsevier: Amsterdam; 345–393.
Frey H, Haeberli W, Linsbauer A, Huggel C, Paul F. 2010. A multi level strategy for anticipating future glacier lake formation and associated hazard potentials. Natural Hazards and Earth System Sciences 10: 339–352.
Frey H, Machguth H, Huss M, Huggel C, Bajracharya S, Bolch T, Kulkarni A, Linsbauer A, Salzmann N, Stoffel M. 2014. Estimating the volume of glaciers in the Himalaya-Karakoram region using dif-ferent methods. The Cryosphere8: 2313–2333. DOI:10.5194/tc-8-2313-2014.
Haeberli W, Hoelzle M. 1995. Application of inventory data for esti-mating characteristics of and regional climate-change effects on mountain glaciers: a pilot study with the European Alps. Annals of Glaciology21: 206–212 [Russian translation in: Data of Glaciologi-cal Studies, Moscow 82: 116–124].
Haeberli W, Schaub Y, Huggel C. 2016. Increasing risks related to land-slides from degrading permafrost into new lakes in de-glaciating moun-tain ranges. Geomorphology. DOI:10.1016/j.geomorph.2016.02.009. Herman F, Beaud F, Champagnac J-D, Lemieux J-M, Sternai P. 2011. Glacial hydrology and erosion patterns: a mechanism for carving gla-cial valleys. Earth and Planetary Science Letters 310: 498–508. DOI:10.1016/j.epsl.2011.08.022.
Hooke R. 1991. Positive feedbacks associated with erosion of glacial cirques and overdeepenings. Geological Society of America Bulletin 103: 1104–1108.
Huggel C, Kääb A, Haeberli W, Teysseire P, Paul F. 2002. Remote sens-ing based assessment of hazards from glacier lake outbursts: a case study in the Swiss Alps. Canadian Geotechnical Journal39: 316–330.
Huss M, Farinotti D. 2012. Distributed ice thickness and volume of all glaciers around the globe. Journal of Geophysical Research117(F4) F04010. DOI:10.1029/2012JF002523.
Jarvis A, Reuter HI, Nelson A, Guevara E. 2008. Hole-filled SRTM for the globe, Version 4 available from the CGIAR-CSI SRTM 90 m Data-base. http://srtm.csi.cgiar.org
Linsbauer A, Paul F, Hoelzle M, Frey H, Haeberli W. 2009. The Swiss Alps without glaciers– a GIS-based modelling approach for recon-struction of glacier beds. Proceedings of Geomorphometry 2009, Zurich; 243–247.
Linsbauer A, Paul F, Haeberli W. 2012. Modeling glacier thickness dis-tribution and bed topography over entire mountain ranges with GlabTop: application of a fast and robust approach. Journal of Geo-physical Research117 . DOI:10.1029/2011JF002313.F03007 Linsbauer A, Frey H, Haeberli W, Machguth H, Azam MF, Allen S.
2016. Modelling glacier-bed overdeepenings and possible future lakes for the glaciers in the Himalaya-Karakoram region. Annals of Glaciology57(71). DOI:10.3189/2016AoG71A627.
Maisch M, Wipf A, Denneler B, Battaglia J, Benz C. 2000. Die Gletscher der Schweizer Alpen: Gletscherhochstand 1850, aktuelle Vergletscherung, Gletscherschwundszenarien, Final Report NRP31. vdf Hochschulverlag: Zürich.
Müller F, Caflisch T, Müller G. 1976. Firn und Eis der Schweizer Alpen: Gletscherinventar. Geographisches Institut der ETH Zürich: Zurich. Patton H, Swift DA, Clark CD, Livingstone SJ, Cook SJ, Hubbard A.
2015. Automated mapping of glacial overdeepenings beneath con-temporary ice sheets: approaches and potential applications. Geo-morphology 232: 209–223. DOI:10.1016/j.geomorph.2015. 01.003.
Paul F. 2007. The New Swiss Glacier Inventory 2000: Application of Remote Sensing and GIS, PhD Thesis. Physische Geographie, Universität Zürich, Zurich.
Paul F, Linsbauer A. 2012. Modeling of glacier bed topography from glacier outlines, central branch lines, and a DEM. International Journal of Geographical Information Science 26: 1173–1190. DOI:10.1080/13658816.2011.627859.
Pfeffer WT, Arendt AA, Bliss A, Bolch T, Cogley JG, Gardner AS, Hagen J-O, Hock R, Kaser G, Kienholz C, Miles ES, Moholdt G, Mölg N, Paul F, Radic V, Rastner P, Raup BH, Rich J, Sharp MJ, The Randolph Consortium. 2014. The Randolph glacier inventory: a globally com-plete inventory of glaciers. Journal of Glaciology60(221): 537–551. DOI:10.3189/2014JoG13J176.
Rüesch R. 2013. Validierung und Anwendung einer mehrstufigen Strategie zur Identifikation zukünftiger Gletscherseen, Master thesis. University of Zurich; 113 pp.
Suter S, Laternser M, Haeberli W, Hoelzle M, Frauenfelder R. 2001. Cold firn and ice of high-altitude glaciers in the Alps: measurements and distribution modeling. Journal of Glaciology47(156): 85–96. Swift DA, Cook S, Heckmann T, Moore J, Gärtner-Roer I, Korup O.
2014. Ice and snow as landforming agents. In Snow and Ice-related Hazards, Risks and Disasters, Haeberli W, Whiteman C (eds). Elsevier: Amsterdam; 167–199.
Swisstopo. 2005. Das digitale Höhenmodell der Schweiz. Swiss Federal Office of Topography, Bundesamt für Landestopographie, Wabern, Switzerland.
Werder M. 2016. The hydrology of subglacial overdeepenings. Geo-physical Research Letters 43(5): 2045–2052. DOI:10.1002/ 2015GL067542.
Zemp M, Kääb A, Hoelzle M, Haeberli W. 2005. GIS-based modelling of the glacial sediment balance. Zeitschrift für Geomorphologie, Suppl.138: 113–129.
Supporting Information
Additional supporting information may be found in the online version of this article at the publisher’s web site.