Publisher’s version / Version de l'éditeur:
International Journal of Cast Metals Research, 17, 4, pp. 193-200, 2004-12-20
READ THESE TERMS AND CONDITIONS CAREFULLY BEFORE USING THIS WEBSITE.
https://nrc-publications.canada.ca/eng/copyright
Vous avez des questions? Nous pouvons vous aider. Pour communiquer directement avec un auteur, consultez la
première page de la revue dans laquelle son article a été publié afin de trouver ses coordonnées. Si vous n’arrivez pas à les repérer, communiquez avec nous à PublicationsArchive-ArchivesPublications@nrc-cnrc.gc.ca.
Questions? Contact the NRC Publications Archive team at
PublicationsArchive-ArchivesPublications@nrc-cnrc.gc.ca. If you wish to email the authors directly, please see the first page of the publication for their contact information.
NRC Publications Archive
Archives des publications du CNRC
This publication could be one of several versions: author’s original, accepted manuscript or the publisher’s version. / La version de cette publication peut être l’une des suivantes : la version prépublication de l’auteur, la version acceptée du manuscrit ou la version de l’éditeur.
For the publisher’s version, please access the DOI link below./ Pour consulter la version de l’éditeur, utilisez le lien DOI ci-dessous.
https://doi.org/10.1179/136404604225020650
Access and use of this website and the material on it are subject to the Terms and Conditions set forth at
Prediction of microporosity in Al-Si castings in low pressure permanent
mould casting using criteria functions
Shang, L. H.; Paray, F.; Gruzleski, J. E.; Bergeron, S.; Mercadante, C.;
Loong, C. A.
https://publications-cnrc.canada.ca/fra/droits
L’accès à ce site Web et l’utilisation de son contenu sont assujettis aux conditions présentées dans le site
LISEZ CES CONDITIONS ATTENTIVEMENT AVANT D’UTILISER CE SITE WEB.
NRC Publications Record / Notice d'Archives des publications de CNRC:
https://nrc-publications.canada.ca/eng/view/object/?id=3f62d03c-a52a-431d-819e-51fef5da0a61 https://publications-cnrc.canada.ca/fra/voir/objet/?id=3f62d03c-a52a-431d-819e-51fef5da0a61uu-- ---u uu - uu_---I I I I I I I I I
Prediction of microporosity in AI-Si castings
in low pressure permanent mould casting
using criteria functions
L. H.Shang1*,
F. Paray\ J. E.Gruzleski1,S. Bergeron2t, C. Mercadante2~ and
C. A. Loong2
1Department of Mining, Metals and MaterialsEngineering, McGillUniversity,M.H. Wong Building, Room
2160, 3160 University Street, Montreal, Que., H3A 2B2
21ndustrial Materials Institute, National Research Council Canada, Boucherville, Que., Canada J4B 6Y4
I I I I I I I I I I
Microporosity, a serious defect in Al-Si based castings, severely prevents their widespread applications in many critical conditions. The use of criteria functions to predict quantitatively microporosity level holds pro-mise. To date, an ideal criteria function has yet to be obtained. In the present work, microporosity distribu-tion in three prominently used hypoeutectic Al-Si alloys (319, 356 and 332) was investigated. The prediction effectiveness of single solidification parameter and existing criteria functions was evaluated by correlating thermal data of simulation studies to experimentally obtained microporosity values. Two new criteria functions are proposed based on experimental observa-tion and multivariable regression analysis. The results indicate that thermal parameter-based criteria func-tions may be used to predict the microporosity in Al-Si castings but have their limitations. A general criteria function 4.18 V:.13 (tf, local solidification time; Vs, solidification velocity) can be applied to predict microporosity for the family of hypoeutectic Al-Si casting alloys within a certain error. IJCMR/522 <D2004 W. S. Maney & Son Ltd. Manuscript received24 June 2004;accepted 23 July 2004.
Keywords:Microporosity; Prediction; Criteria functions; AI-Si castings
I
I
I I I I I I I I I I I I I I I I I I I I I I I IntroductionMicroporosity in Al-Si castings is one of the most detrimental defects responsible for high scrap loss in the production of commercial castings and severely prevents their widespread uses in many critical load-bearing conditions. The damaging effects of micro-porosity are lack of pressure tightness, limited strength, variable fracture toughness and notable reduction in ductility as well as lower fatigue resistance.l-4 Prediction of microporosity amounts in castings is significant from both a practical and a *Correspondingauthor, emaillihong.shang@mail.mcgill.ca tPresent address:styl & tech Inc., complexshape engineer-ing, 3700 rue du Campanile, Sainte-Foy, Que., Canada GIX 4G6.
tPresent address: Chemistry Department, Faculty of Science and General Studies, Vanier College, 821 Ste Croix, St. Laurent, Que., Canada H4L 3X9.
00110.1179/136404604225020650
scientific point of view. The formation of micro-porosity during solidification is a very complicated process, involving heat, mass and fluid flow. It has been basically accepted that microporosity -in cast aluminium silicon alloys is a result of two main factors: hydrogen rejection as a result of a drastic reduction in the solubility from liquid to solid phase, and/or the volume contraction coupled with poor interdendritic feeding during mushy zone solidification.5-8
There have been numerous studies on porosity prediction in cast aluminium alloys since the 1950s. Most of these focus on establishing various relation-ships between the casting conditions (alloy composi-tion, solidification parameters, hydrogen content, treatment of liquid metal, use of risers and chills) and the porosity level found in castings (per cent porosity, size or shape of porosity). The methods used vary from simple criteria functions based on experi-mental studies to complicated continuum models considering the fluid flow coupled with several conservation and continuity equations, as well as nucleation and growth of hydrogen pores.9-13 Criteria functions consist of solidification parameters (e.g. thermal gradient G, cooling rate R, solidification time tf and solidification velocity Vs), by which the per cent porosity can be calculated directly from the derived mathematical equation. By comparison, the conti-nuum models based on formation mechanisms are currently too computationally complicated to be used in industrial practice. Since solidification parameters can be simulated by computer modelling, the criteria function method seems to be a practical way for casting producers to predict an appropriate solidifica-tion condisolidifica-tion necessary to control porosity under a required critical level. During the past few decades, a number of porosity criteria functions were proposed under different casting conditions (Table 1).14-24 Among all of these, there is a noticeable absence of sufficient research on the prediction of micro-porosity in a variety of hypoeutectic Al-Si alloys commonly used in the automotive industry. In addition, little attention has been paid to micro-porosity prediction under low pressure permanent mould (LPPM) casting conditions. As a result, there is -a lack of understanding of whether the existing
194 Shang et al. Prediction of microporosity in AI-Si castings
thermal modelling. The length and width of the I!lates were 279.4 mm (11'') and 101.6 mm (4"), respectively, and the sizes of the gates were 50.8 mm (2'') in width with a thickness ratio of 2: 3 between the gates and the plates. I-I I I
I
II
I I I I I I I I I I I I I I I I I I I I I I I I ---I II
I
I
I I I I I I I I I I I I I I I I I I I I I I I I I I I I I Experimental SamplesA die wasdesignedto producefour plate sampleswith
different thicknesses as described in a previous study on thermal analysis.25,26The plate castings are shown schematically in Fig. 1. The four thicknesses are 3.2 mm (118''), 6-4 mm (1/4''), 12.7 mm (1/2'') and 19.1 mm (3/4''). This geometry was selected for two main reasons: the simple plate shape is a basic form found in castings, and it is readily amenable to 1 Schematic diagram of plate samples with four
different thicknesses
criteria functions can be used for the quantitative prediction of the amount of microporosity in commonly used Al-Si castings formed by the LPPM process.
The work presented in this paper is part of a project conducted by McGill University and its partners on the use of criteria functions to predict microporosity levels quantitatively in prominently used AI-Si alloys
in the automotive industry. The characterisation of the castings is investigated in terms of microporosity distributions and thermal parameters under LPPM casting conditions. Attempts to correlate the micro-porosity to a single thermal parameter and existing criteria functions in an empirical way are presented and evaluated. Two new criteria functions are developed by experimental observation and multi-variable regression analysis. The degree of fit and the limitations of the criteria function method are also discussed.
----Alloys and production of castings
Commercial aluminium-silicon alloys 319, 356 and 332 were used. The chemical compositions of the alloys are given in Table 2. All alloys were modified with 180 ppm strontium. Castings were produced in an industrial environment using a low pressure permanent mould casting machine located at Grenville Castings Ltd in Perth, Onto A 2.1 x 10⁴ Pa (3 psi) gauge pressure was used to ensure that the molten metal rose steadily up through the feed tube into the die. The casting cycle time consists of three portions: cast or pressure time, cooling time and open time. The related process parameters are listed in Table 3, and the crucible melt temperatures are given in Table 4. On average, producing a casting (four plate samples) took 3.2-3.5 min. The hydrogen level of the melt was determined by a modified Straube-Pfeiffer test developed at McGill to _~ve a quantita-tive value of the hydrogen content.27, 8 The gas level in the melt (normal gas level of the as melted metal) was estimated to be in the range of 0.20-0.30 mL H21
100 g AI for all the alloys. Microporosity determination
The microporosity volume percentage was deter-mined by density measurement calculated by Archimedes's principle. For each alloy, several plate castings produced in the steady state were randomly selected and radiographed in order to obtain a general idea of soundness. Each plate was sectioned into three parts along the length, referred to as middle, left and right slices. Each slice was then cut into 19 small rectangular blocks with dimensions of Table 2 Chemical compositions of alloys
AlloySi.% Fe.% Cu. % Mn. % Mg, % Zn, % Ti, % AI, % 319 6.25 0.42 3.62 0.28 0.06 0.53 0.16 Balance 356 7.30 0.11 0.06 0.06 0.34 0.01 0.014 Balance 332 9.33 0.19 2.87 0.03 1.06 0.10 0.12 Balance
. Table 1 Criteria functions for porosity prediction surveyed from literature
II
No. Criteriafunction Reference Year Alloy Castingprocess
1 Thermalgradient: G 14 1959 AI-7Mg alloy Sand
2 Solidification time: tf 15 1973 AI-Cu-Si (LM4) Sand
3 Feedingindex (FI): G/tf 15 1973 AI-Cu-Si (LM4) Sand
4 Solidus velocity: V. 16 1975 Steel; cast iron; AI, Sand
Mg and Cu alloys
5 Niyama: G/R1/z;G:thermal 17 1982 Steel Sand
gradient; R:cooling rate
6 LCC: G.t:/3IV. 18 1990 AI-7Si--O.3Mg; Sand
Hz<0'01 mL/100 gAl
7 Feedingefficiency: G/(V..-1) 19 1994 A201 AI alloy Sand
8 -474. V;o'317 20,21 1994 A356 AI alloy Sand
KCL: dI'4IV'6 22 1995 AI-4.5Cu alloy Graphitetube directional
solidification
9 cP'381 V'62 23 1996 AI-7Si-Q'3Mg Sand
10 G/(R1/z.t:"); n=3.4333Hg.9807 24 2000 A356 AI alloy Lostfoam
1 I I I I I I I I I I I I I I I I I I I I I I I I I I I' I Feedingend I ... I I I I I I I I I I I I
~hang et al. ~recllctlon or mlcroporosny In AI-;:)I castings
279.4mm
2 Schematic diagram of small blocks used for porosity determination I I I I I I I I I
33 x 15 x (plate-thickness) mm3 (Fig. 2). The density and per cent microporosity of the small blocks were calculated by the following equations
Ma DT-DM
DM=(Ma-Mw)xDw,%P= DT x 100 where Ma is the sample mass in air (kg), Mw is the sample mass in water (kg), DM is the measured density of the small block sample (kg m -3), DT is the theoretical density of the alloy (kg m-3), Dw is the density of water (kg m-3), and P is the volume percentage of microporosity (%).
The theoretical densities of the three alloys were obtained using sound disc samples cast in a copper mould. The values for 319, 356 and 332 alloys were 2.788 x 10³, 2.678 X 10³ and 2.725 x 10³kg m-3, respectively.
From the individual value for each block, a microporosity distribution map of the entire plate could be obtained.
Simulation for thermal parameters
The simulation package used for this project was CASTVIEW developed at the Industrial Materials Institute at BoucherviIIe, Que. The simulation process was performed using a SGI Origin 2000 computer composed of 16 processors with a total of 8 Gigabytes of RAM at 250 MHz IP27. By computer modelling of filling, heat transfer and solidification, the thermal conditions within a casting at any location could be obtained. The locations chosen were those where the per cent porosity' "determined experimentally. At each node (samr four kinds of thermal data were calculC' . if, solidification time, s; R, cooling ratf' \ the solidu~. K S-I; G a1 gradient at the ';O"dUS,K mm-1; Vs, solid""-,, m velocity.
mms-i. .
The model data were validated by comparison to temperature measurements taken on the castings during solidification.
Results and discussion
Microporosity distribution in plate samples Microporosit~~ defined as micrometre scale cavities (10-300 /lm), is the focus in criteria function development. Since some massive macro shrinkage Table 3 LPPM process parameters for casting
samples
Alloys Pressure time, s Cooling time. s Open time, s Cycle time, s
319 90 356 96 332 80 90 80 80 31 30 31 211 206 191 I~:> 2.53 225
g
2.00 l:' 1.75 jjj 1.5:1 f 125 0 Co 1.00 0 t 0.75 ~ 0.5:1 025 0.00 0-- 6.4
nvn Left -- 6.4nvnRighi .~.
25 50 75 100 125 153 175 200 225 250 275 300 Distance from feeding end (mm)(a) 2.50 225
g
2.00 l:' 1.75 jjj 1.50 0 ~ 125 Co 1.00 0 t 0.75 ~ 0.50 025 0.00 0 ~. 25 &I 75 100 125 150 175 200 225 250 275 300Distance from feeding end (mm) (b) 2.50 ~ 2.25 e3. 2.00 ~ 1.75 in 1.50 0 ~ 1.25 Do 1.00
e
0.75 u ~ 0.50 0.25 0.00 0 (c) --19.1 mm Let --19.1 mm Right .-> 25 50 75 100 125 150 175 200 225 253 275 300.
Distance from feeding end (mrn)a 6.4 mm thickness; b 12.7mm thickness; c 19.1mm thickness
3 Typical microporosity distribution in different
thickness plates for 319 alloy
was found in the middle slices of the plate castings, only the side slices were used for the data source. In addition, a few porosity values greater than 2% which relate to open macro shrinkage pores were removed from the data set.
The microporosity distributions in three plate thicknesses (6.4, 12.7 and 19.1 mm) for all three alloys (319, 356 and 332) were investigated. The amount of microporosity related to the distance from the feeding end of the plate castings was plotted as shown in Fig. 3. Each point on the graph represents the average calculated from four randomly selected samples. Figure 3 compares the micro porosity dis-tributions in different thickness plates for 319 alloy. The results indicate that the thicker the cross-section of the sample, the higher the microporosity level. This is consistent with the expectation that in the thicker plates the lower cooling rate and longer solidification time lead to a greater amount of microporosity. In addition, it is noted that the microporosity is much greater in the middle than at the two ends because of Table 4 Metal temperature (OC)in crucible
Alloys 319 with Sr 356 with Sr 332 with Sr Temperature (°C) 746 745 721
International Journal of Cast MetalsResearch 2004 Vol. 17 No.4
I
I
I
I
I
I
I
I
I
I
I
I
I
I
I
I
I ! II
I
I
II
I
I
I I I II
I
I
I
I II
I
I I I I I I II
I
I I I I I196 Shang et al. Prediction of microporosity in AI-Si castings
I I I I I I I
Thermal parameters from simulation
Thermalparametersspecifythe
solidificationcondi-tions. Four kinds of basic thermaldata, including
2.&J ~ 2.2!S es. 2.00 ~ 1.7S .iii 1.&J 0
~
1.2!S 0.1.00e
0.75 u ~ O.&J 0.25 0.00 0 (a) ""--19.1 mm Loft --- 19.1 mm Right'.
25 &J 75 100 125 1&J 175 200 225 250 275 300Distance from feeding end (mm)
2.&J 2.25 19.1 mm Left ---19.1mm Right ~ es. 2.00 .?;o 1.75 .iii 1.&J 0 ~ 1.25 0. 1.00 0
t
0.75::E O.&J I II.
0.25
/~ -~~.
0.00
0 25 &J 75 100 125 150 175 200 225 2&J 275 300 (b) Distance from feeding end (mm)
250 225
~
200 .?;o 1:75 iii 150 0 ~ 125 go 100t
075 ::E 050 025 000 0 (c) 50 100 150 :!)() 2&JDistance from feeding end (mm)
300
a 319 alloy; b 356 alloy; c 332 alloy
4 Typical microporosity distribution' in 19.1 mm thickness plates for different alloys
the late solidification in the middle zone. Moreover, it also can be observed that the microporosity distribu-tions for the left and right side slices are not identical, although they are of the same general form. The difference is a result of the slightly different solidification conditions caused by the adjacent plate, which may be thicker or thinner depending on location. As a result, the heat flux during solidification is different for the left and right sides of each plate.
Figure 4 illustrates the microporosity distribution in the same thickness plates (19.1 mm) for three different alloys (319, 356 and 332). The effect of alloy composition on the formation of microporosity is clearly demonstrated. The higher the silicon content, the lower the microporosity displayed. For Al-Si alloys, with the increase in the weight percentage of silicon (319 alloy: 6.25 Si%, 356 alloy: 7.30 Si% and 332 alloy: 9.33 Si%), the freezing range and the amount of primary a-AI dendrites will decrease. Thus, the dendrite network will form later, and the feeding resistance through the interdendritic space is reduced resulting in an increased feeding ability.
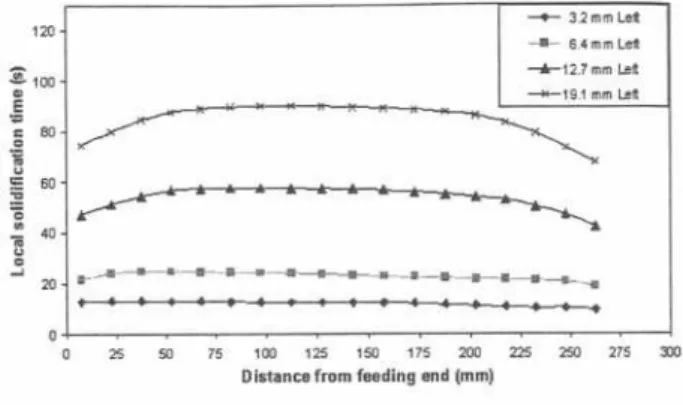
120 :E100.. E ~.. eo i .::: 60 ~ e .. 4(J ] .. .... 20 0 0 50 75 100 125 150 175 200 225 250 275 300
Distance from feeding end (mm)
25
5 Example of simulated thermal data: local solidi-fication time (t,) in different thickness plates for 356 alloy
local solidification time (tf), thermal gradient at the solidus (G), cooling rate at the solidus (R), and solidification velocity (Vs), were simulated corre-sponding to different locations in the plate castings. A very large number of thermal data were obtained and only some typical results of the local solidification
time (tr)
in four differentthickness.samplesfor 356
alloy will be discussed as an example here. Local solidification time versus specific location (distance from feeding end) is shown in Fig. 5. Signs of decreasing local solidification time can be first observed at the two ends of the plates whereas the centre remains at higher values. This observation becomes more pronounced with the thicker plates (12.7 and 19.1 mm) because of the larger quantity of metal involved. Meanwhile the thinnest plates (3.2 mm) appear to have a uniform distribution as a result of relatively equal cooling rate, and of course the thicker the plates, the longer the local solidification time since more liquid metal needs to solidify.
Evaluation of effectiveness of single thermal parameter and existing criteria functions
The method of correlation analysis is displayed in Table 5. The dependent variable is the per cent microporosity, and independent variables are the various porosity criteria. In order to find the best-fit predictive equation, five regression models for correlation analysis were used: linear, logarithmic, polynomial, power and exponential models. The analysis step is illustrated in Fig. 6. The correlation analysis begins with a single alloy using the data of three different thicknesses, respectively, to investigate the effect of the geometry factor on the microporosity level. Since a real casting always consists of different cross-sections, the data combining the three thick-nesses are then used to evaluate the effectiveness for microporosity prediction in a more real casting. Next, the data combining three alloys with all of the thicknesses are used to survey whether there is a general criteria function able to predict the micro-porosity level for the family of hypoeutectic Al-Si castings.
A statistical term, the coefficient of determination denoted by ,2, provides a measure of the goodnessof
fit for the estimated regression equation. The InternationalJournal of Cast MetalsResearch 2004 Vol.17 No.4
I--19.1 mmLeft I-&-19.1 mmRight
--4£7' -- ... -+- 32mmLet -- 6.4mmLet -+-12.7 mmLet 19.1mmLeft " ' , ,, ,, "...
.. .. ... ... ... ... ... "' '''. .
. -8--8--
.
.
. -"----tt.---.,
.---"
. . . , . . . , I . . . ..~,
r
I
.--.
I -I---I
I I I I I I I I I I I I I I I I I - --uShang et al. Prediction of microporosity in AI-Si castings 197
6.4 mm } 12.7 mm 3 thicknesses 19.1mm ~ &.4mm f
~
. .. . aIlMij':-
12.7mm 3thicknee8es ~'. :".;1",--.
19.1 mm 3 iotIlQY$ ~--
6.4 mm } 332 ~IJ()Y-
12.1 mm 3thickne$se$ .--
19.1 mm6 Schematic illustration of steps for correlation analysis I I I I I I I I I I I I I I I I I I I I I I I I
coefficient of determination can have values between zero and one30
,2= L(Yi-jii
L
(Yi- ji)2
where Yi is the measured value of microporosity (%),
Yiis the estimated value of microporosity (%) and ji is the mean value for the microporosity (%). The ,2 value indicates the percentage of variation of the dependent variable which can be explained by using the predicting equation.
A value of ,2
=
1 indicates that the predicting equation can account for all variation in micropor-osity. A value of ,2=0.60 indicates that 60% of the variation in microporosity can be explained by the predicting equation with related porosity criteria as the independent variable. Therefore, the greater the ,2 value, the better the effectiveness of prediction. As a practical matter, for the typical data found in social sciences, values of ,2 as low as 0.25 are considereduseful, whereas ,2 values of 0.60 or greater are rational in physical and life sciences. It is the authors' opinion that for predicting microporosity in castings, values of ,2 greater than 0.25 can be considered indicative, whereas values around 0.50 indicate that the criteria function may be used for prediction.
The evaluation results of Table 6 show the predic-tion effectiveness for the simple plates with a certain thickness. Some ,2 values of around 0.50 or greater mean that the related porosity criteria may be used to predict microporosity in the castings with a uniform cross-section, and there will be some estimation errors. As can be seen in Table 6, the correlation Table 5 Basic method for correlation analysis
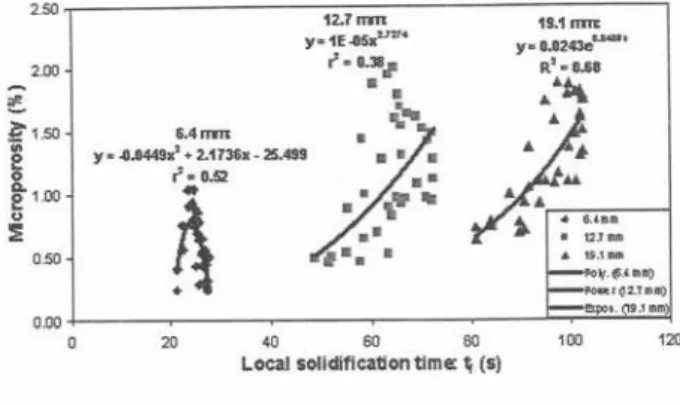
2.50 12.1,"" y.1E -8Sx"'" r'. us".
.
.
.t"-19.1om: y- 0.0243e"-' R'-0.&1~
~~:'
~ ~ ~ A ~. ...
. 121..
. ...
~."".II)
'''0'''.11) ...,..(10.1 2.00 ~ ~1.50 ;;; f 0 ~1.ooi
6.4,"" y. -8.o449x'. 2.1136x- 25.499 r'.
0.52A
0.50 0.00 0 20 40 60 60Local solidification time: ~ (s)
100 120
7 Example of evaluation of single parameter
-local solidification time (4) for 319 alloy with three different thicknesses, respectively, P(%)= ((4)results associated with the 19.1 mm (3/4') thickness samples are almost always higher than those of 6.4 mm (1/4') and 12.7 mm (1/2') samples, no matter the porosity criteria or alloy type. Figure 7 as an illustration also demonstrates that different predictive equation models and ,2 values correspond to different thickness plates.
Table 7 gives the results of the evaluation for micro porosity prediction in the single Al-Si alloys and the family of hypoeutectic alloys based on the data for all three thicknesses considered together. Although none of the values of,2 is greater than 0.50 for the three kinds of single alloys, the single thermal parameter do~s have some impact on the micro-porosity amount in certain alloys. This effect is clearly suggested by some values, such as tr and G (0.47) as well as R (0.38) for 319 alloy, and G (0.42) for 356 alloy. When the data for the entire hypoeutectic alloy family is considered, the highest value of ,2 is only 0.17. This result indicates that the single thermal para-meter and existing criteria functions cannot be simply used as a general criterion to predict microporosity for the family of hypoeutectic Al-Si casting alloys.
New or improved criteria functions
New improved criteria function - ttl(Q.5L)
Based on the above results and discussion of the comprehensive evaluation, the local solidification time (tr) is always a major factor in the prediction
of microporosity for different AI-Si alloys as in the thickness of the solidified part. A new criteria function has been proposed in the form of tcl(0'5L)
Dependent variable (y) (measured)
Microporosity, P. % Single parameter
Independent variables (x) (simulated) I I I I I I I
Local solidification time: tf Cooling rate: R Thermal gradient: G Solidification velocity: V. (\jiyama: GFf1/2 LCC: Gt:/3'V;1 y=ax+b y=alnx+b y=ax2+bx+c y= aX' y=at/'x Regression models for correlation analysis
Existing criteria function
Linear Logarithmic Polynomial Power Exponential
InternationalJournal of Cast Metals Research 2004 Vol. 17 No.4
'. - - n- -_.
198 Shang et al. Prediction of microporosity in AI-Si castings
2.50 I I I I I I I I I I I I I I I I I I I I I I I I I I I I I I I I I I I I I I I I I I I I I I I I I I I I I I ! I y- 0.0001.' -0.009&8 + 11.&518 r'
-
0.17 l2DO ~ 1ii1.50 ~ 0g.
1.00 ... u :i!0.50.
.
'Z-t ,.'
.
.,
:". '..
.' ,fi
',.'t.',. '
'. :':"'~',; . ~ ~'!;..)i. .; , ~- , "".': ", . :.. :","'-.'#:1#', .. , ..
.:...:.'1''., , 0.00 0 40 6U 80 100Local solidification time: ft(s)
8 Correlation between microporosity and local solidification time (ft) for three AI-Si alloys (319, 356 and 332), P(%)= t{ft)
20
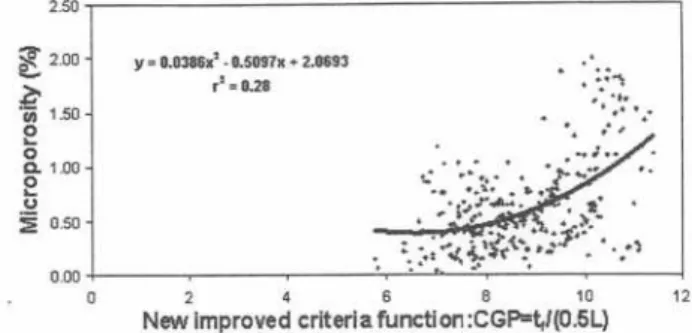
known as the CGP factor, where L is the thickness of castings, Figures 8 and 9 compare the data distribu-tion of two criteria, tf and CGP. As can be observed from the figures, the data are more scattered for the single factor (tf) than that for CGP which combines the two parameters, tf and L. The low ,2 value of 0,28 in Fig. 9 stems from the fact that data from the 6.4 mm plates always shows a poorer correlation than data from thicker plates. An example of the applica-tion of the CGP criterion to a thicker 19.1 mm plate is shown in Fig. 10 where a good correlation is obtained between measured and predicted values.
I I I I I I I I I I I I I I I I I I I I I I I 2.50 l2.00 ~ 1ii1.50 0 ... 0 Q. 1.00 ~u :i!O.SO y=0.038&8' -0.5097. + 2.0&93 r' =8.28
.
..:'. ,':' ',:,.' , , ..'I~,.
;":"':.'" .
,11 ' " . . 1\.' " :.."~ .s...'~~.:. ~;p~' .. . " '," .,:~ 120 0.000 2 4 6 8 10 12New Improved criteria functi on :CGP=t,1(O.5L)
9 Correlation between microporosity and CGP (ft) for three AI-Si alloys (319, 356 and 332), P(%) = t{CGP)= [(ft/O'5L))
New general criteria function for hypoeutectic AI-Si castings
The method of multivariable regression analysis was used to develop a general criteria function to predict microporosity for the family of hypoeutectic Al-Si castings. In regression models, the dependent variable is the per cent microporosity, and the independent variables are a series of thermal parameters as defined in the previous sections. Different combinations of parameters are displayed in Table 8, The commercial statistics software package SAS 8.2 was used for the multiple regression analysis.
Table 7 Evaluation of single parameter and existing criteria functions for hypoeutectic AI-Si alloys
Coefficient of determination: ?
Table 6 Evaluation of single parameter and existing criteria functions for single AI-Si alloys with different thicknesses
Coefficient of determination:?
No. Porosity criteria Sample thickness 319-Sr 356-Sr 332-Sr
tf 6.4 mm (y.") 0.52 0.32 0.09 12.7 mm(¥s") 0.38 0.49 0.18 19.1 mm (Y.") 0.68 0.29 0.77 2 R 6.4 mm (Y.") 0.11 0.27 0.05 12.7 mm (W') 0.01 0.52 0.14 19.1 mm(Y.") 0.33 0.52 0.66 3 G 6.4 mm (W) 0.08 0.29 0.03 12.7 mm (¥s") 0.22 0.70 0.11 19.1 mm (%") 0.28 0.76 0.73 4 V. 6.4 mm (y.") 0.36 0.18 0.04 12.7 mm (¥S") 0.09 0.36 0.09 19.1 mm (%") 0.53 0.32 0.26 5 Niyama 6.4 mm (W) 0.16 0.27 0.04 12.7 mm (¥S") 0.21 0.67 0.04 19.1 mm (%") 0.43 0.69 0.48 6 LCC 6.4 mm (W) 0.31 0.24 0.03 12.7 mm (¥S") 0.16 0.57 0.01 19.1 mm (Y.") 0.41 0.57 0.31
Porosity 319 (three 356 (three 332 (three 319, 356 and 332 No. criteria thicknesses) thicknesses) thicknesses) alloys (three thicknesses)
1 tf 0.47 0.16 0.24 0.17 2 R 0.38 0.13 0.01 0.05 3 G 0.47 0.42 0.05 0.02 4 V. 0.21 0.04 0.12 0.08 5 Niyama 0.02 0.11 0.07 0.14 6 LCC 0.24 0.04 0.03 0.09
I
I I.~.
I'J,I~
I
i~
Ii,
I
r;
I ,
,
~I
I
I
I
I
I
I
I
I
Shang et al. Prediction of microporosity in AI-Si castings 199
2.00 ,.00 1.00 l,... ~'.20 fij 2,00 0 ~o.oo ~ 0.60 0." 0.20 000 0 25 50 75 ~ m ~ m n m ~ m n
Position: distance from feeding end (nm)
10 Example for prediction of microporosity using CGP [(ft/0.5L)) in 19.1 mm thickness plate of 356 alloy 2.50 y= ~-' + 0.0039., 0.1952 r' -0.60 . .2.00 ~ f,.50 e0 f'1.DO " :EO.50 , "
. .
I ~. , . .' 0.00 0 m 400 600 CFcf(Ii,V,) 800 1000I
II
I
I
I
I
I
II
I
I
I
I
11 Predicting microporosity in hypoeutectic AI-Si castings (319, 356 and 3321 using new general criteria function, 1'(%1= tift, Vsl= t{~"SV:"31 The results indicate that the parameter combina-tion of 4.18~'13 is an effective new criteria funccombina-tion since it presents the highest? value and is a simple form with only two parameters. Figure 11 shows a
much more concentrated data distribution (?
=
0.60)than does Fig. 8 (? = 0.17), and a stronger correlation than in Fig. 9 (?=0'28) for CGP function. The value of y2 is increased by 43%, compared with the previous best result of 0.17 from the evaluation for single parameter and existing criteria functions.
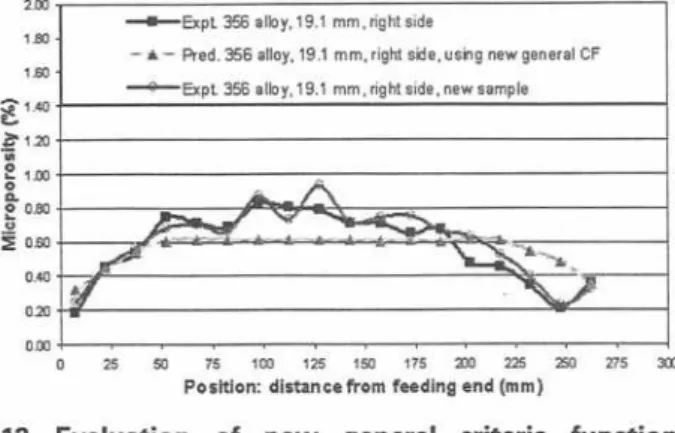
A prediction using this new criteria function is shown in Fig. 12. The values expressed by square symbols indicate the measured microporosity values from four selected samples, which were used for the regression analysis. The values with triangular symbols are the predicted microporosity values calculated from the predicting equation. As can be noted, the average error between them is less than 0.2% microporosity. The values shown as open circle symbols are the per cent microporosity measured from a sample that was randomly selected and not used for the initial regression analysis. In order to examine the prediction error of using the new general Table 8 Multivariable regression models for
devel-opment of new criteria function
No. '1". 1 2 .; 3 .~. 4 .~5
."'..-International Journal of Cast Metals Research 2004 Vol. 17 No.4
2.00
1.00 -Expl356 alloy,19.1mm, rightside
- Pred.356alloy,19.1mm, rightsile, usng newgeneralCF -Expl356 alloy,19.1 mm,right side,newsample
1.60 ~1.4O & ~1.20 iii
~
1.DO ... I! 0.00 " ~ 0.60 0.40 0.20 om ' ° 25 ~ ~ ~ m ~ m ~ m ~ m nPosition: distance from feeding end (mm)
12 Evaluation of new general criteria function
(tl',sV:.,31 for predicting microporosity in 19.1 mm thickness plate of 356 alloy
1200
criteria function, the statistical term, standard error of the estimate (e) is used. This is the square root of the average squared error of the prediction. Table 9 shows the results related to 356 alloy. The thicker samples (19,1 and 12.7 mm thickness) present a lower error (0'17), whereas the error is larger (0.32) for the thinner plates (6.4 mm). The average error is 0.23 for the entire 356 alloy data set.
It should be emphasised that criteria functions based on experimental studies only consider the thermal parameters. The effects of other significant factors on the formation of microporosity, such as hydrogen precipitation, alloy type and treatment of liquid metal, are neglected. This inevitably causes two inherent'limitations for microporosity prediction in Al-Si castings, the predicting error and the required specific solidification condition under which the criteria function is obtained. However, the criteria function method provides a simple way for the general prediction of microporosity in Al-Si castings. Criteria functions can be a useful guide for casting producers to establish a suitable solidification condi-tion to maintain the microporosity under a required critical level.
Conclusions
1. Alloy type is an important factor in determining the inherent microporosity amount in AI-Si castings. The lower the silicon content, the greater the tendency for microporosity formation.
2. The thermal parameters associated with the solidification process have a strong impact on the formation of the microporosity in Al-Si alloys. Table 9 Standard error of estimate for
micro-porosity prediction in 356 alloy
Thickness eO:Standard error of the estimate 6.4 mm(Yo") 12-7 mm ('M.") 19.1 mm ('I.") Alldata 0.32 0.17 0.17 0.23
*e= V(n!.;:'I)=-/'f:~=;~2,where SSE: sum of residual squares owing toerror,p= 2: number of independent variables,n:number of statistical records, Vi: measured microporosity value, %,
y.
estimated microporosity value, %. --Exp!.356 alloy.19.1Mm.rightside-Pred. 356 alloy,19.1mm,rightside,using CGP
-/ ""'-./
Regressionmodel No. Regressionmodel
P=a.trLC 6 P=a.tr P=a.tr.Rc.Ld 7 P=a.tr-Rc P=a.trGC.Ld 8 P=a.t.Gc P=a.tr'V;.Ld 9 P-a.tb.V:- f S d P=a.rr.Gc.Rd.Le 10 P=a.rr.Gc.R
I I I I I I I I I
200 Shang et al. Prediction of microporosity in AI-Si castings The local solidification time, which is related to
casting thickness, is particularly important.
3. Thermal parameter-based criteria functions may be used to predict the microporosity in Al-Si castings, but have their limitations.
4. Two new criteria functions have been developed, which yield much better predicting results than the existing criteria functions. Of those two, the general criteria function 4.18V~'13can be used to predict microporosity with less error than does the CGP function.
Acknowledgements
The authors wish to acknowledge the financial and technical support of all six partners in this project: Natural Sciences and Engineering Research Council of Canada (NSERC), Grenville Castings Ltd (Ont.), Timminco Metals a division of Timminco Ltd (Haley, Ont.), the Centre de Metallurgie du Cegep de Trois Rivieres (Trois Rivieres, Quebec), the Institute of Industrial Materials IMI (Boucherville, Quebec), and the Centre Quebecois de Recherche et Devel-oppement de l'Aluminium CQRDA (Chicoutimi, Quebec).
References
I
I
I
I
I
I
I
I
I
I
I
I
I
1. B. KULUNK, S. G. SHABESTARI,J. E. GRUZLESKIand D. J. ZULIANI:
AFS Trans., 1996, 104, 1189-1193.
2. c. H. CACERESand B. 1. SELLING:Mater. Sci. Eng. A, 1996,220, 109-116.
3. J. E. GRUZLESKI and B. CLOSSET: 'The treatment of liquid aluminum-silicon alloy', 155-157; 1990, Des Plaines, The American Foundrymen's Society.
4. J. M. BOILEAU,S. J. WEBERand R. H. SALZMAN:AFS Trans., 2001, 109,419-432.
5. T. S. PIWONKA and M. C. FLEMINGS:Trans. Metall. Soc. AIME,
1966, 236, 1157-1165.
6. D. E. J. TALBOT:Int. Metall. Rev., 1975,20, 166-184.
7. W. MICHELSand s. ENGLER: Giessereiforschung, 1989,41, 174-187.
8. J. P. ANSONand J. E. GRUZLESKI:AFS Trans., 2001, 109, 243-258.
9. S. VISWANATHAN,V. K. SIKKA and H. D. BRODY: JOM, 1992, Sept., 37-40.
10. v. K. SURI and A. J. PAUL: AFS Trans., 1993, 101,949-954. 11. J. HUANG and J. G. CONLEY:Rev. Prog. Quant. Nondestructive
Evol., 1998, 17B, 1839-1846.
12. A. S. SABAUand s. VISWANATAN:in 'Light metals 2000', 597...{j02; 2000.
13. D. R. POIRIER, P. K. SUNG and s. D. FELICELLI: AFS Trans., 2001, 109, 379-395.
14. w. H. JOHNSONand J. G. KURA: AFS Trans., 1959, 67, 532-552.
15. G. v. K. RAO and v. PANCHANATHAN: AFS Trans., 1973,88,
110-114.
16. v. L. DAVIES:AFS Cast Metals Res. J., 1975, 11, 33-44. 17. E. NIYAMAand T. A. UCHIDA:Int. Cast Metals 1., 1982, 7,
52-63.
18. Y. W. LEE, E. CHANG and c. F. CHIEU: Metall. Trans. B, 1990, 21B,
715-722.
19. E. CHANGand Y. s. KUO: AFS Trans., 1994, 102, 167-172. 20. v. K. SURI,A. J. PAUL,N. EI-KADDAHand J. T. BERRY:AFS Trans.,
1994, 102, 861-867.
21. v. K. SURI,C. CHENG,A. J. PAUL, N. EI-KADDAHand J. T. BERRY:in 'Light metals 1994', San Francisco, CA, USA; Feb-March 1994, 907-912.
22. s. T. KAO, E. CHANGand Y. W. LEE: Mater. Sci.Technol.,1995, 11, 933-938.
23. s. T. KAO and E. CHANG: AFS Trans., 1996,104,545-549. 24. Q. M. CHENand c. RAVINDRAN:AFS Trans., 2000, 108, 279-305. 25. F. PARAY,J. CLEMENTS,B. KULUNK and J. E. GRUZLESKI:Proc. 35th Annual CIM Conference on 'Light metals', Montreal, Canada, August 1996, 666...{)75.
26. F. PARAY, J. CLEMENTS,B. KULUNK and J. E. GRUZLESKI:AFS
Trans., 1997,105, 791-801.
27. W. LA-ORCHAN,M. H. MULAZIMOGLUand J. E. GRUZLESKI:AFS
Trans., 1993, 101, 253-259.
28. w. LA-oRCHAN: 'The quantification of the reduced pressure test', PhD thesis, McGill University, Montreal, Canada, Sept.
1994.
29. F. CHIESAand P. 1. REGIMGAL:AFS Trans., 2001, 109, 347-357. 30. D. R. ANDERSON,D. J. SWEENEYand T. A. WILLIAMS:'Statistics for
business and Economics 8e', 551-556; 2001, Mason, South-Western (a division of Thomson Learning).