HAL Id: hal-03085541
https://hal.inria.fr/hal-03085541
Submitted on 21 Dec 2020
HAL is a multi-disciplinary open access
archive for the deposit and dissemination of
sci-entific research documents, whether they are
pub-lished or not. The documents may come from
teaching and research institutions in France or
abroad, or from public or private research centers.
L’archive ouverte pluridisciplinaire HAL, est
destinée au dépôt et à la diffusion de documents
scientifiques de niveau recherche, publiés ou non,
émanant des établissements d’enseignement et de
recherche français ou étrangers, des laboratoires
publics ou privés.
Optimising criteria for manual smear review following
automated blood count analysis: A machine learning
approach
Marta Avalos, Hélène Touchais, Marcela Henríquez-Henríquez
To cite this version:
Marta Avalos, Hélène Touchais, Marcela Henríquez-Henríquez. Optimising criteria for manual smear
review following automated blood count analysis: A machine learning approach. Ajith Abraham; Hide
Sasaki; Ricardo Rios; Niketa Gandhi; Umang Singh; Kun Ma. Proceedings of the 11th International
Conference on Innovations in Bio-Inspired Computing and Applications (IBICA 2020) held during
December 16-18, 2020, 1372, Springer, 2021, Advances in Intelligent Systems and Computing.
�hal-03085541�
following automated blood count analysis:
A machine learning approach
Marta Avalos1,2[0000−0002−5471−2615], H´el`ene Touchais1,3, and Marcela
Henr´ıquez-Henr´ıquez4,5
1
SISTM team, INRIA BSO, F-33405, Talence, France
2 Univ. Bordeaux, INSERM, BPH U1219, F-33000 Bordeaux, France
marta.avalos-fernandez@u-bordeaux.fr
3
INP-ENSEEIHT, F-31000, Toulouse, France
4 ELSA Clinical Laboratory, IntegraMedica, part of BUPA, Santiago, Chile 5
Cardio MR, Millennium Science Initiative Program, ANID, Santiago, Chile
Abstract. The complete blood count (CBC) performed by automated haematology analysers is the most common clinical procedure in the world. Used for health checkup, diagnosis and patient follow-up, the CBC impacts the majority of medical decisions. If the analysis does not fit an expected setting, the laboratory staff manually reviews a blood smear, which is highly time-consuming. Criteria for reviewing CBCs are based on international consensus guidelines and locally adjusted to account for laboratory resources and populations characteristics. Our objective is to provide a clinical laboratory decision support tool to identify which CBC variables are linked to an increased risk of abnormal manual smear and at which threshold values. Thus, we treat criteria adjustment as a feature selection problem. We propose a cost-sensitive Lasso-penalised additive logistic regression combined with stability selection, adapted to the peculiarities of data and context: class-imbalance, categorisation of continuous predictors, required stability and enhanced interpretability. Using simulated and real CBC data, we show that our proposal is com-petitive in terms of predictive performance (compared to deep neural networks) and model selection performance (provided that there is suf-ficient data in the neighbourhood of the true thresholds). The R code is publicly available as an open source project.
Keywords: Machine Learning for Healthcare Applications· Data min-ing · Feature selection · Interpretability · Categorisation of continuous variables· Lasso · GAM.
1
Introduction
The complete blood count (CBC) with leukocyte differential count obtained by automated haematology analysers is often included as part of a routine checkup. It is one of the most ordered laboratory tests used to monitor overall health,
medical condition or medical treatment and to help detect a variety of disor-ders. When the analysis does not fit an expected setting, the machine triggers a warning flag. Then, laboratory staff manually prepares and reviews a blood smear using a microscope. The International Consensus Group for Haematology Review published in 2005 criteria for reviewing CBCs [3]. In general, adjust-ments are needed to account for local populations characteristics and laboratory resources [21, 6, 15, 2]. While the manual technique is more effective identifying nuances in cell shapes, it incurs a substantial time and cost burden on laboratory staff. Also, it requires a high degree of technical skill. There is great interest in optimising human and financial resources (i.e. minimising the number of useless reviews) whilst ensuring the quality of patient care (i.e. minimising the number of omitted useful reviews).
1.1 Motivation example
The manual smear is also used as a quality control tool to evaluate and calibrate the automated haematology analysers. Routinely, all samples (with or without a warning flag) analysed in a given period of time are reviewed to evaluate the need for adjustments in criteria for manual smear review. As a secondary use of these large-scale data we propose to train machine learning algorithms.
CBCs and corresponding blood smear reviews for 10 000 patients were per-formed at the clinical laboratory of the Pontificia Universidad Catolica de Chile in 2016 in the framework of the quality control procedure. After excluding hos-pitalised patients and patients with a non-consensual smear result, a total of 9 594 data were available. The response variable, normal/abnormal smear, is imbalanced: only 7% of the smears were abnormal.
CBC data consisted in haemoglobin (g/dL), haematocrit (%), mean cor-puscular haemoglobin (pg/cell), mean corcor-puscular volume (f L), erythrocytes (106/µL), red blood cell distribution width (%), platelets (103/µL), leukocytes (103/µL), immature granulocytes (%) and the leukocyte differential count which includes neutrophils, basophils, eosinophils, monocytes and lymphocytes (103/µL and %). The presence or absence of alarms of suspected alterations of blood cells (binary), sex (binary) and age (years) were also reported.
1.2 Objective
Machine learning tools for decision support have already been applied in the field of haematology [20, 19, 17]. However, they are essentially limited to predict a given disease onset from CBC data. We aimed to provide a machine learning based-decision support tool for adjusting abnormal levels in the CBC tests for use at laboratory level. We treated criteria adjustment as a feature selection problem, thus the objective was to identify which CBC variables are linked to an increased risk of abnormal manual smear and at which threshold values.
Our proposal is based on cost-sensitive Lasso-penalised additive logistic re-gression, which represents a trade-off between predictive performance and in-terpretability. Cost-sensitive learning and data sampling are the main methods
in imbalanced binary classification [12, 7]. The first is a better choice for large sample sizes. Weighting individuals’ contributions to account for the degree of imbalance is one of the simplest cost-sensitive approaches. Categorisation of con-tinuous variables, though not recommended, is usual in clinical studies since the analysis and results interpretation are greatly simplified. Thus, we considered additive functions to belong to the space of piece-wise constant functions. On the other hand, the natural sparsity encouraged by the Lasso penalty is combined with a stability selection procedure to enhance model stability.
2
Related work
When no prior knowledge is available to guide the choice of the categories, con-tinuous variables are typically categorised into quantiles. Also, additive models fitted by cubic splines are used as an exploratory data analysis tool [4]. Instead of using piece-wise cubic polynomials which are next transformed into constant functions, we propose to use directly piece-wise constant polynomials. A cru-cial question is how to select the optimal number and/or location of threshold values. That could be viewed as a variable selection problem. Indeed, once the basis functions have been set, we have moved from a non-linear to a linear space, so that a variable selection methods for linear settings can be used. Standard variable selection procedures have already been applied [4, 13], but only when very few quantitative predictors have to be categorised. Yet, CBC data consist in more than twenty blood cell measurements.
Penalised methods leading to parsimonious models, such as the Lasso [9], have emerged as convenient alternative approaches. Extensions to parsimonious additive models have been proposed based on a reformulation of the estimation problem in terms of group Lasso [1], sparse group Lasso, overlapping group Lasso, or fused Lasso [16]. Several R packages have been developed, e.g. COSSO, GAMBoost, SAM, GAMSEL, hgam, MSGLasso, FLAM [16]. However, these packages are limited in their capability to support the logistic model or a mixture of qualitative and quantitative predictors or piece-wise constant basis functions or to handle large data sets.
3
Method
Let (X1, . . . , Xp, Y ) be a random vector with Y a binary variable, coded 0 for
normal and 1 for abnormal blood smears. Let {(Xi1, . . . , Xip, Yi)}ni=1 be an i.i.d.
sample of size n and {(xi1, . . . , xip, yi)}ni=1 a realization of the sample. Let us
note xj= (x1j, . . . , xnj)>the vectors of size n × 1. Consider the additive logistic
model in terms of the logit function:
logit(P (Yi= 1|xi1, . . . , xip)) = ln P (Yi = 1|xi1, . . . , xip) 1 − P (Yi= 1|xi1, . . . , xip) = β0+ p X j=1 fj(xij) , (1)
where fjare unknown univariate real (centred) functions and β0is the unknown
intercept. Let {χk
j(xj)} pj
k=1 be a fixed basis of functions and denote χ k
j = χkj(xj). Any
fj can be expanded in terms of these basis functions: fj(xj) =P pj k=1β k jχkj where {βk j} pj
k=1are unknown parameters. By considering the block matrix (χ1, . . . , χp)>
and vector β = (β1, . . . , βp)>, we can write: fj(xj) = χjβj. Consider now the
particular case of piece-wise constant polynomials: χk
ij= 1 if xij > qjkand 0
oth-erwise, with qk
j the k-th value of a collection of Kj fixed values, e.g. the ordered
percentiles of Xj.
We consider the problem of estimating a high-dimensional additive model using sparse methods. The number of candidate explanatory variables could be large but only a small set of them contribute to the response. In addition, the relationships between explanatory variables and the outcome are possibly non linear. Through the logistic likelihood function, we can write the weighted penalised optimisation problem:
max β ( n X i=1 ωiln eyiPpj=1χijβj 1 + ePpj=1χijβj − λkβk1 ) , (2)
where to simplify, the intercept is omitted, λ > 0 controls the amount of regu-larisation, the weights ωi = ω > 1 if yi= 1 and 1 if yi= 0 are used to account
for the degree of imbalance in the minority class. Indeed, when facing with an imbalanced learning problem, a simple strategy consists in weighting individuals’ contributions to the likelihood function [12, 7].
3.1 Practical implementation
The lasso estimator bβ that maximises (2) depends on λ and ω. When the pri-mary goal of the study is prediction, K-fold cross-validation (e.g. based on the area under the receiver operating characteristic curve - ROC AUC) is routinely applied to estimate λ. When the primary goal is to infer the set of truly rele-vant variables, the combination of cross-validation with stability selection [14] is a better option [23]. The stability selection procedure calculates the empirical selection probability for each χk
j, that we use as a continuous measure of the
stability associated to the Lasso estimates.
Class weighting can be determined on the basis of expert judgement, using the inverse of the empirical class distribution in the learning data, or evaluating a performance criterion on a grid of ω-values with test data. We applied the following heuristic as a previous step: we determined a grid of ω-values around the inverse of the observed class distribution, the optimal value of ω was that maximising the cross-validated ROC AUC under the constraint that recall can-not be inferior to a given fixed value (to be determined by laboratory clinicians, 0.85 here).
To avoid overoptimistic results, we implement cross-validation with stratified folds (i.e. each fold contains roughly the same proportion of abnormal smears as in the whole sample) and using weights only in the training step [11].
Fig. 1. Retained NN architecture.
We developed a simple R function to construct features based on percentiles for each variable. Equation (2) and ROC AUC cross-validation can be resolved by calling the R glmnet package [8]. Another R function allows to visualise the Lasso estimates and corresponding selection probabilities represented by a light to dark gradient of grey.
4
Evaluation
The purpose of this evaluation was manifold, we aimed to answer the following questions:
– Is the predictive performance of our model comparable to that of powerful models such as deep neural networks (NN), which explore a larger nonlinear feature space?
– Is our procedure able to detect relevant predictors and relevant thresholds? – Could our procedure provide sound and informative findings?
To answer these questions we used real CBC data which also served as the core of a simulation study.
4.1 Predictive performance: Lasso VS NN
We developed a NN (Fig. 1). The 22 predictor variables were the input vari-ables and it returned the probability of abnormal smear as output. Continuous
variables were previously standardised and non-linearly transformed into the network. To account for class imbalance, we adopted again the weighting strat-egy [10]. The NN was trained in 100 epochs using cross entropy as loss function. Other options were evaluated but only the architecture providing the best per-formance is presented. The NN model was implemented in Python with Keras.
We split the real data into 20 stratified folds. We iteratively fitted the weighted logistic Lasso and NN with the data from 19 folds and calculated precision, recall, specificity, ROC AUC and the area under the precision-recall curve (PR AUC) on the remainder fold. The weight ω was set to 20 for both of the methods.
4.2 Detection of relevant predictors and thresholds
We performed a simulation study: the input data matrix and the features χj, were those defined by the original CBC data, ensuring the same structure. Y was generated from the features, assuming the logistic model. We considered 4 scenarios. In scenarios #1 and #2, among 19 blood cell measurements, two were relevant. They showed low correlation. In scenarios #3 and #4, five predictors were relevant. They showed moderate to high correlation between them and low correlation with all the other variables.
One βjk per relevant variable was non-zero (all set to 1.4). They were chosen such that thresholds were located: at the extreme percentiles (in #1 and #4), where observations are sparse or at not-extreme percentiles (in #2 and #3), where observations are frequent. β0was calibrated such that 7% of smears were
abnormal.
For each scenario, Y was generated 100 times, then selection probabilities were estimated by the Lasso with stability selection.
4.3 Applicability of the procedure
Finally, we illustrate how the proposed procedure could help laboratory clinicians to make decisions about fine-tuning abnormal levels. The Lasso estimates are graphically presented. A light to dark gradient of grey represent the selection probability estimated from stability selection: the more the estimation is dark, the more stable the results are. Clinicians could explore at which values the data show a probable change in the risk of abnormal smear compared to the recommended threshold values and thus adjust the local criteria.
5
Results
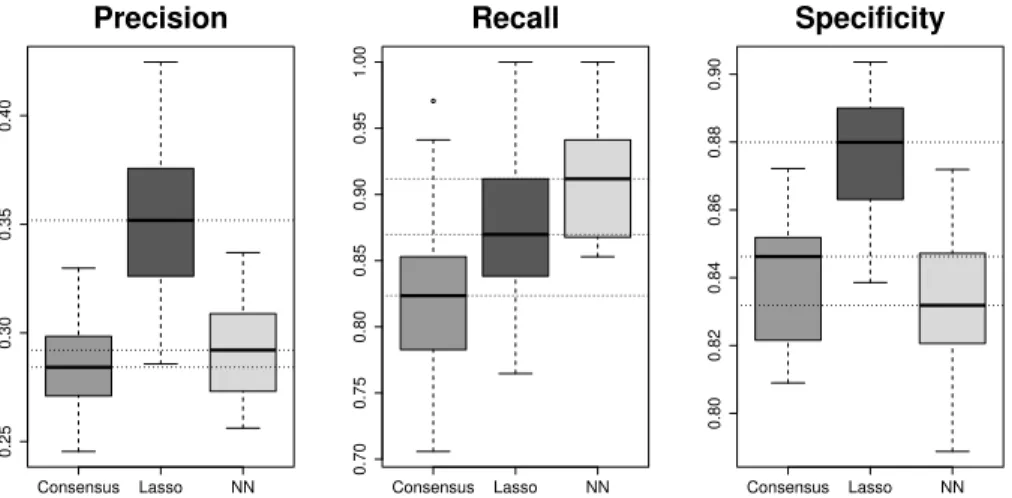
Figures (2)-(3) present predictive performance results of the Lasso compared to Deep neural network. NN presented very high recall values and performed slightly better than the Lasso. Inversely, the Lasso presented the best precision and specificity values. As a consequence, ROC and PR AUC were comparable and high in both cases. The consensus criterion led to inferior results in terms of precision and recall.
Consensus Lasso NN 0.25 0.30 0.35 0.40 Precision Consensus Lasso NN 0.70 0.75 0.80 0.85 0.90 0.95 1.00 Recall Consensus Lasso NN 0.80 0.82 0.84 0.86 0.88 0.90 Specificity
Fig. 2. Predictive performance. The boxplots represent distributions over the 20 vali-dations sets from real CBC data. Dashed horizontal lines are plotted at median values.
Table (1) shows simulation study results. When the true features were cor-related and located at the extreme percentiles (#4), targets were often missed. The five true values were correctly identified in 14%-57% of the cases. Indeed, the relevant predictors, being redundant, may not be simultaneously selected. When the true thresholds have to be learn from sparse observations but rel-evant predictors are not correlated, neither among themselves nor with noisy variables (#1), the true values were were correctly identified in 52%-68% of the cases. In scenarios #2 and #3, relevant predictors were very frequently selected (more than 90% on average). Interestingly, values surrounding the true thresh-olds are more often selected than distant values. This could explain that the true threshold is not selected more often than about 90%. Noisy variables were rarely selected.
Figure (4) shows Lasso estimates in terms of variation of OR. By convention, we choose the reference category as the one with lowest coefficient estimate. The variations of OR can thus be interpreted as OR increments. The selection probability estimated from stability selection is represented by the intensity of
Table 1. Selection probability (%) obtained by stability selection combined with the Lasso in the four scenario simulations. Values correspond to the range of mean proba-bilities (over 100 simulations) for relevant and irrelevant predictors and thresholds.
Scenarios
Predictors and thresholds #1 #2 #3 #4 Relevant 52%-68% 90%-91% 91%-92% 14%-57% Noisy 1%-15% 0%-3% 0%-11% 0%-4%
Lasso NN 0.90 0.94 0.98
ROC AUC
Lasso NN 0.60 0.70 0.80PR AUC
Fig. 3. Predictive performance. The boxplots represent distributions over the 20 vali-dations sets from real CBC data. Dashed horizontal lines are plotted at median values.
the grey colour. Green lines (with arrows indicating the direction) indicate new thresholds suggested by the Lasso estimates.
The consensus recommendation (in blue) is sometimes close to those sug-gested by the Lasso, e.g. mean corpuscular volume, or this seems to be enough, given the incertitude around the lasso estimates, e.g. neutrophils as counts and the superior threshold of lymphocytes as counts. Other times, the Lasso esti-mates suggest thresholds more conservative (i.e. leading to more smear reviews) than those of the consensus, e.g. haemoglobin, mean corpuscular haemoglobin, platelets, red blood cell distribution width and basophils as counts (for the later, the recommended threshold is greater than the observed values). In addition, a threshold seems to be relevant in some cases in which no recommendation exists, e.g. immature granulocytes, lymphocytes as percentage and the inferior limit of lymphocytes as counts. Inversely, some consensus thresholds seems to be useless, e.g. monocytes as counts and the inferior thresholds of leukocytes.
The presence of a machine alarm as well as mean corpuscular volume higher than 106f L appear to be stable strong predictors of abnormal smear. Red blood cell distribution width-CV higher than 16% and lymphocytes higher than 51% appears to be strongly associated with the presence of abnormal smear. In the case of lymphocytes this association is stronger and stable for values higher than 71%.
6
Discussion
In this paper we propose an machine learning tool to fine-tune abnormal levels in the CBC tests from data routinely produced in the internal laboratory quality control. This procedure, tailored to the particularities of the data, represents a non-linear baseline for a variety of tasks and could be of high importance for resource constrained environments. Offsetting imbalance by a weight appears to be an intuitive solution. In addition, the automatic choice of variables, as well as
5 10 15 20 1.0 2.0 Hemoglobin ( gr / dL ) ∆ OR 20 30 40 50 60 70 1.0 2.0 Hematrocr it (%) ∆ OR 30 35 40 45 50 55 60 1.0 2.0 Mean cor puscular hemoglobin ( gr / dL ) ∆ OR 60 80 100 120 140 160 1 2 3 4 Mean cor puscular v olume ( fl ) ∆ OR 2 3 4 5 6 7 8 1.0 2.0 Er ythrocyte ( 10 6 / m m 3 ) ∆ OR 15 20 25 30 0 4 8 12 Red b
lood cell distr
ib ution width − CV (%) ∆ OR 100 200 300 400 500 600 1.0 2.0 Platelets ( 10 3 / uL ) ∆ OR 5 10 15 1.0 2.0 Leuk ocytes ( 10 3 / m m 3 ) ∆ OR 0.0 0.5 1.0 1.5 2.0 1.0 2.0 Immature Gr an ulocytes (%) ∆ OR 0 2 4 6 8 10 12 1.0 2.0 Neutrophils ( 10 3 / m m − 3 ) ∆ OR 20 40 60 80 1.0 2.0 Neutrophils (%) ∆ OR 0.00 0.02 0.04 0.06 0.08 0.10 0.12 1.0 2.0 Basophils ( 10 3 / m m 3 ) ∆ OR 0.0 0.5 1.0 1.5 2.0 1.0 2.0 Basophils (%) ∆ OR 0.0 0.2 0.4 0.6 0.8 1.0 1.0 2.0 Eosinophils ( 10 3 / m m 3 ) ∆ OR 0 2 4 6 8 10 12 14 1.0 2.0 Eosinophils (%) ∆ OR 0.5 1.0 1.5 1.0 2.0 Monocytes ( 10 3 / m m 3 ) ∆ OR 5 10 15 20 1.0 2.0 Monocytes (%) ∆ OR 2 4 6 8 1.0 2.0 L ymphocytes ( 10 3 / m m 3 ) ∆ OR 10 20 30 40 50 60 70 0.5 1.5 2.5 3.5 L ymphocytes (%) ∆ OR 0.0 0.2 0.4 0.6 0.8 1.0 0 1 2 3 4 Machine alar m ∆ OR
Fig. 4. Lasso estimates of the real CBC data in terms of variation of the OR. The light to dark gradient of grey indicates the selection probability estimated by stability selection: the darker, the more stable. Normal observations are indicated in black and the abnormal ones in red. The recommended thresholds [3] are indicated by blue lines). Green lines indicate new thresholds suggested by the Lasso estimates.
their functional form, can be managed by additive models with a penalty encour-aging sparsity. Indeed, this corresponds to automatising the common practice of categorisation in the biomedical field. On the other hand, the practical imple-mentation is simplified since standard efficient R packages that resolve the plain Lasso could be applied. Our proposal is close to existing approaches [1, 16]. Nev-ertheless, by choosing the piece-wise constant function basis, that conveniently categorises CBC data, interpretation, estimation, and computational issues are substantially simplified. This simplicity allows us to consider the extension to more complex models as a perspective, for instance, by including pairwise inter-actions between blood cell measures and age and sex.
As expected, deep neural network outperformed the Lasso in terms of recall. Indeed, the Lasso explores a reduced feature space compared to neural networks. Both approaches showed high values, though (the median (SD) recall values were 0.91 (0.04) and 0.87 (0.06) for deep neural network and the Lasso, respectively). This is all the more important since errors inherent to the subjectivity of manual blood smear tend to be biased: in case of doubt, the result of the worst case is assumed. Thus, a fraction of manual smears labelled as abnormal may actually be normal, potentially inflating false negative results. The Lasso presented the best precision and specificity. The weighting may have a greater impact on the neural network to the detriment of its specificity and its precision (by overes-timating positives). The consensus criterion led to inferior results in terms of both, precision and recall.
AUC scores, balancing recall and precision/specificity, were comparable for NN and the Lasso. By means of recall and specificity, ROC AUC accounts for both true positives and true negatives, while PR AUC focuses on positives i.e. the minority class. Thus, PR AUC is recommended for predictive performance eval-uation in imbalanced classification [18]. However ROC AUC is well-established in biomedical and other disciplines since easier to interpret [5]. We used ROC and PR AUC for evaluation but only ROC AUC to tune hyperparameters. A future perspective is the exploration of the PR AUC for hyperparameter tuning. A wide variety of methods whose non-linearity/complexity lies somewhere between Deep neural networks and logistic regression exists. However, our goal was not to find the best prediction method, but to show that the proposed simple approach doesn’t imply an important deterioration of the predictive per-formance.
The simulation study showed that our procedure was able to detect true thresholds with high probability provided that enough data are available in the thresholds’ neighbourhood. On the other hand, the conclusions arisen from the visualisation of Lasso estimates and their relative importance are sound and relevant for a particular clinical laboratory [22]. They generalise neither to other machines nor to other populations. However, the procedure itself appears to be an useful tool for decision support at laboratory-level. Our R code to implement it is publicly available on request from the corresponding author.
More standard measures of uncertainty are confidence intervals and p-values. Some R packages allow to compute these measures for high-dimensional data
with binary response. However, we failed to use them with our CBC data. Al-ternatively, we implemented resampling-based percentile confidence intervals. Nevertheless, their coverage rate was poor and thus we don’t recommend their use.
From the perspective of an extended decision-making tool, it would be in-teresting to provide a deeper analysis of errors, for example using as outcome the agreement/disagreement between manual smear and CBC results accord-ing to the locally fine-tuned thresholds. This approach would allow to directly deal with the question of how to decrease laboratory burden by reducing useless microscopic reviews.
Acknowledgements
The calculations were carried out on the CURTA cluster of MCIA (Mesocenter for Intensive Calculation in the Aquitaine French region).
We would like to thank:
– C.S. Ong (Data61, CSIRO, Canberra) and A.K. Menon (currently, Google, New York, formerly, Data61, CSIRO) for sharing their knowledge on imbal-anced classification,
– T. Quiroga (Department of Clinical Laboratories, School of Medicine, the Pontifical Catholic University of Chile, Santiago) for advice and data con-tribution,
– E. Lagarde, L. Bourdois and J. Naredo (the “deep learning guys” from In-serm BPH U1219, France) and A. Carlier (INP-ENSEEIHT) for sharing their experience in implementing deep learning methods,
– A. Rouanet (Inserm BPH U1219, France) for assistance in using the CURTA cluster.
References
1. Amato, U., Antoniadis, A., De Feis, I.: Additive model selection. Stat Methods Appl 25, 519–564 (2016)
2. Baccini, V., Genevi`eve, F., Jacqmin, H., Chatelain, B., Girard, S., Wuilleme, S., Vedrenne, A., Guiheneuf, E., Toussaint-Hacquard, M., Everaere, F., Soulard, M., Lesesve, J.F., Bardet, V.: Platelet counting: Ugly traps and good advice. proposals from the French-Speaking Cellular Hematology Group (GFHC). J Clin Med. 9(3), 808 (2020)
3. Barnes, P., McFadden, S., Machin, S., Simson, E.: The international consensus group for hematology review: suggested criteria for action following automated CBC and WBC differential analysis. Lab Hematol. 11, 83–90 (2005)
4. Barrio, I., Arostegui, I., Rodriguez-Alvarez, M., Quintana, J.M.: A new approach to categorising continuous variables in prediction models: Proposal and validation. Stat Methods Med Res. 26(6), 2586–2602 (2017)
5. Carrington, A., Fieguth, P., Qazi, H., Holzinger, A., Chen, H., Mayr, F., Manuel, D.: A new concordant partial auc and partial c statistic for imbalanced data in the evaluation of machine learning algorithms. BMC Med Inform Decis Mak. 20(1) (2020)
6. Comar, S.R., Malvezzi, M., Pasquini, R.: Evaluation of criteria of manual blood smear review following automated complete blood counts in a large university hospital. Rev Bras Hematol Hemoter. 39(4), 306–317 (2017)
7. Fernandez Hilario, A., Garcia Lopez, S., Galar, M., Prati, R., Krawczyk, B., Her-rera, F.: Learning from Imbalanced Data Sets. Springer, Cham, Switzerland (2018) 8. Friedman, J., Hastie, T., Tibshirani, R.: Regularized paths for generalized linear
models via coordinate descent. J Stat Softw. 33, 1–22 (2010)
9. Hastie, T.J., Tibshirani, R.J., Wainwright, M.: Statistical Learning with Sparsity. Chapman and Hall/CRC, New York (2015)
10. Johnson, J., Khoshgoftaar, T.: Survey on deep learning with class imbalance. J Big Data 6 (2019)
11. Kong, J., Kowalczyk, W., Nguyen, D., B¨ack, T., Menzel, S.: Hyperparameter op-timisation for improving classification under class imbalance. In: 2019 IEEE sym-posium series on computational intelligence (SSCI). pp. 3072–3078 (2019) 12. Leevy, J., Khoshgoftaar, T., Bauder, R., Seliya, N.: A survey on addressing
high-class imbalance in big data. J Big Data 5 (2018)
13. Liquet, B., Riou, J.: CPMCGLM: an R package for p-value adjustment when look-ing for an optimal transformation of a slook-ingle explanatory variable in generalized linear models. BMC Med Res Methodol 19(1), 79 (2019)
14. Meinshausen, N., B¨uhlmann, P.: Stability selection. J. R. Stat. Soc. Ser. B Methodol. 72(4), 417–473 (2010)
15. Palur, K., Arakeri, S.U.: Effectiveness of the International Consensus Group crite-ria for manual peripheral smear review. Indian J Pathol Microbiol. 61(3), 360–365 (2018)
16. Petersen, A., Witten, D.: Data-adaptive additive modeling. Stat Med. 38(4), 583–600 (2019)
17. Radakovich, N., Nagy, M., Nazha, A.: Artificial intelligence in hematology: Current challenges and opportunities. Curr Hematol Malig Rep. 15(3), 203–210 (2020) 18. Saito, T., Rehmsmeier, M.: Precrec: fast and accurate precision-recall and ROC
curve calculations in R. Bioinformatics 33(1) (2017)
19. Shouval, R., Fein, J.A., Savani, B., Mohty, M., Nagler, A.: Machine learning and artificial intelligence in haematology [published online ahead of print, 2020 Jun 30]. Br J Haematol. (2020)
20. Sivapalaratnam, S.: Artificial intelligence and machine learning in haematology. Br J Haematol. 185(2), 207–208 (2019)
21. Trimoreau, F., Galoisy, A.C., Genevi`eve, F., Bardet, V., Cornet, E., Hurst, J.P., Lesesve, J.F., Leymarie, V., Lusina, D., Perez, B., Cahn, J.Y., Damaj, G., Ugo, V., Troussard, X.: Harmonisation of full blood count reports, recommendations of the French-speaking cellular haematology group (GFHC). J Clin Pathol. 70(5), 395–402 (2017)
22. Vellido, A.: The importance of interpretability and visualization in machine learn-ing for applications in medicine and health care. Neural Comput Appl. pp. 1–15 (2019)
23. Wang, F., Mukherjee, S., Richardson, S., Hill, S.M.: High-dimensional regression in practice: an empirical study of finite-sample prediction, variable selection and ranking. Stat Comput. 30(3), 697–719 (2020)