HAL Id: inserm-00133071
https://www.hal.inserm.fr/inserm-00133071
Submitted on 26 Feb 2007
HAL is a multi-disciplinary open access
archive for the deposit and dissemination of
sci-entific research documents, whether they are
pub-lished or not. The documents may come from
teaching and research institutions in France or
abroad, or from public or private research centers.
L’archive ouverte pluridisciplinaire HAL, est
destinée au dépôt et à la diffusion de documents
scientifiques de niveau recherche, publiés ou non,
émanant des établissements d’enseignement et de
recherche français ou étrangers, des laboratoires
publics ou privés.
A Visual Computer Tool for Percutaneous
Nephrolithotomy Preoperative Planning
Jean-Louis Dillenseger, Philippe Rolland, Jean-Jacques Patard
To cite this version:
Jean-Louis Dillenseger, Philippe Rolland, Jean-Jacques Patard. A Visual Computer Tool for
Percu-taneous Nephrolithotomy Preoperative Planning. 25th conf. of the IEEE Engineering in Medicine
and Biology Society, 2003, Cancun, China. pp.1141-1144, �10.1109/IEMBS.2003.1279450�.
�inserm-00133071�
1 of 3
Abstract— The percutaneous nephrolithotomy is a minimally invasive surgery that is employed to remove larger stones (calculi) in the kidney. This technique places a nephroscope into the kidney through a small tract set after a small incision in the patients back. During the tract positioning, there are risks of kidney bleeding and of injury of other organs near the kidney such as the bowels, spleen or lever. In order to minimize this risks a preoperative planning helps for the choice of the best kidney calyx target and for the definition of the optimal track to reach this target. Our study is focused on the development of a computer tool that will help establishing the preoperative planning on patient specific data. Especially, this tool allows defining interactively and visually the optimal track on a 3D volume data acquired on the patient, simulating the effect on the anatomy of the real passageway and finally gives the necessary information back to the surgeon in order to transpose during the intervention the defined optimal track.
Keywords— Kidney, minimally invasive surgery, percutaneous nephrolithotomy, preoperative planning, visualization
I. INTRODUCTION
Kidney stones (calculi) are crystalline aggregates of substances that are found in solution in urine. The more concentrated these crystallizable substances become in the urine, the more likely some of this substance will fall out of solution and form into a stone. A lodged stone can block the flow of urine, causing pressure to build in the affected ureter and kidney. Increased pressure results in stretching and spasm, which cause severe pain.
Treatment depends on the size and type of stones. Shock-wave lithotripsy, also know as Extracorporeal ShockShock-wave Lithotripsy is the most non-invasive common surgical treatment for kidney stones. It works by using shock waves that are generated outside the body and then focused on a kidney stone using x-rays to break up the stone. Since most Shock-wave lithotripsy machines rely on x-rays to see and localize the kidney stone, it can be difficult (or impossible) to treat stones that cannot be seen with x-rays. On the other hand, some patients with large kidney stones or staghorn calculi (large stones with branches) might benefit from another treatment option: a surgical procedure called a percutaneous nephrolithotomy (PCNL). This procedure is done under a general anesthetic. The surgeon uses the x-ray equipment to guide a small needle into the kidney. Once the surgeon is sure that the puncture is in a satisfactory position,
a guide wire can be placed in the kidney, through the needle. This then enables larger tubes to be placed correctly, over the wire, so that a suitable passageway, or track, is created between the skin and the part of the kidney next to the stone. The urologist is then able to pass a telescope, called a nephroscope, down the track and actually see the stone. Through this nephroscope various instruments can be inserted to break up and remove all the stones.
Although this procedure has been proven to be safe, as in any surgical procedure there are risks and potential complications. Blood loss during this procedure is possible. Especially when the needle or the tube injures main renal vascular branches. During the needle positioning, there is also a small risk of injury of other organs near the kidney such as the bowels, spleen or lever. The surgical procedures minimizing both risks is based on a puncture that reaches the posterior surface of the lower renal pole (usually this area is free from main vascular branches) and crosses as little parenchyma as possible directly into a renal calyx. The definition of such an ideal trajectory of the puncture is not so easy. Firstly, the inter-individual morphological variation of the kidneys is very large; secondly the PCNL preoperative planning is usually defined on a classical excretory urography. This radiological technique, which involves the injection intravenously of a contrast medium, allows to demonstrate the urinary tract (calyces, renal pelvis and ureters). But as all the classical X-Ray radiographies, this technique gives only a poor idea about the three-dimensional (3D) orientations of the calices and so is only a little help for the preoperative planning.
The main goal of our study is to provide a support during the preoperative planning for the choice of the best target calyx and for the definition of the optimal track to reach this target. For this, our study is focused on the development of a computer tool allowing establishing the preoperative planning on patient specific data. Especially, this tool should allow defining the optimal track on a 3D volume data acquired on the patient, simulating the effect on the anatomy of the real passageway and finally give the necessary information back to the surgeon in order to transpose during the intervention the defined optimal track.
A Visual Computer Tool for Percutaneous
Nephrolithotomy Preoperative Planning
J.-L. Dillenseger
1, P. Rolland
1, J.-J. Patard
21Laboratoire Traitement du Signal et de L’Image, INSERM EMI 99-34, Université de Rennes 1, Rennes, France
2 Service d’Urologie, Hôpital de Pontchaillou, CHR Rennes, Rennes, France.
2 of 3
II. MATERIALS AND METHODOLOGY
The preoperative planning is established on Spiral CT Urography [1]. The classical CT Urography is a succession of 3 or 4 CT acquisitions of the abdomen, the first performed with no intravenous contrast, the two or three next after an intravenous bolus contrast medium injection. These later acquisitions are divided within an arterial phase (5 second after infection), a venous or paremchymal phase (100 second post injection) and the excretory urography (5 to 10 minute after infection). The arterial and venous phase can be combined within a vascular phase by performing only one acquisition a few seconds after injection. Each phases provides its own collaborative interest for the planning of a percutaneous nephrolithotomy [2]. The no-contrast acquisition reveals the position of the calculi within the kidney; the vascular phase enhances the kidney parenchyma and the position of the vascular main branches where the excretory urography shows the anatomy of the urinary tract (cortexes, renal pelvis, calyces and ureter) within and outside the kidney. The fusion of these several information should be a useful help to define the intervention field. However, the accurate matching of the several acquisitions is still an open challenge. In our case, the most helpful data is provided by the excretory urography. This modality shows clearly the spatial conformation of the urinary tract, especially in our case the position and orientation of the calyces inside the kidney lower pole. It also gives all the other morphological information about the kidney position and orientation within the body. This modality will so serve as the morphological framework of the preoperative planning.
The planed computer tool has to answer to the several goals exposed previously:
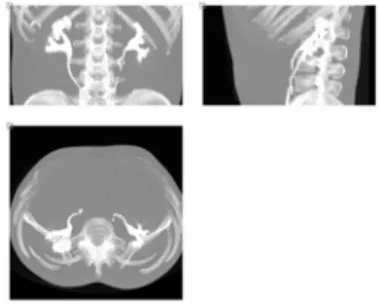
- Loading and visioning the data. The data are on
DICOM format that gives all the necessary information for recovering the volume (slice position, pixel size, inter-slide spacing, etc.). The volume can then be visualized in a classical manner (slices) and also on three perpendicular slices or three perpendicular Maximal Intensity Projections (MIP) (fig. 1).
Fig. 1. MIPs of the excretory urography.
The three perpendicular slices view gives an easy manner to navigate within the volume grasping the 3D topology of the anatomical structure especially near the cross sections of the three slices (fig. 2).
Fig. 2 Three perpendicular slices view.
- Defining the trajectory of the puncture. This trajectory
is simply characterized by two specific points, one point within the selected target calyx and the other being the body entrance point. 1) The interactive choice of the target calyx is performed on the MIPs and/or by navigating within the volume on the perpendicular slices. This navigation helps to understand the kidney topology and so to choice the most plausible calyx (fig. 2). 2) The visual estimation of the orientation of that calyx on the perpendicular slices gives a rough idea of the orientation of the puncture. The surgeon can so set an approximate position of the entrance point.
- Trajectory visioning. The goal of this visualization is to
exhibit the several structures crossed by the puncture needle. Using the same idea as the three perpendicular slices for grasping the 3D topology, we propose a pair of perpendicular views collinear to the previous needle puncture trajectory (fig. 3).
X
Z Y
D A
Fig. 3 Trajectory centered views.
Data loading and visioning Trajectory definition Trajectory visioning Trajectory refining Trocar simulation Trocar back information
The first plane is defined by the trajectory axis and the longitudinal patient axis (fig. 4). This view allows following the needle puncture trajectory within the patients body. It also helps to estimate the longitudinal orientation of the needle trajectory relative to this of the target calyx.
Fig. 4 Trajectory in the longitudinal plane.
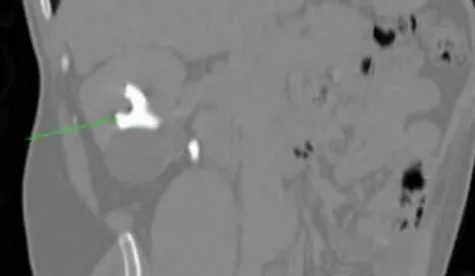
The second plane is orientated by the needle trajectory but perpendicular to the first one. The trajectory is centered in the middle of the image. The image exhibits 3 cm of the anatomy here and there of the trajectory (fig. 5). Because the trajectory is centered within this image, the surgeon has so a better overview of the anatomical structures that will be pierced by the needle. In order to give some additional information to the surgeon, the thicknesses in cm of the several anatomical layers are displayed under the view. These thicknesses are computed using boundary detection operators sliced along the puncture trajectory. The surgeon gets an idea of the difficulties of his intervention, some anatomical structures (like muscles) being harder to puncture than others (like fat).
Fig. 5 Trajectory in the perpendicular plane.
- Refining the trajectory of the puncture. As described
previously, the first trajectory has only been roughly estimated. The user can refine interactively this trajectory by modifying the position of the entrance point on the three perpendicular slices views. All the visualization views are instantaneously refreshed allowing real time acting on the trajectory definition. This interactive handling allows for example to align visually the trajectory to the calyx orientation.
- Trocar simulation. During the surgical procedure, after
the puncture, the passageway to the calyx is dilated over the wire up to a 10 mm aperture set by a trocar. It is surgeon interest to estimate the trocar size relatively to the crossed structures. The final trocar is simulated within the patient data in order to assess its size in the body (fig. 6). In our case, the trocar is pixelized in the
voxel volume data. The voxels where the tube is located tube are set to a high Hounsfield value simulating the steel and the voxels located in the hollow are set to the Hounsfield value describing air. The values of the voxels on the trocar boundary are calculated by oversampling simulating so the partial volume effect.
Fig. 6 Trocar simulation.
- Back information to the surgeon. The trajectory of the
puncture is now defined and expected to be as ideal as possible. The trocar simulation has corroborated this intuition. On this time point the surgeon needs now all the information that will help him to achieve the planed surgical process. One critical issue is to carry back, on the real patient, the entrance point position defined during the preoperative planning. This can be done in several manners. In a first stage, we choose to display the entrance point on the 3D reconstructed volume of the patient. The surgeon can so see the puncture entrance position relatively to the back skin of the patient or to some anatomical landmarks. We propose three different and complementary ways to show the planed surgical process. All this three ways are based on a Ray Casting visualization tool that allows to exhibit several kind of information and to explore 3D medical image volumes by direct investigation of the original dataset without any prior segmentation [3]. The first 3D visualization view is a simple surface rendering of the back skin of the patient in the same position as he wood lay on the operation table. The trocar position is visible on the patient back (fig. 7).
Fig. 7 Surface rendering of the back.
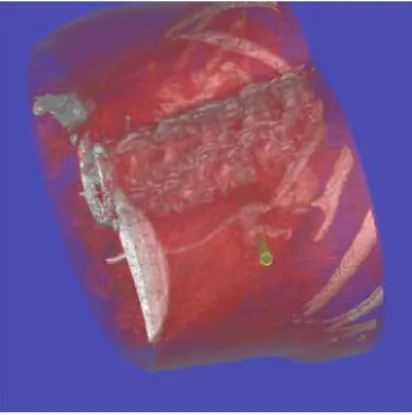
4 of 3 On the second kind of view the patient is on the same
place as previously but the inner organs can be seen in transparency by help of an adapted volume rendering technique (fig. 8). The position of the tube relatively to the bones is easily noticeable. This picture reveals also the tube orientation relatively the urinary tract.
Fig. 8 Volume rendering of the back.
The third kind of view is on the class of the non-realistic rendering techniques where non-non-realistic signs reinforce the pertinent information [4]. In our case, the entrance point should be located on the skin relatively the anatomical structures distinguishable from outside the pelvis upper crest, the ribs and the spine. On the third surface rendered view (fig. 9), these structures are projected and colored on the skin of the patient. We use an axial projection in order to display the structures on the skin just over them.
Fig. 9 Surface rendering with the projection of the anatomical landmarks (pelvis, spine and ribs).
III. DISCUSSION
The visual computer tool is a first step that will help the surgeon to draw up his surgical strategy. With this tool he is able to define a puncture trajectory adapted on the patient and optimal in the sense of minimizing the operative risks. The main gains of this tool are that it is conducted on patient specific data and that, due to its high interactivity level, it
allows the surgeon to explore the several operative possibilities. This tool begins to be employed in a clinical context and will so benefit from the surgeon feedback for further upgrades or from the development of new functionalities. The first requests are related to more quantitative information. Some efforts have been achieved by integrating structures thickness along the needle but they are still some needs especially on the localization of the puncture entrance point. This will be done by giving the distance in cm of the chosen entrance point relatively to the external landmarks. These landmarks could be the spinous process of a specific vertebra, the iliac crest or the ribs end. However this distances should be estimated over the back curvatures like the trajectory taken by a tape measure. The next stage is the transfer of the planed optimal trajectory within the operative context. The tool will so be confronted to the still open pre-operative and intra-operative fusion problems (registration, fusion, image guided surgery, etc.).
IV. CONCLUSION
In this paper we presented the several component of a visual computer tool for the percutaneous nephrolithotomy preoperative planning. This tool allows defining interactively on patient specific spiral CT urographies the puncture trajectory that would minimize the future operative risks. This planning tool gives also some information back to the surgeon in order to transpose during the surgery the defined optimal track.
REFERENCES
[1] C. F. Heyns and W. F. van Gelderen, "Three-dimensional computed tomographic imaging of the pelvicaliceal system: analysis of factors influencing image quality," Eur Urol, vol. 22, pp. 298-302, 1992. [2] P. A. Smith, F. F. Marshall, and E. K. Fishman, "Spiral computed
tomography evaluation of the kidneys: state of the art," Urology, vol. 51, pp. 3-11, 1998.
[3] J.-L. Dillenseger, C. Hamitouche, and J.-L. Coatrieux, "An integrated multi-purpose ray tracing framework for the visualization of medical images," in 13rd conf. of the IEEE Engineering in Medicine and
Biology Society. Orlando, 1991, pp. 1125-1126.
[4] P. Rheingans and D. Ebert, "Volume illustration: nonphotorealistic rendering of volume models," IEEE trans. on Visualization and
Computer Graphics, vol. 7, pp. 253-264, 2001.