Publisher’s version / Version de l'éditeur:
Noise Control Engineering Journal, 42, 6, pp. 203-208, 1994-11
READ THESE TERMS AND CONDITIONS CAREFULLY BEFORE USING THIS WEBSITE. https://nrc-publications.canada.ca/eng/copyright
Vous avez des questions? Nous pouvons vous aider. Pour communiquer directement avec un auteur, consultez la première page de la revue dans laquelle son article a été publié afin de trouver ses coordonnées. Si vous n’arrivez pas à les repérer, communiquez avec nous à [email protected].
Questions? Contact the NRC Publications Archive team at
[email protected]. If you wish to email the authors directly, please see the first page of the publication for their contact information.
NRC Publications Archive
Archives des publications du CNRC
This publication could be one of several versions: author’s original, accepted manuscript or the publisher’s version. / La version de cette publication peut être l’une des suivantes : la version prépublication de l’auteur, la version acceptée du manuscrit ou la version de l’éditeur.
Access and use of this website and the material on it are subject to the Terms and Conditions set forth at
Annoyance caused by constant-amplitude and amplitude- modulated
sounds containing rumble
Bradley, J. S.
https://publications-cnrc.canada.ca/fra/droits
L’accès à ce site Web et l’utilisation de son contenu sont assujettis aux conditions présentées dans le site
LISEZ CES CONDITIONS ATTENTIVEMENT AVANT D’UTILISER CE SITE WEB.
NRC Publications Record / Notice d'Archives des publications de CNRC:
https://nrc-publications.canada.ca/eng/view/object/?id=3d96d02f-d432-4c97-a097-ec62a5f592e4 https://publications-cnrc.canada.ca/fra/voir/objet/?id=3d96d02f-d432-4c97-a097-ec62a5f592e4http://www.nrc-cnrc.gc.ca/irc
Annoya nc e c a use d by c onst a nt -a m plit ude a nd a m plit ude - m odula t e d
sounds c ont a ining rum ble
N R C C - 3 8 8 0 6
B r a d l e y , J . S .
N o v e m b e r 1 9 9 4
A version of this document is published in / Une version de ce document se trouve dans:
Noise Control Engineering Journal, 42, (6), pp. 203-208, November, 1994
The material in this document is covered by the provisions of the Copyright Act, by Canadian laws, policies, regulations and international agreements. Such provisions serve to identify the information source and, in specific instances, to prohibit reproduction of materials without written permission. For more information visit http://laws.justice.gc.ca/en/showtdm/cs/C-42
Les renseignements dans ce document sont protégés par la Loi sur le droit d'auteur, par les lois, les politiques et les règlements du Canada et des accords internationaux. Ces dispositions permettent d'identifier la source de l'information et, dans certains cas, d'interdire la copie de documents sans permission écrite. Pour obtenir de plus amples renseignements : http://lois.justice.gc.ca/fr/showtdm/cs/C-42
'Annoyance
caused by constant-amplitude and amplitude-modulated
sOllnds
containing rumble
"
John S. Bradley")
(Received 1994 July 05; revised 1994 October 05)
This paper reports the results of an initial experiment to evaluate the additional annoyance caused by varying amounts of low-frequency rumble sounds from heating, ventilating, and air conditioning (HVAC) systems. HVAC noises were simulated with various levels of low-frequency sound and varying amounts of amplitude modulation of the low-frequency components. SUbjects listened to the test sounds over headphones and adjusted the level of the test sounds to be equally annoying as a lixed neutral reference sound. The results indicated that annoyance is inlluenced by both the level and the amplitude modulation of the simulated HVAC rumble sounds. A procedure that incorporates these two factors Is suggested for predicting the additional annoyanceofHVAC sounds containing rumble. © 1994 Institute of
Noise Control Engineering.
Primary subject classification: 69.1, Secondary subject classification: 51.6
1. INTRODUCTION
Modern heating, ventilating, and air conditioning (HVAC) systems frequently produce noise with prominent low-frequency components. Such sounds are said to contain rumble. In many cases the level of this low-frequency sound may fluctuate over time. It is often suggested that such strong low-frequency sounds and the amplitude modu-lation of these sounds may cause greater annoyance than sounds with more neutral spectra. However, current noise rating schemes do not permit quantitative evaluation of the additional disturbance caused by these low-frequency rumble components.
This paper reports an initial investigation of methods to rate the annoying aspects of noise spectra with relatively high levels of both un-modulated and amplitude-modulated low-frequency sounds. Newer methods of rating indoor noise do include consideration of low-frequency sound pressure levels and the spectral balance of sounds. How-ever, they do not lead to a single number rating that com-llines the effects of both level and spectrum shape on an-noyance responses. In addition, they ignore the possible annoying effects of amplitude variations with time. The older, but still widely used, Noise Criterion (NC) rating system only considers sound pressure levels in the octave bands from 63 to 8000 Hz.
in 1981, Blazier' proposed the Room Criterion (RC) noise rating system specifically for rating the noise pro-duced by HVAC systems. It was subsequently adopted by the American Society for Heating Refrigerating and Air Conditioning Engineers (ASHRAE)2 for rating indoor noises from HVAC systems. Blazier found that the spectra of a large number of "acceptable" noises decreased uni-formly at 5 dB per octave. He therefore created a set of rating contours with slopes of - 5 dB/octave that extended from the 16-Hz to 4000-Hz octave bands. (Octave bands are referred to by the nominal center frequency of each octave band.) To evaluate noise spectra, the arithmetic av-a) Acoustics Laboratory, Institute for Research in Construction, National
Research Council, Ottawa, Ontario KIA OR6. Canada.
erage of the sound pressure levels in the three middle oc-taves (500, 1000, and 2000Hz) is calculated; this average sound pressure level is the RC rating number of the noise. A letter rating of the subjective quality of the spectrum of the noise is then added. A spectrum that is close to the shape of the -5 dB/octave RC contours is termed "neu-tral" and is assigned an "N" rating. A spectrum with ex-cessive low-frequency levels is assigned an "R" to indicate a spectrum containing rumble. For example, one spectrum might be assessed as RC-45 R and another RC-48 N. How-ever, the RC system does not include a method for deter-mining which of these two examples might be more dis-turbing.
More recently BeraneI2·4 developed the Balanced Noise Criterion or NCB system. The NCB procedure includes an-other family of rating contours that are not paraliel and are closer together at low frequencies than at higher frequen-cies, roughly similar to the older NC and Preferred Noise Criterion (PNC) rating contours. However, the newer NCB contours extend from the 16- to theBOOO-Hzoctaves. Using the NCB rating contours is somewhat similar to the two-step process of using the RC system. First, a speech inter-ference level is determined from the sound pressure levels in the 4 octaves from 500 to 4000 Hz. This speech interfer-ence level is the initial NCB value of the noise spectrum. Further calculations are then made to identify spectrum im-balance. Noise spectra with excessive levels of low-frequency sound are labeled as including "rumble." How-ever, there is again no procedure to quantify the possible negative effects of spectral imbalance.
While the RC and NCB methods represent improve-ments over the older NC and PNC systems, they do not produce complete quantitative ratings of the potential an-noyance of various indoor noises. The relative importance of mid-frequency sound pressure levels is ranked quantita-tively, but spectrum imbalance is only qualitatively ranked. in both the NCB and the RC systems, there is no procedure for trading-off the negative effects of noise levels versus the effects related to spectrum shape. Such a more complete system is not necessary for specifying
3. UN·MODULATED SOUNDS CONTAINING RUMBLE
Fig. 2 - Original spectra of un-modulated test sounds.
""
G|セGB
"') , ""''1''''\'\"
LLセ|N.'
\\ \ |セL I§.,., 40 llMNjMMセMZZGZMMZMZGZMMLZBMMMLlZMMGᄋBGMBGᄋGᄋGNZキ 16 31.5 63 125 250 500 1000 2000 4000octave band frequency(Hz)
m
セ_ 70 セL .9! l!!セ
60 c.セ
U>50an
The second experiment included test sounds where the low-frequency content was amplitude modulated. The two spectra with the highest levels at 31.5 Hz in Fig. 2 were used. For each of these two base spectra, amplitude-Inodulated sounds were creliled using tWo different l11odu-lation depths and five different modul11odu-lation frequencies. The modulation frequencies used were 0.25, 0.5, 1.0, 2.0, and 4.0 Hz. The modulation depths were 10 and 17 dB when a 1000 Hz test signal was amplitude-modulated and are
re-ferred to as "low" and "high," respectively. Because only
the extra low.frequency components were amplitude-modulated, the modulation depths of the total test signals were considerably less. The un-modulated spectra were
4. AMPUTUDE·MODULATED SOUNDS CONTAINING RUMBLE
The results cannot be related to either RC or NCB rat-ings of these sounds because the RC and NCB ratrat-ings do not vary significantly for these spectra. 1\vo of the test sounds were rated as RC-51 R and two as RC-51 N. The balanced-noise-criterion ratings for four spectra were NCB-48 or NCB-49. According to the NCB system, all of the spectra, including the neutral reference spectrum, would be rated as containing rumble.
The mean attenuator settings for the test sounds were also correlated with the A-, B·, C" D-,and FLAT-weighted sound levels of the spectra. The attenuator settings were most highly correlated with the FLAT and C-weighted mea· sures (r=0.98, p<O.OOl) and least highly with the
A-weighted levels(r=0.97, p<O.Ol). (Here "r" is the
correlation coefficient and "p" is the probability of this
correlation occurring by chance). Plots of attenuator set· tings versus the frequency·weighted sound pressure levels indicated that the relationships were probably not linear and that other factors might influence the relationships.
Fig. 3 - Attenuated spectra of un-modulated test sounds.
neutral reference spectrum ao
1ii'
セ Qj セ 70 l!!セ
セ 60i
50In the first experiment, four test spectra were presented
in comparison with a neutral reference spectrum. These test spectra and the reference spectra are shown in Fig. 2. The spectra are similar to typical real HVAC spectra found in a recent survey? The reference spectrum decreased approxi· mately 5 dB/octave from the 31.5-Hz octave band, and had a mid-frequency (1000·Hz) average sound pressure level of 51 dB. The test sounds with added rumble had spectra that peaked in the 31.5-Hz octave band. The comparisons also included a comparison of the neutral spectrum with itself.
Each setting of attenuator "B" was averaged over all 9 subjects and this average setting was converted to a sound pressure level change in decibels. When the subjects com-pared the reference spectrum with itself, the average result was a shift of -0.1 dB. Thus, subjects were able to very accurately adjust signals with the same spectrum to have the same level (i.e., with a mean error of only -0.1 dB).
The average attenuations of the four test signals were 1.5, 1.9, 3.4, and 5.9 dB. That is, for spectra with increasing low-frequency content, subjects reduced the overall level by these amounts to match the annoyance of the reference spectrum. The four test spectra and the reference spectrum are plotted in Fig. 3 with the levels of the test spectra ad· justed according to the mean attenuator settings of the 9 subjects. These results showed that subjects tended to ad· just the level of the test sounds until the octave band with the highest sound pressure level (31.5 Hz) just exceeded the reference spectrum and by no more than about 2 to 3 dB.
90
0---,
4OU----:-'--,L---"-:-':--:'--'---'-.:aJ
16 31.5 63 125 250 500 1000 2000 4000
octave band frequency(Hz)
lated for the octave bands from 16 to 8000 Hz. From the , same 559 sound pressure levels, L10 andLoovalues were calculated as the octave·band sound pressure levels ex· ceeded 10% and 90% of the time, respectively.
TABLE 1 - Minimum, maximum, and range of I-min.average sound pressure levels of the test sounds.
also included as a Q-Hz modulation frequency case. A total of 22 different sounds were included. These test signals were the combinations of: two base spectra, times two modulation depths, times five modulation frequencies, plus the two un-modulated spectra.
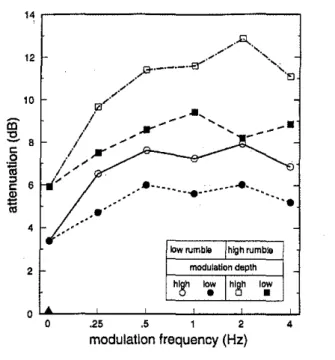
Subjects were again asked to adjust attenuator "B"until the test sound was equally annoying as the reference neu-tral spectrum. The mean settings of the attenuator for all 9 subjects are plotted versus modulation frequency in Fig. 4. The greater the adjustment of the attenuator, the more an-noying the subjects found the particular test sound. The results in Fig. 4 show that subjects found the spectra with higher levels of low-frequency sound more annoying, found greater modulation depth more annoying, and the results varied somewhat with modulation frequency.
An analysis-of-variance test of these results showed that there were significant (p<Q.QQl) main effects ofmodula-tion depth, modulaofmodula-tion frequency, and base spectrum. There were no significant interaction effects. Thus, the results of Fig. 4 illustrate significant systematic effects of modulation depth, modulation frequency, and base spectrum on judged annoyance. Minimum Maximum Range 0.5 1.0 0.5 1000 0.7 1.6 0.9 0.9 2.2 1:3 1.3 2.6 1.3 1.8 3.3 1.5 2.3 4.7 2.4
Octave midband frequency(Hz)
31.5 63 125 250 500
ャセュゥョN。カ・イ。ァ・ octave·band sound pressure level (dB)
16 79.4 82.0 74.7 68.3 62.4 56.7 51.3 Minimum 82.3 87.6 78.2 71.2 64.7 58.4 52.4 Maximum 2.9 5.6 3.5 2.9 2.3 1.7 1.1 Range Standard deviation (dB) 2.4 3.3 0.9 Measure 16 31.5 63 125 250 500 1000 81.1 77.2 73.9 68.7 62.7 56.7 50.9 Minimum LIO 84.2 79.9 76.8 71.7 65.4 59.2 52.7 Maximum 3.1 2.7 2.9 3.0 2.7 2.5 1.9 Range 74.t 73.1 69.9 64.8 59.6 54.4 49.3 Minimum £-go 76.6 75.5 72.7 67.1 61.3 55.7' 50.0 Maximum 2.5 2.4 2.8 2.3 1.7 1.3 0.7 Range 6.4 3.6 3.2 3.3 2.6 1.9 1.6 Minimum L1O -£90 8.8 4.8 4.6 5.4 4.9 4.0 2.8 Maximum 2.4 1.2 1.4 2.1 2.3 2.1 1.2 Range
Octave midband frequency(Hz)
The analysis-of-variance results showed that the subjec-tive evaluations were significantly related to the parameters that were systematically varied as part of the experiment.It
was also desirable to obtain relationships between the sub-jective evaluations and standard acoustical measures. These measures included five different frequency-weighted sounQ. pressure levels, i.e., A-, B-, Co, D-, and F'l..AT-weighted levels. For each octave band, values of percentile sound pressure levelsLlo andL90 ,and the standard deviations (u) of the I-min-average sound pressure levels were available. In addition, the differences(L10-L90 ) were calculated as an alternative measure of the variation of levels with time. The range of values of these acoustical measures for the 22 sound spectra are summarized in Tables 1, 2, and 3.
These data indicate that the sound spectra used in these experiments represent a reasonably wide range of realistic conditions. The C-weighted sound levels showed the great-est range. The octave-band equivalent-continuous sound pressure levels (LOB) varied most in the 315-Hz octave. The minimum standard deviations were associated with the variation with time of the un-modulated signals.
The mean attenuator settings, that were representative of the relative annoyance of the test sounds, were significantly related to all of the measures listed in Tables 1, 2, and 3. Of the frequency-weighted sound pressure levels in Table I,
TABLE 3 - Minimum, maximum, and range ofL10and£90octave-band percentile sound pressure levels and the differences£10'£90
for the test sounds.
TABLE 2 - Mi.nimum, maximum, and'range of t-min-average octave-band sound pressure levels and associated standard devia-tions of the test sounds.
Minimum Maximum Range 80.3 89.0 8.7
lowrumble high rumble modulation depth 66.4 73.9 7.5 .' e-セ-.セ _--e-⦅セ ...-... -"
".
76.0 85.8 9.8••
a ,5 1 2 4 modulation frequency (Hz) 66.6 74.2 7.6,.
12 10 iii' :E- B c:セ
::> 6 c:"
iii
•
2 0 04 - Mean attenuatar settings versus modulation frequency for
tWo
different base spectra (low rumble, high rumble)and rwo different modulation depths (low, high). Smooth
dotted lines show mean trends.
Frequency-weighted sound pressure level (dB)
A B C D FLAI
57.6 61.3 3.7
Fig.
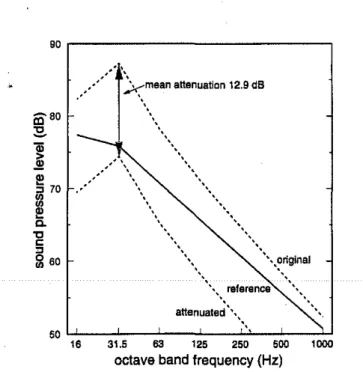
sound, the original test sound, and the attenuated test sound are comp¥ed in this figure. On average, subjects attenuated the test sound by 12,9 dB to make the annoyance equal to the annoyance of the reference sound. This example shows that rather than attenuate the test sound until it exceeded the reference spectrum at 31.5 Hz by 2 or 3 dB, it was adjusted to be 1.5 dB less than the reference sound at 31.5 Hz. Thus, there was an extra attenuation of about 4 dB in this case compared with the pattern for the unmodulated sounds. This difference can be related to the standard deviation of the test sound.
Various multiple regression analyses suggested that a number of combinations of mean sound pressure level and level variation could be used to predict the mean attenuator settings. Although statistically significant, some of these re-lationships were quite arbitrary in nature and were probably influenced by the particular characteristics of the test spec-tra used in this experiment. The most satisfactory approach for predicting the expected annoyance was obtained from an understanding of plots similar to that of Fig. 5.
The mean attenuator settings, in decibels, were predicted quite well by assuming they were related to the combina-tion of a level matching term and a standard deviacombina-tion term of the following form,
where (I!.LOB ) is the mean difference in 1-min-average octave-band equivalent-continuous sound pressure levels between the test spectrum and the reference spectrum aVer-aged over the four octaves from 31.5 to 250 Hz.
Similarly(I!.u) is the mean difference between the stan-dard deviations of the sound pressure levels of the test sound and the un-modulated references sound averaged over the octaves from 31.5 to 250 Hz.K is a constant and W is a modulation-frequency-dependent weighting func-tion.
The results of Fig. 4 suggest that the attenuator settings were approximately constant for modulation frequencies from 0.5 to 4 Hz. Subjects consistently attenuated the test sounds less for the 0.25 Hz modulation frequency cases and hence found them less annoying. A weighting function W that was 0.4 for the 0.25 Hz cases and 1.0 for all other modulation frequencies was found to successfully account for this small variation with modulation frequency.
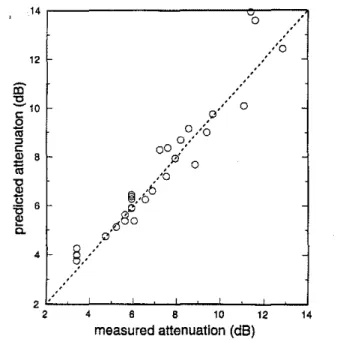
A range of values for the constantK could give reason-able fits with the measured attenuator settings. A value ofK equal to 2.5 rrtinimized the overall scatter about the mean trend. However, a value ofK equal to 4.5 seemed to better
fit the majority of the data points. The agreement of the data with this relationship is illustrated in Fig. 6, which plots predicted versus measured attenuations. If the two points at the top of the graph are excluded, almost all of the measured attenuations would be within ±1 dB of the pre-dicted values and the standard deviation of the differences between measured and predicted attenuations would be only 0.5 dB.
The results of Fig. 6 confirmed the success of the rela-tionship of Eq. (1) above and suggested that quite simple procedures can be developed to predict the additional an-noyance of sounds with strong low-frequency content and the relative annoyance was most strongly correlated with
'FLAT and C-weighted levels (r=0.93, p<O.OOl) and . least strongly correlated with A-weighted levels (r=0.90, p<O.OOl). At lower frequencies, attenuator settings were more strongly related to the octave-band sound pressure levelsLOBthan theL 10percentile sound pressure levels and
more strongly related to the standard deviations u than (LlO-L90 ) differences.LIO and L90values were each ob-tained from a single point near the extremes of the cumu-lative distribution of sound pressure levels. The standard deviations were calculated from the complete distribution and are a more-robust measure of level variations. 10 spite of the relatively high correlations with these measures, plots of mean attenuator setting versus frequency-weighted sound pressure levels exhibited substantial scatter and sug-gested nonlinear relationships. Further analyses were car-ried out to develop compound predictors of responses that included measures of both the mean levels and the temporal variations of levels.
5.COMBINED EFFECTS
10 the first experiment with un-modulated sound fields, subjects tended to adjust the level of the test sound so that it just exceeded the level of the reference sound in the 31.5-Hz octave band containing the highest sound pressure levels. For the amplitude-modulated sounds, subjects tended to further attenuate the test sounds and this further attenuation could be related to the amplitude modulation of the test sounds as measured by the standard deviation of the sound levels. Figure 5 illustrates the example of the average attenuation of the test spectrum for the case of the High rumble spectrum, with a 2.0-Hz modulation frequency, and the larger modulation depth. The spectra of the reference
90 , . . - - - , ,
.
•••• /セュ・。ョ
attenuation 12.9 dB .'\\.\
..
\. " " .. '..,,""
\\,
""'" "'" """ "'"""BGBLセ
••••••\ reference ••••••••• attenuated "" _. ' \ 50 LJ.._-'-_-,:_--'_--J:':>-_I....-_:l.J 16 31.5 63 125 250 500 1000octave band frequency(Hz)
Fig. 5 - Example comparing mean attenuated spectrum with the initial spectrum and the neutral reference spectrum.
Attenuation =(I!.Los)
+(K)( W)( (I!.u»,
(1)14 , - - - . . . , , , . - - - , ,
o
Fig. 6 - Comparison of mean measured attenuations and attenu-ations predictedusing Eq. (1).
that may include amplitude modulation of the low-frequency components.
6. CONCLUSIONS
The results of these initial experiments suggest that the room criterion (RC) rating system could be extended to quantitatively evaluate the negative effects of sounds con-taining various amounts of rumble. This paper suggests a scheme to predict the extra annoyance due to rumble com-ponents that includes a level matching term and a second term relating to the amplitude variation of the sounds.
208 Noise Controi Eng.J.42 (8), 1994 Nov-Dec
The results presented in this paper were based on an initial study with a limited range of test sounds. More com-prehensive studies are now required to further explore and develop these results into improved noise rating proce-dures. Such experiments should include loudspeaker pre-sentation of sounds, a greater variety of spectra, as well as consideration of the additional problems of evaluating the effects of stronger high frequency content (hiss) and pure tones. Finally, new noise rating procedures should be evalu-ated in actual office environments.
7. REFERENCES
1Warren E. Blazier, Jr., "Revised noise criteria for application in the
acoustical design of HVAC systems," Noise Control Eng. 16(2), 64-73
(1981March-April).
2ASHRAE Handbook: Fundamentals(American Society of Heating Re-frigerating and Air-Conditioning Engineers, Atlanta, Georgia, 1993), p. 7.9.
3LeoL. Beranek, "Balanced noise criterion (NCB) curves," 1. Acoust.
Soc. Am. 86(2), 650-664 (1989).
4LeoL. Beranek, "Applicationof NCB noise criterion curves," Noise Control Eng. J.33(2), 45-56 (1989September-October).
5Eberhard Zwicker, "On the dependence of unbiased annoyance on
loud-ness," Proc. INTER·NOISE 89 (Noise Control Foundation, Pough-keepsie, New York, 1989), Vol. 2, pp. 809-814.
6Warren E. Blazier, Jr. and Charles E. Ebbing, "Criteria for ャッキセ
frequency HVAC system noise controi in buildings," Proc.
INTER-NOISE92 (Noise Control Foundation, Poughkeepsie, New York, 1992),
Vol. 2,pp.761-766.
71. S. Bradley, "Predictors of Adverse Human Response to Traffic Noise," Proc. ASTM Symposium on Community Noise (ASTM, Phila-delphia, Pennsylvania, 1978), Special Publication 692, pp. 108-123.
8E. A. G. Shaw and R. Teranishi, "Sound pressure generated in an external-ear replica and real human ears by a nearby point source," J.
Acoust.Soc.Am. 44(1), 240-249 (1968).
IlNorman Broner, "Low frequency sound quality and HVAC systems," in
Proc.INTER-NOISE94 (Noise Control Foundation, Poughkeepsie, New