HAL Id: halshs-01110060
https://halshs.archives-ouvertes.fr/halshs-01110060
Submitted on 27 Jan 2015HAL is a multi-disciplinary open access archive for the deposit and dissemination of sci-entific research documents, whether they are pub-lished or not. The documents may come from teaching and research institutions in France or abroad, or from public or private research centers.
L’archive ouverte pluridisciplinaire HAL, est destinée au dépôt et à la diffusion de documents scientifiques de niveau recherche, publiés ou non, émanant des établissements d’enseignement et de recherche français ou étrangers, des laboratoires publics ou privés.
Measuring Structural Economic Vulnerability in Africa
Patrick Guillaumont
To cite this version:
Patrick Guillaumont. Measuring Structural Economic Vulnerability in Africa: A contribution to the Handbook of Africa and Economics. 2014. �halshs-01110060�
fondation pour les études et recherches sur le développement international
LA FERDI EST UNE FOND
A TION REC ONNUE D ’UTILITÉ PUBLIQUE . ELLE ME T EN ŒUVRE A VEC L ’IDDRI L ’INITIA TIVE POUR LE DÉ VEL OPPEMENT E
T LA GOUVERNANCE MONDIALE (IDGM).
ELLE C
OORDONNE LE LABEX IDGM+ QUI L
’ASSOCIE A U CERDI E T À L ’IDDRI. CE T TE PUBLIC A TION A BÉNÉFICIÉ D ’UNE AIDE DE L ’É TA T FR ANC AIS GÉRÉE P AR L ’ANR A U TITRE DU PR OGR A MME « INVESTISSEMENT S D ’A VENIR » POR TANT LA RÉFÉRENCE « ANR-10-LABX -14-01 »
Patrick Guillaumont is the President of the Fondation pour les Études et Recherches sur le Développement International (Ferdi). He is also Professor Emeritus at the University of Auvergne.
Measuring Structural Economic
Vulnerability in Africa*
A contribution to the
Handbook of Africa and Economics
Patrick Guillaumont
1. Introduction : The challenge of structural economic vulnerability for
African development
In 2006, at a time when growth had clearly resumed in Africa, the opening speech
at the irst African Economic Conference organized by the African Development
Bank and AERC was entitled “Economic vulnerability, still a challenge for African
growth” (Guillaumont 2007, 2008). Eight years on, including a global recession,
food and fuel price spikes, and recent state crises in Africa—although in many
countries growth has continued—vulnerability remains an issue to be addressed.
Both cross-country econometrics and case studies have documented the impact
of external, climatic, and political shocks on Africa’s growth, development, and
poverty reduction (Ibid.; see also the chapter by Xubei Luo in this book).
Al-though some progress has been recorded in addressing economic vulnerability
in Africa, it remains limited; moreover, the scope of vulnerability itself has been
changing with the emergence of new -social and environmental- dimensions.
.../...
* Olivier Cadot is strongly acknowledged for useful remarks and editing, without being committed by any opinion expressed in this paper
•
W
ork
ing Paper
•
De
velo
pment P
ol
ic
ie
s
97
April… /… Addressing the vulnerability of African economies requires an identification of its sources and determinants, including a conceptual clarification in view of the broadening scope. Section (2) proposes a conceptual framework where structural vulnerability is distinguished from general vulnerability, from physical vulnerability to climate change, and from state fragility as well. Section (3) analyzes the main features and evolution of structural economic vulnerability in Africa on the basis of an economic vulnerability index, highlighting not only higher structural economic vulnerability, but also a slower decline than in other developing economies. It then appears (section 4) that African economic vulnerability is reinforced by higher physical vulnerability to climate change, as shown by a specific index, and that Africa is the continent with the highest proportion of fragile states, suggesting a link between the various forms of vulnerability in Africa. Finally (section 5), measuring the structural vulnerability of African countries provides a useful tool for the international allocation of resources and not just to guide policies aimed at structural transformation and sustainable development. Adequately measured, structural vulnerability, as it is exogenous to current policy, may be a relevant criterion for the international allocation of concessional resources.
2. A conceptual framework for measuring structural vulnerability in Africa
Vulnerability, at the macro level (as at the micro level), is the risk for a country to be hampered by exogenous shocks, either natural (e.g. droughts) or external (e.g. fall in terms of trade). Structural vulnerability includes only factors that do not depend on a country’s current policies, being entirely determined by exogenous and persistent factors; while general vulnerability also includes the effect of current and future policies, and therefore changes more rapidly (Guillaumont 1999, 2006). Size of the shocks, exposure and resilience
There are three main sources of country vulnerability: the size of exogenous shocks ; the country’s exposure to those shocks (e.g. a small population size), and its capacity to cope with them, also named capacity to adapt or resilience. Structural vulnerability mainly results from the size of the shocks and the country’s exposure to them. General vulnerability also depends on resilience, more linked to current policy, and less to structural factors. There are indeed structural factors in the resilience of a country (such as its level of human capital and more generally its level of development or income per capita). However, most often these factors are not taken into account in the measurement of structural economic vulnerability, because, as we will see later on, they are considered separately. For instance, the Economic Vulnerability Index (EVI), an index of structural economic vulnerability devised by the United Nations for the identification of the Least Developed Countries (LDCs), includes neither per capita income nor the level of human capital, as their levels are also and separately used as LDC identification criteria.
The dynamic design of structural economic vulnerability
down by exogenous shocks, independently of its will. It is not only a risk of static loss of welfare. Thus, factors to be taken into account in the design and measurement of structural economic vulnerability should be likely to lower the rate of economic growth. An even broader meaning of structural economic vulnerability would include the risk that the country’s development become unsustainable, again because of shocks and factors independent of its will. Since the meaning of sustainability, as reflected in the preparatory works of the post-2015 agenda, now covers several dimensions—not only economic, but also environmental and socio-political—it is useful to examine together, but distinctly from structural economic vulnerability (using its original meaning mentioned above), vulnerability to climate change and what is commonly called state fragility. Structural economic vulnerability and physical vulnerability to climate change
Indeed, some of the climatic sources of economic vulnerability that can be taken into account in the design of an index of economic vulnerability (as has been the case with the EVI—see below), are related to structural and permanent economic and geographical features, but not to climate change per se. Vulnerability to climate change stems from a risk of long-term change in geo-physical conditions rather than to a growth handicap in the medium term. In other words, it is more physical than economic, and refers to a longer time horizon. As with structural economic vulnerability, and even more so, physical vulnerability to climate change is independent of present (and future) country policy. For this reason, its measurement should be based only on physical characteristics and trends, as is done in the “Physical Vulnerability to Climate Change Index” (PVCCI) set up at Ferdi.
Leaving aside the resilience components, physical vulnerability to climate change, like structural economic vulnerability, should reflect two main components: shock intensity (due to climate change) and exposure (for instance the sea level rise and the share of areas likely to be flooded). The lack of socio-economic components in the design of a physical index of vulnerability to climate change is all the more legitimate given that any assessment of future adaptation capacity is highly uncertain.
Blending the measurement of structural economic vulnerability and physical vulnerability to climate change is conceivable, but it would risk blurring information about the type of vulnerability a given country is facing.
Structural economic vulnerability and state fragility
A third dimension of vulnerability, but one that is highly dependent on the policy and current will of countries, is socio-political. State fragility is often presented as a form of vulnerability, although it is conceptually quite different. State fragility is designed and identified from present policy and institutional factors (lack of state capacity, political will, and political legitimacy), with many changing definitions, most often from an assessment of policies and institutions through the World Bank’s CPIA (Country Policy and Institutions Assessment). On the contrary, structural economic
vulnerability is designed from factors supposed to be independent of policy (Guillaumont and Guillaumont Jeanneney, 2009).
Structural economic vulnerability significantly influences state fragility, as shown, for instance, by the impact of the UN’s EVI index on the CPIA (Guillaumont, Mc Gillivray, and Wagner, 2013). Accordingly, most of the countries identified as “fragile states” are also “least developed countries,” a category based on structural economic vulnerability (in addition to levels of income per capita and human capital). This holds for Africa, as explained later.
Based on this conceptual framework, we now consider the measurement of structural economic vulnerability in Africa.
3. Comparative levels and trends of structural economic vulnerability in Africa
One approach to the analysis of economic vulnerability in Africa could be to consider growth volatility, an indicator that is widely used on account of its apparent simplicity and alleged impact on average growth (as evidenced by Ramey and Ramey, 1995). Growth volatility is generally proxied by the standard deviation of the annual growth rate of GDP per capita over a given number of years (9-10 years in the World Development Report 2014). However, this approach is not appropriate for the measurement of structural economic vulnerability for two reasons. The main one is that growth-rate instability may result not just from structural factors but also from transitory ones and domestic policy, dependent on the will of the country. Second, its measurement is highly sensitive to the length of the period covered—it should cover a minimum number of years to reflect a structural feature, but the longer the period, the higher the risk that the standard deviation simply reflects a trend change.1
The UN Economic Vulnerability Index
In order to examine the levels and trends of structural economic vulnerability in Africa, it is convenient to refer to the Economic Vulnerability Index set up by the UN’s Committee for Development Policy. The present structure of this index (initially introduced in 2000) was designed in 2005 (history and details in Guillaumont, 2009a, 2009b). It has been used for the triennial reviews of the list of LDCs in 2006, 2009, and, after a revision, in 2012 (on the scope and relevance of the revision, see Guillaumont, 2013). Its principle is to combine with equal weights a group of three sub-indices reflecting the intensity of recurrent shocks, natural and external, and a group of four-five sub-indices reflecting exposure to those shocks. The structure of the index is shown in Graph 1 in its 2006-09 and 2012 (revised) versions. The main change in the revised version was to add an “environmental” new component, the share of population living in low coastal areas, compensated by a reduced weight on population smallness.
1 According to the statistics of the World Development Report 2014, the average volatility of the GDP growth in the 1990s
Graph 1. The Economic Vulnerability Index, 2005-09 and 2011-12 versions compared
A high average level in Africa, a slower decline
Given our choice to examine separately structural economic vulnerability and physical vulnerability to climate change, we use the 2006-09 definition, all of whose components can be considered as potential contributors to slower growth. For that, we used new calculations of the EVI made at Ferdi on the basis of the 2006-09 definition (see Table 1). In the same way, we will consider the EVI’s evolution using a constant definition (Ferdi “Retrospective EVI”), either the 2006-09 one or the 2012 one (references)2.
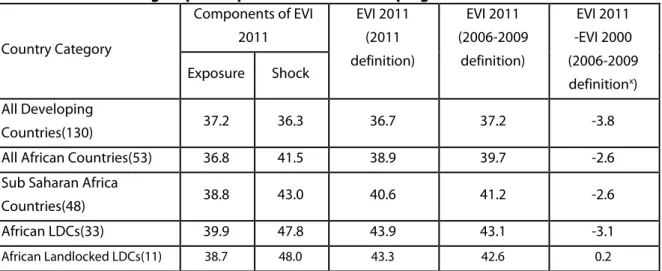
From Table 1, it clearly appears that African countries have a (significantly) higher EVI than other developing economies (whatever the definition, 2005-09 or 2011-12), due both to the shock and the exposure components of the index with the 2006-09 definition, though only to the shock components with the 2012 definition (mainly because the share of population in low elevated coastal zones (LECZ) is noticably lower in Africa, due to the number of landlocked countries, where it is zero). When only Sub Sahara Africa is considered, the gap is even more important and observable for the exposure as well as for the shock components. Among African countries, the African LDCs, as a group, show an even higher structural economic vulnerability than other African countries. The same holds for the group African Landlocked, but to a lesser extent.
Has the structural-vulnerability gap between African countries and other developing countries been shrinking or widening? The level of EVI measured according to a constant definition has been declining in African countries, evidencing some structural change. But the decrease in EVI observed
2 Several other improvements could be brought to the measurement of the EVI, in particular in the way by which the
between 2000 and 2011 has been deeper in non- African countries than in African ones, widening the structural gap between Africa and the rest of the developing world. In landlocked African countries, there has been no decrease, in spite of rapid population growth, a factor dampening the impact of small size.
Table 1. Economic Vulnerability Index (EVI): level in 2011 and change from 2000 to 2011. Africa and African subgroups compared to other developing countries
Country Category Components of EVI 2011 EVI 2011 (2011 definition) EVI 2011 (2006-2009 definition) EVI 2011 -EVI 2000 (2006-2009 definitionx) Exposure Shock All Developing Countries(130) 37.2 36.3 36.7 37.2 -3.8
All African Countries(53) 36.8 41.5 38.9 39.7 -2.6
Sub Saharan Africa
Countries(48) 38.8 43.0 40.6 41.2 -2.6
African LDCs(33) 39.9 47.8 43.9 43.1 -3.1
African Landlocked LDCs(11) 38.7 48.0 43.3 42.6 0.2
x The calculation of change (EVI 2011-2000) has been done without 3 countries: Eritrea, Ethiopia, and Timor-Leste
because data for these countries are not available in 2000.
Heterogeneity in vulnerability sources and in country levels
Unsurprisingly, there are large differences among African countries, particularly obvious when looking at the EVI’s components, indicating the heterogeneity of sources of structural vulnerability among the African countries (see Table 2 and Appendix 1).
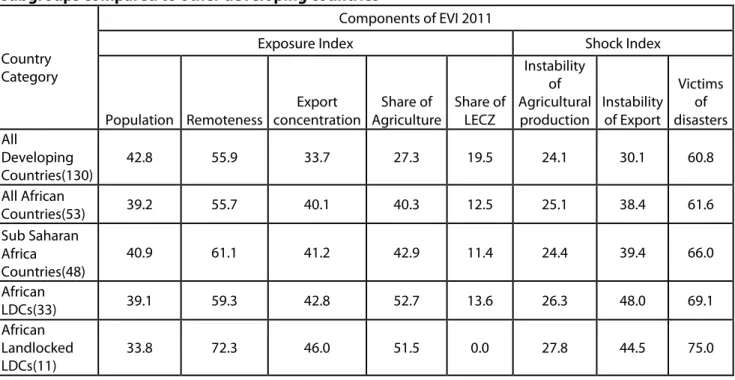
As for the shock index’s components, when all African countries are considered, the three component sub-indices are higher in Africa than in other developing countries, the instability of exports (of goods and services) being dramatically higher. When only SSA countries are considered, the number of victims of disasters is significantly higher, while the instability of agricultural production is no longer higher. For only African LDCs and for only landlocked African countries, the three sub-indices are even higher, the former evidencing the highest average for export instability, the latter for the victims of disasters. At the country level, the highest levels are shown by oil exporters (for which export concentration is high, as well as the instability of exports) and by some agricultural countries (Eritrea and the Gambia).
Table 2. Components of the Economic Vulnerability Index (EVI) in 2011. Africa and African subgroups compared to other developing countries
Country Category
Components of EVI 2011
Exposure Index Shock Index
Population Remoteness Export concentration Share of Agriculture Share of LECZ Instability of Agricultural production Instability of Export Victims of disasters All Developing Countries(130) 42.8 55.9 33.7 27.3 19.5 24.1 30.1 60.8 All African Countries(53) 39.2 55.7 40.1 40.3 12.5 25.1 38.4 61.6 Sub Saharan Africa Countries(48) 40.9 61.1 41.2 42.9 11.4 24.4 39.4 66.0 African LDCs(33) 39.1 59.3 42.8 52.7 13.6 26.3 48.0 69.1 African Landlocked LDCs(11) 33.8 72.3 46.0 51.5 0.0 27.8 44.5 75.0
As for the exposure sub-indices, when all African countries are considered, only the export concentration and the share of agriculture, forestry, and fisheries in GDP are significantly higher than in other developing countries, while the share of LECZ is of course significantly lower. When only SSA countries are considered, remoteness is also higher. For only landlocked African countries (and, to a lesser extent, African LDCs), the same three sub-indices are even higher, while the smallness of population is lower, and the LECZ component is nil. Finally the highest levels of the exposure index are observed in small coastal or island countries (Guinea Bissau, Comoros, Sao Tome and Principe, and the Gambia), and the lowest levels in the three Maghreb countries.
These measures should be taken as proxy indicators of structural economic vulnerability, likely to be discussed and improved in their composition and calculation.
Structural economic vulnerability is even higher when considered more broadly
It should be remembered that the assessment of structural economic vulnerability through the EVI, as it is presently designed, can only give a partial view, since it does not take into account the structural components of resilience, which are numerous and depend on the overall level of development. They are considered separately for the identification of the LDCs through the Human Assets Index (HAI), a composite index of health and education indicators, and the level of income per capita. Since the levels of human capital and income per capita are on average lower in Africa than in other developing countries, this reinforces the diagnosis of higher structural economic vulnerability in Africa. In this respect, it seems clear that the African countries with the lowest income and human capital face very high structural vulnerability: these poor and vulnerable countries, the category that the term “least developed countries” tries to capture, are more likely
than other to be “caught in a trap,” (unless they receive special support (and/or achieve bold reforms) (Guillaumont, 2009a)). The risk of getting trapped, as supposed in the LDCs identification criteria, results from the conjunction of structural economic vulnerability (stricto sensu) and low human capital in countries with low income per capita. For this reason, these three criteria are taken into account separately, in a complementary manner, for the identification of the LDCs. It is conceivable to aggregate the EVI and the HAI in a composite index of structural handicaps (a structural economic vulnerability lato sensu), allowing for limited substitutability between them to remain consistent with the initial hypothesis of complementarity...or even to combine these two indicators with the smallness of income per capita, in order to obtain an index of “least development” (see details in Guillaumont, 2009a).
It then remains to distinguish between the African LDCs, most of them are small or medium population countries (except Ethiopia and Tanzania), and the other African countries. Some of those countries may appear to be vulnerable with regard to their EVI, but not with respect to their level of income per capita (mainly the case of oil exporters) or their level of human capital.
Finally, it should be noted that the Economic Vulnerability Index may not seem to capture the new forms of vulnerability evidenced by the political events linked to the “Arab Spring” in North Africa. This vulnerability, easier to measure ex post, for instance through its impact on the instability of exports, does not fit the definition of structural vulnerability adopted above, since it mainly results from policy and institutional factors. It rather reflects a state fragility.
4. Structural economic vulnerability and other measures of vulnerability in Africa:
climate change and state fragility
In the introduction of this chapter, we juxtaposed structural economic vulnerability with two other forms of vulnerability, physical vulnerability to climate change and state fragility. For both there are attempts at measurement, which leads, now, to consider two issues. First, how structural economic vulnerability in Africa, measured with a medium-term horizon, is enhanced in the long term by physical vulnerability to climate change, according to the “Physical Vulnerability to Climate Change Index (PVCCI)”and what are the main sources and patterns of vulnerability to climate change in Africa? Second, do African countries suffer from state fragility, according to current assessments, and is this fragility the result of structural vulnerability?
Africa vulnerability to climate change.
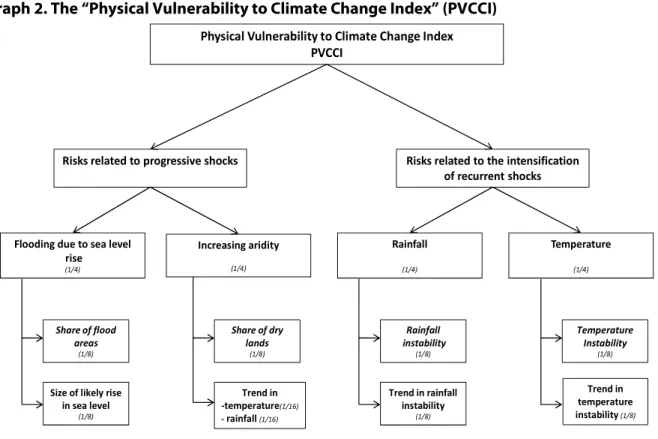
Because it is highly controversial to assess the likely socio-economic consequences of climate change, there is a rationale for setting up an index of vulnerability relying solely on physical components. As shown in Graph 2 below, this index combines the physical impact of two kinds of shocks, the progressive shocks, namely the sea level rise and the aridification, and the intensification of recurrent shocks, in temperature and rainfall, respectively (see details in Guillaumont and Simonet, 2011). For these four kinds of shocks, we combine an indicator of the
size of the shock with an indicator of the country exposure to the shock. Moreover, to better capture the vulnerability to any kind of shock linked to climate change we use a quadratic average of the main components instead of an arithmetic one.
Graph 2. The “Physical Vulnerability to Climate Change Index” (PVCCI)
Source: Guillaumont and Simonet, 2011
In Table 3, we give the average value of this index and its main components for the same groups of countries as the EVI.
Table 3. The Physical Vunerability to Climate Change Index: Africa and African subgroups compared to other developing countries
Country Category
Arithmetic average Quadratic average Progressive shocks Increasing recurrent Shocks PVCCI Progressive shocks Increasing recurrent shocks PVCCI Developing Countries (118) 24.4 47.9 36.2 32.4 48.9 42.5 African Countries(53) 26.2 49.4 37.8 35.9 50.1 44.7 Sub Saharan Africa Countries(48) 24.7 50.5 37.6 33.8 51.2 44.3 African LDCs(33) 24.2 51.4 37.8 33.4 52.3 44.8 African Landlocked (15) 26.1 51.2 38.7 36.9 52.1 46.1
Risks related to progressive shocks Risks related to the intensification of recurrent shocks
Flooding due to sea level rise (1/4) Increasing aridity (1/4) Rainfall (1/4) Temperature (1/4) Trend in -temperature(1/16) -rainfall (1/16) Share of dry lands (1/8) Trend in rainfall instability (1/8) Trend in temperature instability(1/8) Share of flood areas (1/8)
Size of likely rise in sea level (1/8) Rainfall instability (1/8) Temperature Instability (1/8) Physical Vulnerability to Climate Change Index
On average, all African countries, as well as Sub-Saharan countries, have a higher average PVCCI than the other developing countries (Table 3), a difference more significantly demonstrated when a quadratic average is used, instead of the arithmetic one. The difference increases when only African landlocked countries are considered. This higher level of African countries is due both to the impact of the increasing intensity of recurrent shocks (weighted by corresponding exposure indices) and to the impact of progressive shocks.
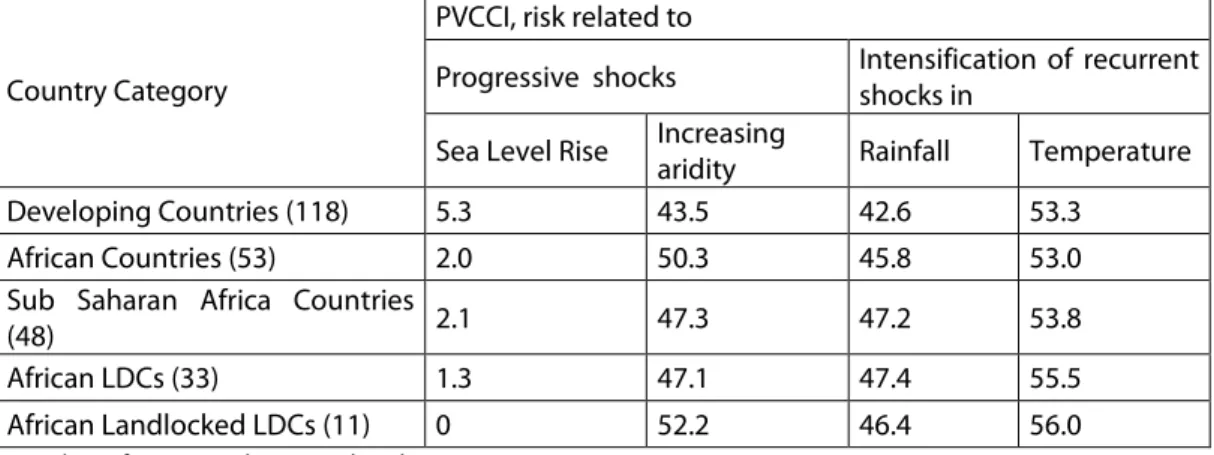
As for the risk associated with progressive shocks (see Tables 3 and 4), there is first a rather low impact of the sea level rise in Africa, since Africa includes very few small islands (more threatened by this trend) and many landlocked countries. But this lower vulnerability to sea level rise is compensated by a greater vulnerability to “increasing aridity” (7 points difference compared to all developing countries), itself due to a stronger (increasing) trend in temperature (rather than to the (decreasing) trend in rainfall), combined with a larger share of drylands. Finally, when an arithmetic average is used, the index of the risk of progressive shocks is not significantly different in Africa and in other developing countries, because of these two opposing effects, but becomes so when a quadratic average is used.
As for the index of increasing recurrent shocks, the higher average level for all African countries is due to the trend of rainfall instability, from a high initial level. For African LDCs or African Lanlocked countries, it is also due to the intensification of temperature instability.
Table 4. Components of the Vulnerability to Climate Change Index: Africa and African subgroups compared to other developing countries
Country Category
PVCCI, risk related to
Progressive shocks Intensification of recurrent shocks in
Sea Level Rise Increasing
aridity Rainfall Temperature
Developing Countries (118) 5.3 43.5 42.6 53.3
African Countries (53) 2.0 50.3 45.8 53.0
Sub Saharan Africa Countries
(48) 2.1 47.3 47.2 53.8
African LDCs (33) 1.3 47.1 47.4 55.5
African Landlocked LDCs (11) 0 52.2 46.4 56.0
Number of countries between brackets
The index exhibits a large heterogeneity in the levels and types of vulnerability among countries (see Appendix 2). The ten most vulnerable African countries with regard to the quadratic PCCVI are Sudan, Namibia, Mauritania, Niger, Botswana, Somalia, the Gambia, Zimbabwe, Senegal, and Burkina Faso. This is generally due to a high level of several components of the index. The ranking is sensitive to the kind of average used, due to the fact that the sources and profile of vulnerability differ from one country to another. The risk of “progressive shocks” is, for some African countries (Botswana, Chad, and Mali) , due to an increase of aridity, at the highest level in the world, while some African countries also face the other type of progressive shock, the sea level rise (Senegal or the Gambia). The “risk of intensification of recurrent shocks,” high on average for
African countries, is at the highest level for some African countries (Burundi, Sao Tome and Principe, Guinea-Bissau, Sudan, Zimbabwe, and Angola are among the ten developing countries at the highest level in the world). Thus, although many African countries seem to be highly vulnerable to climate change for physical reasons, the precise reason or channel of this (physical) vulnerability may differ significantly from one country to another.
It would be conceivable to combine the PCCVI with the EVI measure (taking its 2005-09 definition, to avoid partial overlapping through the share of population living in low coastal zones, the new EVI component introduced in 2001). Due to the different horizons of EVI and PCCVI, the weight given to each of them would reflect some time preference. With equal weights, the highest averages would be obtained by Sudan, the Gambia and Eritrea. Without calculating such a heterogeneous average, a picture of the two vulnerabilities can be given by representing the two indices on the same graph, as done in Appendix 3, where the oblique line corresponds to the 40 percent of countries with the highest average combined index. If African countries are compared to other developing countries with regard to this combined index, they evidence a significantly higher index (42.2 versus 37.9), even higher in Sub Saharan Africa (42.7) and African LDCs (43.9) or African landlocked (43.7). Fourteen African countries are among the twenty developing countries with the highest combined index.
State fragility
State fragility seems to be on the opposite side of structural (or physical) vulnerability, since it is designed from an assessment of present policy, as explained above. Among the various (and often changing) definitions of “Fragile States” and measurements of “state fragility” (see Guillaumont and Guillaumont Jeanneney, 2011), let us take the list of Fragile States used at the OECD in 2013, and presented as a list harmonized between OECD and the multilateral development banks. For 2012, it includes 47 countries, 27 of which are African countries, all south of the Sahara, all but four of which are LDCs. It is worth noting that it did not include Mali, Burkina Faso, Libya, Egypt—showing how volitile and uninformative it can be in terms of the real political risks faced by the countries. It is more a tool for designing curative measures, than to prevent the occurrence of failing states. The source of this paradox, well exemplified by the case of African countries, is to be found in the way in which the list is set up. Roughly speaking, the Fragile States are countries with a CPIA (World Bank Country Policy and Institutional Assessment) lower than 3.2 (on a scale from 1 to 6) or with UN peace-keeping operations.
Until recently, Mali was not considered as a Fragile State, because, due to policy improvement, its CPIA was above 3.2, although it was highly vulnerable; Niger, also highly vulnerable, is no longer considered “fragile,” also thanks to an improved CPIA. In fact, the category of Fragile State has been introduced to solve the problem met by the multilateral development banks in the allocation of their aid, based on so-called “performance.” The strict application of “performance based allocation” (PBA) appeared to require an exception for the states considered by various names as “fragile”; below a given CPIA threshold an exception to the strict PBA rule was applied. Without
discussing here the consistency of the rule and its exceptions (see Guillaumont, Guillaumont Jeanneney and Wagner, 2011, Guillaumont, 2012), let us note from a methodological point of view, it suggests the built-in weakness of the category of Fragile States. State fragility is indeed a huge issue, particularly in Africa, but it necessitates a qualitative assessment, allowing observers and donors to adapt their diagnostic and support, rather than a quantitative measurement (Collier, 2013). On the contrary, structural economic vulnerability, as well as physical vulnerability to climate change, can be roughly measured, and legitimately used for international allocation of resources, as we see now.
5. The measurement of structural vulnerability as a tool for designing international
policies towards Africa
The measurement of structural vulnerabilities through indices such as EVI or PVCCI is useful, first, in the design of policies aimed at tackling their main sources, which, as we have seen, differ according by country. From that perspective, the components of the indices are more important than the composite index. For another use of such a measurement, the international allocation of concessional resources, the composite index is needed and matters more.
Let us first consider the allocation of ODA. As already noted, PBA has been challenged by the Fragile-state cases. Actually, the challenge is broader. We had previously argued that the allocation of international development assistance should take into account the structural economic vulnerability of recipient countries, for several reasons (Guillaumont, 2009b, 2010b, 2011, Guillaumont, Guillaumont Jeanneney and Wagner, 2010). One such reason is equity. Taking into account the structural handicaps to development is a way by which development opportunities are made more equal between countries. At the same time, it increases the consistency of the reference to “performance,” which in its true meaning cannot be assessed without a consideration of these handicaps. Moreover, taking them into account is favorable to aid effectiveness, which has been shown to be higher in more vulnerable countries (thanks to the stabilizing impact of aid) (see, for instance, Chauvet and Guillaumont, 2009, Collier and Goderis, 2009). Finally, it allows for treating state fragility in an integrated framework, preventively as well as curatively. All these reasons particularly apply in the African context.
This view has been supported by a recent resolution of the UN General Assembly (A/C.2/67/L.53 of 4 December 2012 on the smooth transition of graduating LDCs), inviting the “development partners to consider least developed countries indicators, gross national income per capita, the human assets index, and the economic vulnerability index as part of their criteria for allocating official development assistance”. This has been recently implemented by the European Commission in programming the allocation of European assistance to ACP countries (Africa, Caribbean, Pacific) for the coming years. In this context, the measurement of structural economic vulnerability becomes particularly important. It may point to the need for a new refinement of the EVI.
A similar argument can be advanced for the allocation of assistance for adaptation to climate change. It is indeed legitimate to consider vulnerability to climate change as a relevant allocation criterion (Guillaumont and Simonet, 2011; Wheeler, 2011; Birdsall and De Nevers, 2012). The main reason is that the recipient developing countries are not responsible for the physical vulnerability they face. From that perspective, the PVCCI, since it does not depend on recipient policy, may be a relevant allocation criterion. Of course, as previously noted for the EVI, a refinement of the PCCVI index (ongoing at Ferdi) may be useful for this aim. Moreover, other allocation criteria are needed alongside, such as the level of income per capita, as a complementary indicator of need, and an indicator of the likely effectiveness of assistance.
Thus, in both cases (ODA and concessional resources for adaptation), it is clear that a structural or physical measure of vulnerability is a relevant allocation criterion. It also appears that structural resilience, not captured through the components of the EVI or the PVCCI, should also be taken into account through indicators such as per capita income or the level of human capital. While weak structural resilience, as a part of structural vulnerability, should lead to a higher allocation, a low resilience due to policy, if measurable, would act in the opposite direction, for reasons of effectiveness.
Conclusion
This chapter tried to present the main methodological issues involved in the measurement of structural economic vulnerability in Africa. This meant designing a conceptual framework capable of disentangling (i) “structural” vulnerability from vulnerability linked to present policies, and (ii) medium-term structural economic vulnerability from long-term physical vulnerability to climate change. In this framework, there are many options for measurement, depending on the expected use. Although the indices presented here may be considered as tentative, they highlight both Africa’s high average level of structural or physical vulnerability and the strong heterogeneity of its sources across African countries. While the diversity of sources should be taken into account in the design of the domestic policies addressing structural vulnerability, synthetic measures given by composite indices of structural economic vulnerability and of physical vulnerability to climate change should be used as criteria in the international allocation of development assistance and of concessional adaptation resources, respectively.
References
Birdsall N. and M. De Nevers (2012), “Adaptation Finance. How to Get Out from between a Rock ana Hard Place” CGD Policy Paper 001, February
Bruckner M. (2012) “Climate change vulnerability and the identification of the least developed countries ”, UN DESA, CDP Back ground Paper No.15, ST/ESA/2012/CDP/15, June
Cariolle J. and P. Guillaumont (2011) “A Retrospective Economic Vulnerability Index: 2010 update” Policy Brief/17, March, Ferdi Website: http://www.ferdi.fr/uploads/sfCmsContent/html/111/B17-Guillaumont-Cariolle.pdf
Chauvet L. and P. Guillaumont (2009), “Aid, Volatility and Growth Again. When Aid Volatility Matters and When it Does Not” Review of Development Economics, 13(3), 452-463
Collier P. and B. Goderis (2009), “Does Aid Mitigate External Shocks?” Review of Development Economics, 13(3), 429-451
Collier P. (2012), “How to Spend it. The organization of public spending and aid effectiveness”, UNU-WIDER, Working Paper N°. 2012/05, January
Füssel H.M. (2010), How inequitable is the global distribution of responsibility, capability, and vulnerability to climate change: A comprehensive indicator-based assessment”, Global Environmental Change, 20 (4), 597-611
Guillaumont P. (1999) “On the Economic Vulnerability of Low Income Countries”, CERDI Etudes et Documents
Guillaumont P. (2006), “Macro vulnerability in low income countries and aid responses”, in Securing Development in an Unstable Word (F. Bourguignon, B. Pleskovic, and J. van der Gaag, Edrs) ABCDE Europe 2005, Word Bank, 65-108
Guillaumont P. (2009a), Caught in a trap. Identifying the least developed countries, Economica, 2009, 386 p.
Guillaumont P. (2009b), "An Economic Vulnerability Index: Its Design and Use for International Development Policy", Oxford Development Studies, 37 (3), 193-228.
Guillaumont P. (2010a), "Assessing the Economic Vulnerability of Small Island Developing States and the Least Developed Countries", Journal of Development Studies, 46 (5), 828-854
Guillaumont P. (2010b), “Considering vulnerability as an aid allocation criterion”, Parliamentary Network on the World Bank (PNoWB) Network Review, 6 (September 2010), 14-15
Guilaumont P. (2013), “Measuring Structural Vulnerability to Allocate Develoment Assistance and Adaptation Resources”, Ferdi Working paper P.68
Guillaumont P. and S. Guillaumont Jeanneney (2009) “State fragility and economic vulnerability. What is measured and why?”, Paper prepared for the European Report on Development, Ferdi Working paper P.07
Guillaumont P., S. Guillaumont Jeanneney and L. Wagner (2010), “How to take into account vulnerability in aid allocation criteria” - ABCDE Conference Stockholm, FERDI Working Paper, P.13, May
Guillaumont P. and C. Simonet (2011a), “Designing an index of structural vulnerability to climate change”, FERDI Policy brief, B. 18, March
Guillaumont P. and C. Simonet (2011b), “To What Extent are African Countries Vulnerable to Climate Change? Lessons from a New Indicator of Physical Vulnerability to Climate Change”, Ferdi Working paper, I.08, November
Luo X., (2013) “Volatility and Vulnerability in Africa: A Long Run Perspective” , draft chapter for the Handbook of Africa and Economics
Ramey G. and V.A.Ramey (1995), “Cross-Cuntry Evidence on the Link between Volatility and Growth”, The American Economic Review, 85(5): 1138-51
United Nations (2012), General Assembly Resolution (A/C.2/67/L.51) on “Smooth transition for countries graduating from the list of least developed countries”.
Wheeler D. (2011) “Quantifying Vulnerability to Climate change: Implications for Adaptation Assistance”, Center for Global Development, Working Paper 240
Appendix 1. Level of the Economic Vulnerability Index in 2011 calculated at Ferdi with new data according to the UNCDP 2011 definition
EVI 2011 (2011 definition) Country_Name LDCs Landlocke d FS Exposure Index Shock Index EVI 2011 Change(EVI201 1-EVI2000) Valu e Ran k Valu e Ran k Valu e Ran k Algeria 13.2 2 33.1 19 23.1 6 -0.9 Angola x x 38.1 27 61.3 46 49.7 44 -1.5 Benin x 37.9 25 31.7 16 34.8 18 -10.1 Botswana x 47.1 46 34.5 21 40.8 31 -4.3 Burkina Faso x x 35.0 21 38.8 26 36.9 25 -7.4 Burundi x x x 42.2 37 65.6 48 53.9 48 2.3 Côte d'Ivoire 28.4 10 43.3 35 22.3 4 1.4 Cameroon x 27.8 9 18.4 3 23.1 5 -2.7 Cape Verde 43.1 39 27.2 10 35.1 19 -3.2 Central African Republic x x x 43.4 41 19.1 4 31.3 13 -1.4 Chad x x x 37.7 24 74.3 50 56.0 50 15.9 Comoros x x 57.3 52 38.5 25 47.9 42 -7.8 Congo 38.4 30 30.1 15 34.3 17 -2.4
Dem. Rep. of the
Congo x x 29.7 14 45.7 38 37.7 27 -2.0 Djibouti x 48.1 48 44.1 37 46.1 40 -11.3 Egypt 21.2 4 15.6 2 18.4 2 -6.5 Equatorial Guinea x 43.1 40 41.1 30 42.1 33 -9.4 Eritrea x x 29.3 12 88.7 53 59.0 51 Ethiopia x x 30.1 17 32.6 18 31.4 14 Gabon 43.7 43 33.7 20 38.7 29 2.5 Gambia x 49.8 50 84.9 52 67.3 53 17.4 Ghana 29.8 15 29.2 13 29.5 12 -17.9 Guinea x x 34.6 20 20.3 5 27.4 10 1.0 Guinea-Bissau x x 58.0 53 61.6 47 59.8 52 -1.8 Kenya x 24.8 6 28.8 12 26.8 8 -2.7 Lesotho x x 44.6 44 39.8 27 42.2 34 -2.1 Liberia x x 49.3 49 53.6 43 51.5 46 -12.5 Libyan Arab Jamahiriya 26.4 7 41.3 31 33.8 16 3.7 Madagascar x 33.6 18 40.1 28 36.8 24 6.2 Malawi x x x 41.6 34 54.5 44 48.0 43 -4.0 Mali x x 38.1 28 32.5 17 35.3 20 1.3 Mauritania x 43.6 42 47.8 39 45.7 39 8.9 Mauritius 42.1 36 14.7 1 28.4 11 -10.5 Morocco 12.5 1 20.8 6 16.7 1 -5.0 Mozambique x 39.6 32 51.1 40 45.4 38 -2.0 Namibia 37.9 26 37.1 24 37.5 26 0.0 Niger x x x 34.1 19 41.7 32 37.9 28 -5.0 Nigeria x 29.9 16 42.7 33 36.3 22 -6.4
Rwanda x x x 38.8 31 51.2 41 45.0 37 -4.4 Sao Tome and
Principe x 55.8 51 30.0 14 42.9 36 -13.7 Senegal x 35.8 23 37.0 23 36.4 23 -2.8 Seychelles 47.2 47 35.8 22 41.5 32 -0.7 Sierra Leone x x 41.0 33 59.1 45 50.1 45 0.5 Somalia x x 42.8 38 51.2 42 47.0 41 -14.3 South Africa 23.5 5 24.5 8 24.0 7 0.4 Sudan x x 29.5 13 75.2 51 52.4 47 0.3 Swaziland x 44.7 45 40.5 29 42.6 35 0.0 Togo x x 38.3 29 28.8 11 33.5 15 -5.4 Tunisia 16.5 3 22.7 7 19.6 3 -5.7 Uganda x x x 28.6 11 42.8 34 35.7 21 -12.2 United Rep. of Tanzania x 26.8 8 26.9 9 26.9 9 -2.8 Zambia x x 42.0 35 67.2 49 54.6 49 9.4 Zimbabwe x x 35.4 22 43.5 36 39.5 30 2.5
Appendix 2. Level of the quadratic Physical Vulnerability to Climate Change Index calculated by Ferdi and rank of countries.
PVCCI Country_Name LDC s Landlocke d FS Progressive Shocks Recurrent Shocks PVCCI Value Rank Value Rank Valu
e Ran k Algeria 55.3 46 48.1 21 51.8 38 Angola x x 28.2 25 60.3 48 47.1 32 Benin x 24.9 21 48.0 19 38.2 15 Botswana x 60.9 52 50.3 28 55.8 49 Burkina Faso x x 50.7 37 56.5 43 53.7 44 Burundi x x x 23.3 19 72.0 53 53.5 43 Côte d'Ivoire 16.6 4 43.9 9 33.2 4 Cameroon x 20.0 12 48.0 20 36.8 10 Cape Verde 50.6 36 50.2 27 50.4 37
Central African Republic x x x 14.9 1 44.1 10 32.9 3
Chad x x x 52.4 39 53.4 36 52.9 42
Comoros x x 29.4 28 29.0 1 29.2 1
Congo 15.9 2 51.5 31 38.1 14
Dem. Rep. of the Congo x x 18.2 9 43.5 8 33.4 5
Djibouti x 53.5 43 38.9 5 46.8 30 Egypt 54.5 45 42.6 7 48.9 36 Equatorial Guinea x 18.1 7 47.1 17 35.7 8 Eritrea x x 50.1 35 46.4 14 48.3 34 Ethiopia x x 35.4 30 45.5 11 40.8 21 Gabon 17.5 5 52.3 32 39.0 17 Gambia x 51.8 38 58.0 46 55.0 47 Ghana 18.9 10 48.9 23 37.0 12 Guinea x x 20.9 13 53.0 35 40.3 19
Guinea-Bissau x x 22.3 17 62.4 51 46.8 31
Kenya x 44.9 32 46.8 15 45.9 28
Lesotho x x 22.0 16 49.6 25 38.4 16
Liberia x x 19.0 11 47.2 18 35.9 9
Libyan Arab Jamahiriya 58.3 50 46.8 15 52.9 41
Madagascar x 22.8 18 53.8 37 41.3 22 Malawi x x x 25.6 22 51.4 30 40.6 20 Mali x x 52.6 40 51.1 29 51.8 39 Mauritania x 56.0 47 57.3 44 56.6 51 Mauritius 16.5 3 39.3 6 30.1 2 Morocco 53.5 44 31.2 3 43.8 26 Mozambique x 26.9 23 55.3 41 43.5 25 Namibia 61.0 53 52.6 34 57.0 52 Niger x x x 56.9 48 55.5 42 56.2 50 Nigeria x 33.8 29 52.6 33 44.2 27 Rwanda x x x 22.0 15 54.6 40 41.6 23
Sao Tome and Principe x 18.2 8 71.3 52 52.0 40
Senegal x 53.3 41 54.2 39 53.8 45 Seychelles 29.3 27 53.8 37 43.3 24 Sierra Leone x x 24.6 20 46.1 13 37.0 11 Somalia x x 53.3 42 57.4 45 55.4 48 South Africa 47.4 33 50.0 26 48.7 35 Sudan x x 58.2 49 62.1 50 60.2 53 Swaziland x 39.2 31 29.3 2 34.6 6 Togo x x 17.9 6 46.1 12 34.9 7 Tunisia 59.0 51 31.2 3 47.2 33 Uganda x x x 21.9 14 48.9 24 37.9 13
United Rep. of Tanzania x 28.8 26 48.5 22 39.9 18
Zambia x x 28.2 24 58.5 47 45.9 29