HAL Id: hal-03001964
https://hal.uca.fr/hal-03001964
Submitted on 12 Nov 2020
HAL is a multi-disciplinary open access
archive for the deposit and dissemination of
sci-entific research documents, whether they are
pub-lished or not. The documents may come from
teaching and research institutions in France or
abroad, or from public or private research centers.
L’archive ouverte pluridisciplinaire HAL, est
destinée au dépôt et à la diffusion de documents
scientifiques de niveau recherche, publiés ou non,
émanant des établissements d’enseignement et de
recherche français ou étrangers, des laboratoires
publics ou privés.
Estimating eruptive parameters and related
uncertainties for pyroclastic density currents deposits:
worked examples from Somma-Vesuvius (Italy)
Raffaello Cioni, Alessandro Tadini, Lucia Gurioli, Antonella Bertagnini,
Maurizio Mulas, Andrea Bevilacqua, Augusto Neri
To cite this version:
Raffaello Cioni, Alessandro Tadini, Lucia Gurioli, Antonella Bertagnini, Maurizio Mulas, et al..
Estimating eruptive parameters and related uncertainties for pyroclastic density currents deposits:
worked examples from Somma-Vesuvius (Italy). Bulletin of Volcanology, Springer Verlag, 2020, 82
(9), �10.1007/s00445-020-01402-7�. �hal-03001964�
Bulletin of Volcanology
Estimating eruptive parameters and related uncertainties for pyroclastic density
currents deposits: worked examples from Somma-Vesuvius (Italy)
--Manuscript
Draft--Manuscript Number: BUVO-D-20-00004R2
Full Title: Estimating eruptive parameters and related uncertainties for pyroclastic density
currents deposits: worked examples from Somma-Vesuvius (Italy)
Article Type: Research Article
Corresponding Author: Alessandro Tadini
Universite Clermont Auvergne
Aubière, Auvergne-Rhone-Alps FRANCE Corresponding Author Secondary
Information:
Order of Authors: Raffaello Cioni, Ph.D
Alessandro Tadini, Ph.D. Lucia Gurioli, Ph.D. Antonella Bertagnini, Ph.D. Maurizio Mulas, Ph.D. Andrea Bevilacqua, Ph.D. Augusto Neri, Ph.D.
Funding Information: Dipartimento della Protezione Civile,
Presidenza del Consiglio dei Ministri (Project V1)
Dr. Augusto Neri
Abstract: The quantification of the maximum runout, invaded area, volume and total grain-size
distribution (TGSD) of pyroclastic density currents (PDC) is a critically important task because such parameters represent the needed input quantities for physical modeling and for hazard assessment of PDCs. In this work, new and well-established methods for the quantification of these parameters are applied to a large stratigraphic dataset of three PDC units from two eruptions of Somma-Vesuvius (the AD 79 Pompeii and the AD 472 Pollena eruptions), representative of a large spectrum of transport and depositional processes. Maximum runout and invaded area are defined on the basis of the available volcanological and topographical constraints. The related uncertainties are evaluated with an expert judgement procedure, which considered the different sectors of the volcano separately. Quite large uncertainty estimates of dispersal area (20-40%) may have important implications in terms of hazard assessment. The testing of different methods for estimating the volume (and mass) of a PDC deposit suggests that integration, over the invaded area, of thickness (and deposit density) data using the triangulated irregular network method can minimize and localize data extrapolation. Such calculations, however, bear an intrinsic additional uncertainty (at least 10% of the total PDC deposit) related to loss or new formation of fine material during transport (at least 10% of the total PDC deposit). Different interpolation methods for TGSD produce multimodal distributions, likely reflecting the different response of each grain size class to transport and deposition processes. These data, when integrated with information on the related co-ignimbrite deposits, can give a more accurate picture of the pyroclastic mixture feeding the current.
Response to Reviewers: Dear Associate Editor,
we have addressed all the requests for the revision, which are detailed in the following letter and in the manuscript with tracked changes. Furthermore, we have embedded figure captions in each figure's file, and we have checked the formatting of the references and the bibliography. Please let us know if you need also the figures withouth the captions.
Best Regards
Alessandro Tadini (on behalf of all the other co-authors)
Author Comments: Dear publication office,
as I have written to Fran van wyk de vries today, I am not able to link my current BV account to my ORCID account due to a previous BV account of mine with another email (not active anymore) which is linked to my ORCID account. If it is possible to delete my old account and merge the information from the old account to my current account that would be great. If not, could you please delete the old account? Thanks a lot for your help
Best Regards Alessandro Tadini
Estimating eruptive parameters and related uncertainties for pyroclastic density
1
currents deposits: worked examples from Somma-Vesuvius (Italy)
2
Raffaello Cioni
1,2,
Alessandro Tadini
1,3*†, Lucia Gurioli
4, Antonella Bertagnini
3, Maurizio Mulas
5,
3
Andrea Bevilacqua
3, Augusto Neri
34
1Dipartimento di Scienze della Terra, Università di Firenze, Via G. La Pira, 4 – 50121 Firenze, Italy.
5
2Consiglio Nazionale delle Ricerche, Ist. di Geoscienze e Georisorse, SS Firenze, Via G. La Pira, 4 - 50121 Firenze, Italy.
6
3Istituto Nazionale di Geofisica e Vulcanologia, Sezione di Pisa, Via Cesare Battisti, 53 – 56125 Pisa, Italy.
7
4Laboratoire Magmas et Volcans, Univeristé Clermont Auvergne, CNRS, IRD, OPGC, Campus Universitaire des Cézeaux 6
8
Avenue Blaise Pascal TSA 60026 – CS 60026 63178 Aubiere Cedex, France.
9
5Escuela Superior Politécnica del Litoral, ESPOL, Facultad de Ingeniería en Ciencias de la Tierra, Campus Gustavo Galindo
10
Km 30.5 Vía Perimetral, P.O. Box 09-01-5863, Guayaquil, Ecuador.
11
12
13
14
*Corresponding author: Alessandro Tadini (Alessandro.TADINI@uca.fr)
15
†Current address: Laboratoire Magmas et Volcans, Univeristé Clermont Auvergne, CNRS, IRD, OPGC, Campus
16
Universitaire des Cézeaux 6 Avenue Blaise Pascal TSA 60026 – CS 60026 63178 Aubiere Cedex, France
17
18
ORCID IDs19
Raffaello Cioni : 0000-0002-2526-909520
Alessandro Tadini : 0000-0003-3603-085321
Lucia Gurioli : 0000-0002-5066-515322
Antonella Bertagnini : 0000-0003-4075-224223
Maurizio Mulas : 0000-0002-2089-398024
Andrea Bevilacqua : 0000-0002-0724-259325
Augusto Neri : 0000-0002-3536-362426
27
28
Manuscript Click here to access/download;Manuscript;Manuscript.docx
Acknowledgements
29
Marina Bisson is acknowledged for several useful discussions during the development of the manuscript, which greatly
30
improved its quality. This paper was greatly improved by the detailed and insightful comments of Greg Valentine and of an
31
anonymous reviewer. We also thank the editorial handling of Richard J. Brown.
32
Funding information
33
This work has been partially supported by the project V1 “Stima della pericolosità vulcanica in termini probabilistici”
34
funded by Dipartimento della Protezione Civile (Italy). The manuscript does not necessarily represent official views and
35
policies of the Dipartimento della Protezione Civile.
36
Availability of data and material
37
The Online Resources presented in this study could be found also in a repository in the Figshare community with the
38
following DOI: 10.6084/m9.figshare.12506027.
39
40
Abstract
41
The quantification of the maximum runout, invaded area, volume and total grain-size distribution (TGSD) of
42
pyroclastic density currents (PDC) is a critically important task because such parameters represent the needed input
43
quantities for physical modeling and for hazard assessment of PDCs. In this work, new and well-established methods for the
44
quantification of these parameters are applied to a large stratigraphic dataset of three PDC units from two eruptions of
45
Somma-Vesuvius (the AD 79 Pompeii and the AD 472 Pollena eruptions), representative of a large spectrum of transport
46
and depositional processes. Maximum runout and invaded area are defined on the basis of the available volcanological and
47
topographical constraints. The related uncertainties are evaluated with an expert judgement procedure, which considered the
48
different sectors of the volcano separately. Quite large uncertainty estimates of dispersal area (20-40%) may have important
49
implications in terms of hazard assessment. The testing of different methods for estimating the volume (and mass) of a PDC
50
deposit suggests that integration, over the invaded area, of thickness (and deposit density) data using the triangulated
51
irregular network method can minimize and localize data extrapolation. Such calculations, however, bear an intrinsic
52
additional uncertainty (at least 10% of the total PDC deposit) related to loss or new formation of fine material during
53
transport (at least 10% of the total PDC deposit). Different interpolation methods for TGSD produce multimodal
54
distributions, likely reflecting the different response of each grain size class to transport and deposition processes. These
55
data, when integrated with information on the related co-ignimbrite deposits, can give a more accurate picture of the
56
pyroclastic mixture feeding the current.
57
58
59
Keywords
60
Pyroclastic Density Currents; Somma-Vesuvius; maximum runout; volume; total grain size distribution;
61
uncertainty quantification
1. Introduction
63
The starting point for the assessment of volcanic hazard is an accurate reconstruction of the eruptive history of a
64
volcano, which in turn relies upon the availability of detailed field data that provide physical characterization of the possible
65
outcomes of a future eruption (Neri et al. 2008). While methods for estimating eruption source parameters related to tephra
66
fallout are clearly defined and numerical modeling has been generally developed based on these data (Biass et al. 2014),
67
measurements on pyroclastic density current (PDC – called also pyroclastic currents) deposits have been used only recently
68
to constrain the related numerical models (e.g., Esposti Ongaro et al. 2012, 2016; Spiller et al. 2014). Some of the most
69
important parameters that need to be evaluated to constrain PDC-related hazards are: a) maximum runout distance, b) extent
70
of invaded area, c) total volume and d) total grain size distribution (TGSD) of the flow mixture. In parallel,
71
sedimentological investigations on the deposits aimed at defining the main transport and depositional processes of the
72
parental current are fundamental for the definition of the assumptions that have to be made in the physical modeling, and
73
hence of the models to be used (Patra et al. 2018, 2020). Despite several attempts to estimate these parameters for PDCs, the
74
latter are known to be affected by several sources of epistemic uncertainty (see Bevilacqua et al. 2017; Rutarindwa et al.
75
2019). Presently the volcanological community lacks a standardized approach for estimating PDC-related parameters from
76
their deposits. This is primarily due to the complexity of the depositional processes, which are strongly controlled by the
77
interaction of the current with the underlying topography and by the mechanics of particle transport in the different regions
78
of the current: such complexity prevents the description of the thickness or grain-size of PDC deposits simply as a function
79
of the distance from the vent (Druitt 1998; Branney and Kokelaar 2002).
80
Here we quantify key parameters for a range of PDC deposits at Somma-Vesuvius volcano that can be used as
81
input data for numerical simulations for volcanic hazard assessment, and to provide extensive uncertainty quantification.
82
The different methodologies presented and discussed here provide a blueprint for the development of standard procedures
83
for the assessment of these important parameters and the related uncertainty. We present new and revised data from PDC
84
deposits from two different eruptions at Somma-Vesuvius (Fig. 1): i) the AD 79 Pompeii Plinian eruption and ii) the AD
85
472 Pollena sub-Plinian eruption. These PDC deposits resulted from different transport and deposition conditions, allowing
86
us to test different methods of estimation over diverse natural conditions. Therefore, for each of the previously listed
87
parameters, different methods were refined and used for their quantification, results obtained for the same parameter from
88
different methods were compared and discussed, and an average value among the methods is provided for each parameter.
89
90
2. Types of pyroclastic density currents at Somma-Vesuvius
91
We consider two end-member types of PDCs, common during Plinian and sub-Plinian eruptions (Cioni et al. 2004;
92
Cioni et al. 2008):
93
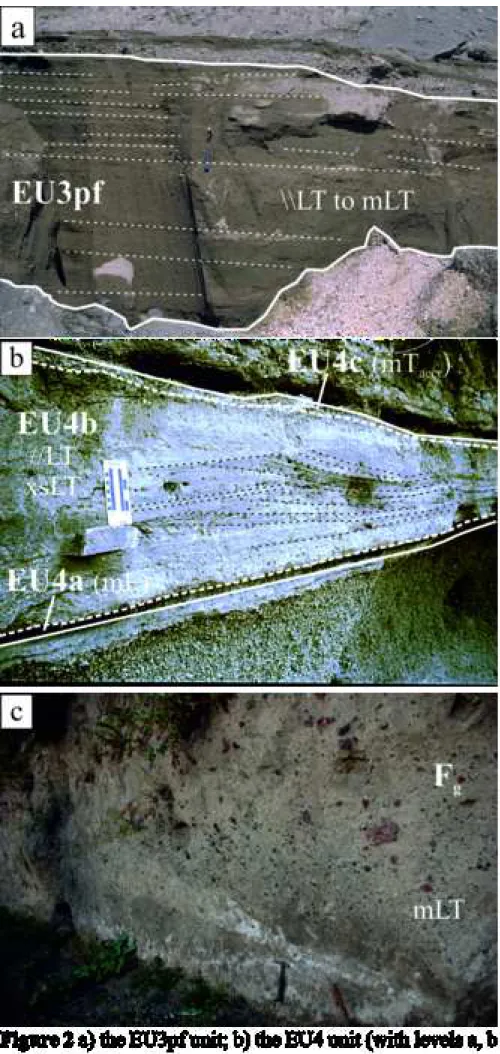
i) dilute PDCs, where turbulence is the main supporting mechanism (Branney and Kokelaar 2002). Deposits
94
from this type of PDC are here represented by the EU3pf (Fig. 2a) and EU4b (Fig. 2b) PDC units from the
95
AD 79 Pompeii eruption (Cioni et al. 2004; Gurioli et al. 2007). They are composed of tuff and fine lapilli
96
tuff, and characterized by a progressive, although irregular, variation of grainsize, texture and thickness
97
with distance from source and by the presence of traction structures such as planar and cross beds with
98
internal coarse-tail grading.
ii) dense PDCs, where transport of particles is dominated by collisional momentum transfer between grains
100
(Branney and Kokelaar 2002). Deposits of this type are represented by two PDC lobes (i.e. the “Cupa
101
Olivella” and “Cupa Fontana”) belonging to the Fg unit of the AD 472 Pollena eruption (Sulpizio et al.
102
2005; Sulpizio et al. 2007). They are characterized by massive deposits up to 12 meters thick that are
103
mainly confined to deeper paleovalleys, and that exhibit no variation in grainsize with distance (Fig. 2c).
104
105
2.1 AD 79 deposits
106
Cioni et al. (1992) divided the AD 79 eruptive sequence into 8 main eruptive units (EU1-EU8) and some minor
107
sub-units. Three main phases of the eruption (opening phase, Plinian phase and phreatomagmatic phase) were distinguished
108
and PDC deposits are mainly related to the last two phases (Cioni et al. 1992).
109
The PDC deposits of the EU3pf unit (Fig. 2a) are considered to be derived from the final collapse of the Plinian
110
column (Cioni et al. 2004). They are typically about one meter thick, are radially dispersed up to 10 km from vent, and have
111
complex vertical and lateral facies variability (Gurioli 1999; Gurioli et al. 1999) that can be ascribed to local variation in
112
turbulence and particle concentration and to the stratification of the current. Median clast size tends to diminish gradually
113
from proximal to distal locations, and the coarsest deposits (generally present as tuff breccia lenses in the EU3pf sequence)
114
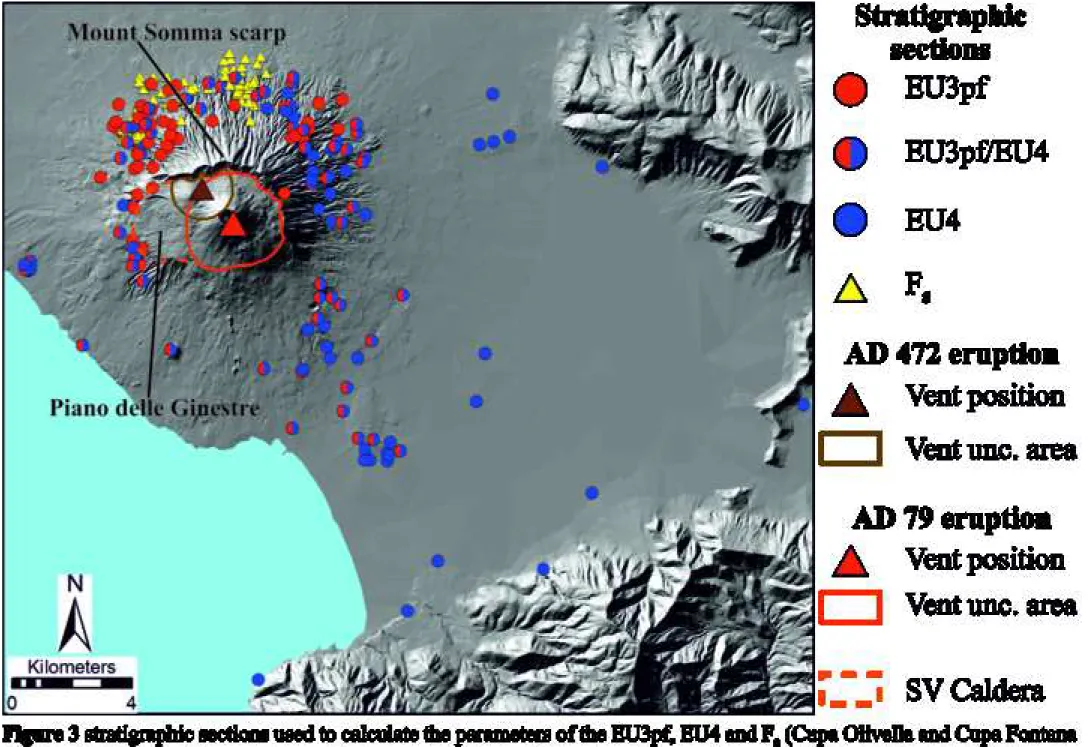
are located within paleodepressions. Gurioli et al. (1999) noted that: i) in the southern part of the Somma-Vesuvius area (see
115
Fig. 3) the relatively smooth paleo-topography exerted only localized control on the overall deposition of the PDC; ii) in the
116
eastern sector of Somma-Vesuvius, where the current climbed over the remnants of the old Mount Somma scarp, the
117
paleotopography induced a general increase of the current turbulence and velocity and more efficient air ingestion; iii) in the
118
western sector of Somma-Vesuvius (Fig. 3), the presence of a breach in the caldera wall and a major break in slope in the
119
area of Piano delle Ginestre (see Fig. 3), possibly increased deposition from the PDC, producing a large depositional fan
120
with thicknesses up to several meters toward sea-facing sectors (e.g., in Ercolano, Fig. 1); iv) in the northern sector of
121
Somma-Vesuvius (see Fig. 3), the deeply eroded paleotopography (with many valleys and steep slopes) favored the
122
development within the whole current of a fast-moving, dense basal underflow confined in the main valleys, with a slower
123
and more dilute portion travelling along morphological highs.
124
The AD 79 EU4 unit (Fig. 2b) resulted from a short-lived column that emplaced three distinct layers (Cioni et al.
125
1992): a thin, basal fallout layer (“EU4a”, Fig. 2b); a PDC deposit which represents on average 60-90% of the total EU4
126
thickness, interpreted as the result of column collapse (“EU4b”, Fig. 2b); a co-ignimbrite ash fall layers relating to EU4b
127
(“EU4c”, Fig. 2b). The runout of the EU4b PDC is one of the greatest observed for PDCs at Somma-Vesuvius (20 km;
128
Gurioli et al. 2010) and it reached the area presently occupied by the town of Nocera Inferiore (Fig. 1). This unit has been
129
extensively studied by Gurioli (1999) and Gurioli et al. (2005), who highlighted that: i) EU4b shows clear vertical grain size
130
and textural variations, and varies from cross bedded, fine lapilli to coarse ash laminae at the base to a massive, fine
ash-131
bearing, poorly sorted, matrix-supported bed at top; ii) the extended erosion of the pumice-bearing layer of the underlying
132
EU4a is an evidence of the high shear rate exerted by the EU4b whose deposit can be interpreted as derived from a
short-133
lived density stratified PDC.
134
135
136
137
2.1 AD 472 deposits
138
The AD 472 Pollena eruption was classified by Cioni et al. (2008) as a sub-Plinian type I event, distinguished from
139
a sub-Plinian type II event based on size and magnitude (both higher for the sub-Plinian type I) and on the dispersal of PDC
140
deposits (within 2/3 km and 8/9 km from the vent for the sub-Plinian type II and type I, respectively). The AD 472 Pollena
141
eruption wascharacterized by volumetrically important PDCs (0.15 km3; Sulpizio et al. 2007) and by a sustained phase
142
which, unlike the Plinian case, is interpreted to have been dominated by an instability in magma discharge. Sulpizio et al.
143
(2007) subdivided the eruption into three main eruptive phases according to inferred changes in the eruptive processes
144
and/or changes in melt composition. The PDC deposits are associated with the last two eruptive phases, including the PDC
145
deposits of unit Fg (Sulpizio et al. 2005), whose physical parameters have been here calculated. During the eruption, the
146
formation of PDC might have been related to partial or total collapses of the convective column responsible for the
147
deposition of the two preceding fallout units (L8 and L9; Sulpizio et al. 2005). Deposition of the Fg unit of the AD 472
148
Pollena eruption (Fig. 2c) was generally strongly controlled by topography, with massive to stratified, lapilli-bearing, ash-
149
and lithic-rich deposits and only minor, cross-laminated to dune-bedded deposits. The thickness varies from a few tens of
150
cm up to 7 m. Lithofacies in Fg units consist of massive, valley-ponded lapilli tuff with few examples of crudely stratified
151
ash deposits at the bottom of this lithofacies (Sulpizio et al. 2007). Sedimentological features suggest that deposition
152
occurred from a highly concentrated, granular to fluid-escape dominated underflow at the base of a thick, short-lived,
153
rapidly depletive current (Sulpizio et al. 2007).
154
155
3. Datasets
156
Field data for each of the studied PDC deposits are here used for extracting quantitative physical parameters. We
157
focus on the quantitative assessment of the following parameters and of their inherent uncertainties: (1) maximum runout
158
distance; (2) flow invaded area; (3) volume of the deposit; (4) total grain size distribution of the PDC.
159
Because a standardized protocol is not available for the quantification of these parameters for PDC deposits, we
160
compare results obtained through the application of different methods. Samples and measurements refer to a total of 243
161
stratigraphic sections (Fig. 3), either partially unpublished or taken from published studies (Cioni et al. 1992; Gurioli 1999;
162
Gurioli et al. 1999; Tadini et al. 2017b). Data on stratigraphic sections, samples and density measurements of the deposits
163
are available in the Supplementary Material section (Online Resources 1, 2, 3 and 4) and shown in Figure 3 and Online
164
Resource 5. The three PDC deposits, which vary terms of transport and depositional mechanics, dispersal area and geometry
165
and grain size, allow us to discuss the general applicability and reliability of the different methods and to compare the
166
associated uncertainties.
167
168
4. Methods and Results
169
We first present the rationale and the methods used for estimating each different parameter and the related
170
uncertainty, followed by the results for each deposit. We stress that each unit required different methods to estimate its
171
parameters.
4.1 Maximum runout and invaded area
173
In this paper, maximum runout refers to the distance attained by a laterally moving current, and does not include,
174
for example, distal co-ignimbrite ashfall layers. The problem of tracing the maximum runout of a PDC has not been
175
previously addressed in detail (Burt et al. 2001). Recently, Gurioli et al. (2010) estimated the maximum runout of PDCs
176
associated with Plinian and sub-Plinian eruptions at Somma-Vesuvius through the definition of two parameters: the farthest
177
outcrop distance (the farthest point at which the PDC deposit can still be unambiguously identified); and the maximum
178
runout (the theoretical distance covered by the PDC before it stopped). Ideally the two distances would coincide in the case
179
the deposit is completely preserved and fully accessible to investigation. However, the authors underline also that in cases
180
where the distribution of distal deposits is poorly constrained (particularly for the older eruptions), true maximum runout is
181
likely is greater in distance than the most distal outcrop. To overcome this ambiguity in the definition of maximum runout,
182
we suggest to: 1) position a line of maximum runout (MRL) that is based on field data and the sedimentological features of
183
the deposits; 2) introduce an estimation of the uncertainty on MRL position, following a simplified procedure of expert
184
judgement to reach consensus between different authors. A similar, simpler approach was adopted by Neri et al. (2015) by
185
placing a buffer on the deposit boundary with constant range estimated by expert judgment.
186
We structured the procedure for the definition of the MRL (and of the related maximum invaded area - MIA) upon
187
a sequence of spatial constraints. In particular, in order of decreasing relevance: i) the position of the minimum observed
188
thickness of the deposit (as directly measured in the field); ii) the presence of topographic obstacles that could have limited
189
PDC propagation area; iii) the general areal extent of still preserved deposits as derived from available geological maps; iv)
190
the position of the stratigraphic sections still preserving deposits of the target eruption but which lack the deposits of the
191
PDC of interest. Given the intrinsic uncertainty in defining the exact position of MRL, we adopt a procedure by which three
192
different positions for the MRL are traced: a median (or “best guess”) value of this parameter for the specific unit
193
investigated (the 50th percentile outline – MRL
50) and two uncertainty bounds (the 5th and the 95th percentiles, that are
194
MRL5 and MRL95) that take into account the epistemic uncertainty associated with the incomplete knowledge of the deposit.
195
In other words, while the MRL50 is defined through the critical analysis of the four different geologic constraints listed
196
above, the MRL5 and MRL95 percentile curves define an uncertainty belt for the maximum runout estimation and represent
197
the lines having respectively 5% and 95% of probability not to have been overstepped by that PDC. MRL50 was traced at an
198
average downcurrent distance no further than 500 m from those stratigraphic sections with the smallest measured thickness.
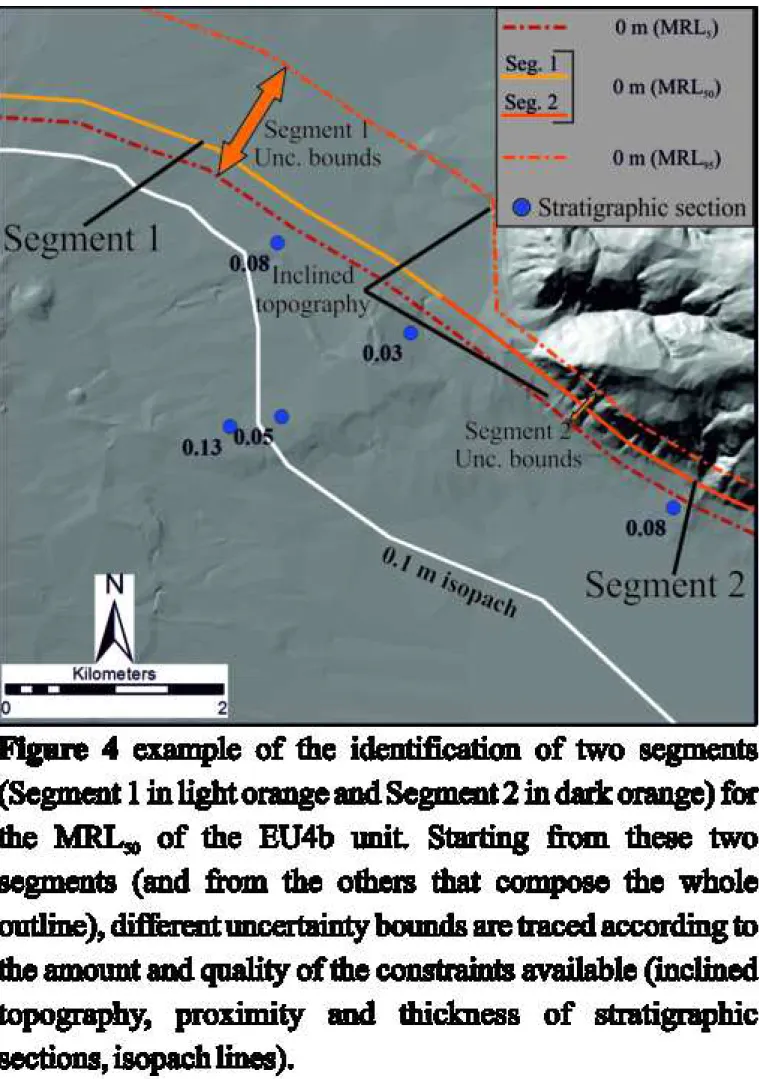
199
When tracing the MRL50, different segments of the line are distinguished and associated with sectors for which the available
200
geological constraints on PDC runout have different degrees of confidence (Fig. 4).
201
Once defined, the segments (and sectors), for each of the upper and lower uncertainty bounds (respectively
202
corresponding to the position of the MRL5 and MRL95) are evaluated. This is a significant novelty compared to the
203
procedure applied by Neri et al. (2015), where the MRL and its uncertainties were defined without any preliminary
204
distinction in segments. In this study, four different uncertainty bounds (in terms of distance from the MRL50) were applied
205
and linked to the maximum runout distance reached within the MRL50 for each unit. Low, moderate, moderate-high and
206
high uncertainty were estimated in terms of a percentage of the distance with respect to the vent of the maximum runout
207
distance of the MRL50, and corresponding to, respectively, 10%, 5%, 2.5% and 1% of this distance. The distance between
208
the MRL5 and MRL95 is small in cases of sectors with strong geological constraints, while it is larger for those areas where
209
few outcrops were observed. Conversely, the distance between the MRL50 and MRL95 lines has a maximum also for those
areas where the thickness of the deposit is more than 1 m (i.e., they do not represent the maximum runout of the PDC). For
211
all these reasons, upper and lower uncertainty values for a single segment of the MRL50 might be the same (e.g. lower
212
bound might be -200 m while the upper might be +1000 m with respect to the position of the MRL50) depending on the
213
number of constraints available.
214
The choice of the uncertainty bounds for each segment is based on a simplified “expert judgment” procedure
215
among the authors of the paper. Although our approach is not structured, as in similar studies (e.g., Selva et al. 2012;
216
Bevilacqua et al. 2015; Tadini et al. 2017a) it involved a detailed discussion about all the sources of uncertainty for each
217
segment, detailed in the following, until a consensus was reached about the attribution of the uncertainty bounds. On the
218
contrary, the uncertainty range was enlarged in cases of discordant views. Based on the comparison with the studies
219
referenced above, we do not expect that involving other experts will have a large modification on the results, unless new
220
data or assumptions are introduced into the discussion.
221
In summary, the MRL5 always represents the line closest to the farthest (and thinnest) deposit measured in the
222
field. MRL95 approximates the maximum expected runout of a given PDC, based on the critical consideration of all the
223
geologic constraints that can be used in the expert judgement. In this study we provide three percentile constraints
224
representing an unspecified probability distribution; this approach is a common practice in expert judgement techniques
225
(although with differences in distribution types; Cooke 1991; Flandoli et al. 2011), but has been rarely adopted in spatial
226
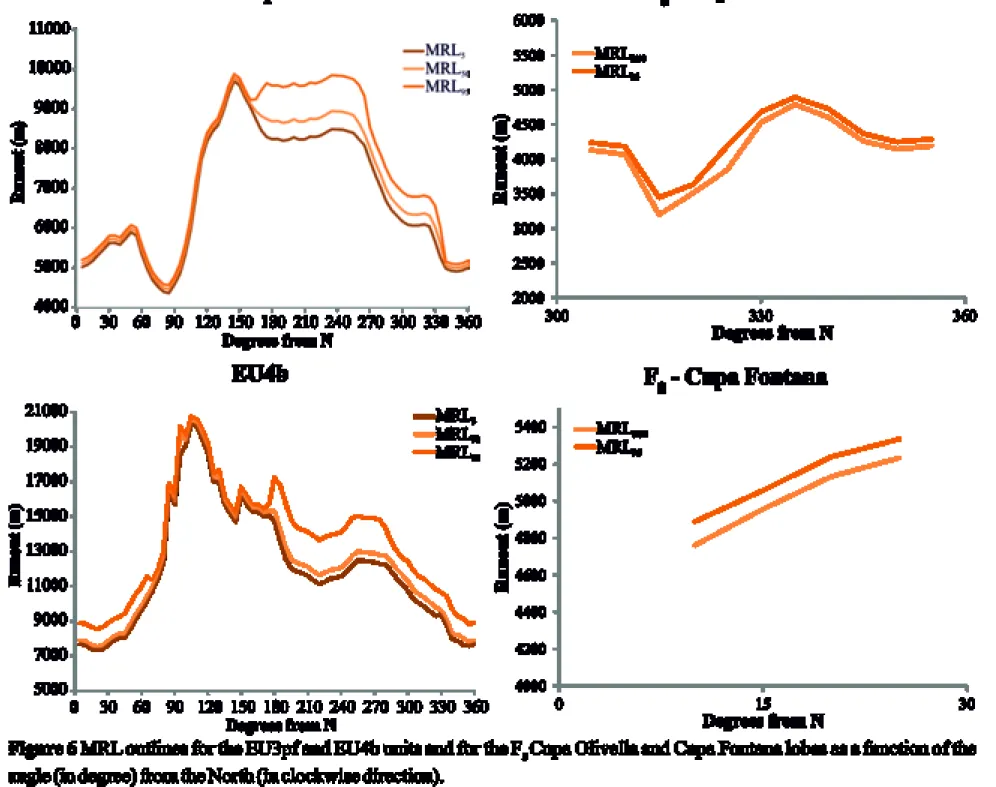
mapping problems (see for instance Bevilacqua et al. 2015; Neri et al. 2015; Bevilacqua 2016). Diagrams that illustrate the
227
preferred directionality in the dispersal of the deposits are given in Fig. 6, where the variation of the distance from the vent
228
of the MRL for the different studied deposits (and for each of the three isolines traced) is given as a function of the
229
azimuthal angle with respect to the north. The definition of MRL (and related uncertainty) easily allows us to calculate the
230
maximum invaded area (and related uncertainty – Table 1) as the area included within each single MRL.
231
232
4.1.1 AD 79 EU3pf
233
The maximum runout distance (MRL50) for EU3pf is around 9 km, and therefore the low, moderate, moderate-high
234
and high uncertainty values are, respectively, 90, 275, 450 and 900 m. The MRL50 is composed of three segments, each with
235
different uncertainty (Fig. 5a) and identified in Figure 5a with different numbers. Part 1 of MRL50 corresponds to the
236
segment toward the N, NE and SE with respect to the vent location. This segment is well constrained by numerous
237
stratigraphic sections where EU3pf is only few centimeters thick, so that the uncertainty on MRL position is low (MRL5 –
238
90m; MRL95 +90m). Part 2 of MRL50 represents the inland part toward NW. In this case, the constraints are represented by
239
only a few stratigraphic sections located to the NNW, where the thickness of EU3pf is of the order of few meters, and the
240
related uncertainty on the position of the MRL has been considered moderate to high (MRL5 –275m; MRL95 +450m). Part 3
241
of MRL50 constitutes the seaward part. No constraints are available here except for a few stratigraphic sections near the
242
coastline where thicknesses are of the order of several meters, making the related uncertainty notably high (MRL5 -450m;
243
MRL95 +900m). The MRL50 (Fig. 6) varies for the different sectors, passing from about 4 km for the eastern sector, to about
244
9 km for the south-eastern sector.
245
246
247
248
4.1.2 AD 79 EU4b
249
For the EU4b unit, the maximum runout distance of the MRL50 is 20 km, and therefore the low, moderate,
250
moderate-high and high uncertainty values are, respectively, 200, 500, 1000 and 2000 m. The definition of the maximum
251
runout for the EU4b unit is based on stratigraphic information and on paleo-topographical constraints. EU4c was not
252
considered in terms of maximum runout as only a very small part of it can be related to deposition from a laterally moving,
253
highly dilute current, whereas most of this unit was related to fallout deposition from a convective, co-ignimbritic plume.
254
We have however performed a rough estimation of the area affected by deposition of unit EU4c (using information from
255
Gurioli 1999) to be used in the following as the integration limit for the calculation of the total grain size distribution of the
256
eruptive mixture (see section 4.3.2). In order to define the extent of the MRL5 and MRL95, the MRL50 of EU4b unit was
257
divided into 4 different segments (Fig. 5b). Part 1 of MRL50, representing the inland part toward S and SE, is associated
258
with a narrow zone of uncertainty (MRL5 –200m; MRL95 +200m), resulting from the presence of quite robust constraints
259
onto the 10 cm isopach (Gurioli et al. 2010) and by the proximity of the MRL50 to the steep northern slopes of the Sorrento
260
peninsula (to the SE) and of the Apennines (to the E). Part 2 of MRL50 corresponds to the seaward part. For this segment
261
(which is has the highest uncertainty) there is evidence that the PDCs travelled at least 5-7 km across the sea, and reached
262
the paleo-coastline of the Sorrento peninsula at the S. Maria di Pozzano site (section 203; see Figs. 3 and Online Resource
263
1). For this reason, the MRL50 in this sector has been placed at an average distance of 5 km off the coastline and associated
264
with high uncertainty (MRL5 –500m; MRL95 +2000m). Part 3 of MRL50 represents the inland part toward NW. No strong
265
stratigraphic (nor topographic) constraints are present here; for these reasons, the uncertainty is moderate-high (MRL5 –
266
500m; MRL95 +1000m). Part 4 of MRL50 is constituted by the inland part toward N. A stronger constraint here is the
267
position of the 10 cm isopach (Gurioli et al. 2010). As a consequence, uncertainty in maximum runout can be considered
268
moderate in this sector (MRL5 –200m; MRL95 +1000m). Maximum runout distance occurs in the ESE sector, where the
269
PDC reached around 20 km from the vent, while in the northern sector, where the initial path of the PDC was possibly
270
shielded by the high Mt. Somma scarp, the current travelled not farther than 7-8 km (Fig. 6).
271
272
4.1.3 AD 472 Fg
273
The Fg unit of the AD 472 Pollena eruption is dispersed in multiple lobes in different sectors of the volcano. In this
274
study, two different lobes (i.e. the Cupa Fontana and Cupa Olivella; Fig. 5c) have been traced separately and used for the
275
definition of the maximum runout. Due to the scarcity of measurable outcrops, several cross-sections were traced through
276
points of measured thickness. Along the cross-sections, the thickness was extrapolated taking into account
paleo-277
morphology of the substrate (as resulting from field observations) and assuming a horizontal upper surface of the deposit.
278
Additional information was also derived from the geologic map of Sbrana et al. (2020). This resulted in a significantly
279
larger set of measured and extrapolated data, used to constrain both isopachs and maximum runout isolines for the two lobes
280
(Fig. 5c; the complete list of “Measured” versus “Interpolated” thicknesses is provided in Online Resource 4).
281
In contrast to the outlines traced with mainly unpublished data for the two AD 79 PDC units, the MRL50 was
282
drawn by simply considering the outline of the preserved deposit of the AD 472 Pollena PDC units in this area. This
283
approach was preferred over the previous one due the nature of the deposits that clearly derived from a highly concentrated,
284
rapidly depletive current. Such currents generally pass to en-masse deposition at their distal ends, and terminate with
steep-285
sided lobes up to decimeters thick (Branney and Kokelaar 2002). Thus, the farthest measured outcrop in this case is at the
same time a good approximation of both the best guess and the minimum value to be considered for runout. Consequently,
287
the MRL5 and the MRL50 are considered in this case as coincident. The MRL95 has been placed at a constant distance of
288
+200 m with respect to the MRL50, as the thicknesses of both the Fg Cupa Fontana and Cupa Olivella PDC lobes in the
289
stratigraphic sections close to the MRL50 are of the order of only few centimeters. This distance corresponds to an
290
uncertainty between moderate (2.5% of maximum runout distance within MRL50) and moderate-high (10% of maximum
291
runout distance within MRL50), since the average MRL50 is in the range of 5 km from the vent (Fig. 6), both for the Cupa
292
Fontana and the Cupa Olivella lobes.
293
294
4.2 Volume estimation
295
In contrast to large-volume PDC deposits (see for example Scarpati et al. 2014), estimating the volume of small- to
296
intermediate-volume PDC deposits is a more difficult task, mainly because deposition from parent PDCs is more strongly
297
controlled by preexisting topography and cannot be described through a general decay law of thickness that can be
298
integrated over area (or distance). In addition, the volume of the PDC deposits does not coincide with the volume of the
299
solid phase transported in the moving PDC, due to redistribution of fine material between the horizontally moving current
300
and the associated co-ignimbrite plumes. However, the volume of the deposits provides the best proxy for calculating the
301
solid mass transported by the PDC, as long as uncertainty is explicitly assessed (Sulpizio et al. 2005; Gurioli et al. 2010).
302
Apart from a few examples (Isaia et al. 2004), there is still no general consensus about the best procedure for volume
303
estimations of small-scale PDC deposits. To address this problem, in this work six different approaches (summarized in
304
Table 2) have been used and the results compared to each other. Such approaches have been previously applied mainly to
305
tephra fallout deposits (Pyle 1989; Fierstein and Nathenson 1992; Bonadonna and Houghton 2005; Bisson and Del Carlo
306
2013) and to debris avalanche deposits (Crandell 1989).
307
Table 3 reports the percentages of area (with respect to the total dispersal area) enclosed in the MRL50 which
308
pertains to each of the three slope classes for all the PDC deposits here considered. Epistemic uncertainty on volume
309
estimation is mainly based on the lack of direct knowledge about the real extent of the PDC dispersal. This uncertainty has
310
been included in the following only for the case of the TIN method using the three different maximum runout lines (MRLs)
311
defined for each unit, considering the area enclosed by the MRL50 as representative of the expected measure of deposit
312
dispersal.313
314
4.2.1 AD 79 EU3pf315
The dataset used for volume calculations of EU3pf unit consisted of 106 stratigraphic sections (Online Resource
316
1), while information on 0 m thickness is extracted from the different MRLs. The areal coverage of stratigraphic sections is
317
moderately dense in the northern sector, due to the presence of numerous valleys and road cuts. Using the thickness values,
318
segments of three different isopachs were also drawn (Fig. 5a) and used for volume calculations.
319
Four different methods (CRh, CRs, VOR and TIN; Table 2) were used for estimating the volume of this unit; three
320
of these (CRh, CRs, VOR) were used to calculate volume within the MRL50 only, while for TIN method the volume was
321
calculated considering the deposit enclosed by the MRL5, MRL50 and MRL95, in order to estimate the uncertainty on the
322
measure.
The sectors for the application of methods CRh and CRs were defined as follows: (1) for the CRh method, EU3pf
324
deposit was divided into four areas, corresponding to different fans in the NW, NE, SE and SW sectors of the volcano (and
325
mainly related to the paleotopography; Fig. 5a); (2) for the CRs method, EU3pf deposit was divided into three sectors using
326
the three different slope classes defined in Table 3. The VOR method was applied to the total dataset of available thickness
327
data. The uneven distribution of the points, and especially the lack of points in the proximal (less than 4 km distance from
328
the vent) and in the eastern sectors, imply the tracing of very large Voronoi cells, resulting in a low reliability to the volume
329
estimate. In the application of the TIN method, the EU3pf deposit was further subdivided into a northern and a southern
330
zone (Fig. 5a) in order to account for the blocking effect of the Mt. Somma scarp, and separated volumes were calculated
331
accordingly.
332
All volume estimations are shown in Table 4. With respect to the TIN estimations, it is evident how the two sectors
333
(N and S) have substantially the same volume of deposit. Results show that the sectorialization CRs methods tend to
334
produce volume estimates up to 40% higher with respect to the TIN method. Even larger estimates (50% larger with respect
335
to the TIN method) derive from the use of VOR method. Uncertainty on volume estimation based on the TIN method (as
336
calculated respect to the uncertainty on the invaded area) is slightly asymmetric with respect to the median value (-19% and
337
+28%), and well below the differences with respect to the volume values obtained with the other methods.
338
339
4.2.2 AD 79 EU4
340
For the EU4 unit, volume was assessed in a detailed way only for EU4b (Table 5), as this is the only bed that can
341
be directly related to deposition from a PDC. For this estimate, a total of 102 stratigraphic sections were used (Fig. 5b).
342
Thickness data were used to trace 7 isopachs, from 0.1 m to 4 m (Fig. 5b). Volume of the EU4b unit was estimated
343
following methods CRs, TR, PY, VOR and TIN (Table 2). An estimation on the volume for unit EU4c was also performed,
344
in order to refine the calculation of the TGSD of the collapsing mixture (see section 4.3.2), and to estimate the relative
345
amount of material. This estimation (0.034 km3) was performed using the TIN method and the outline of Fig. 7c as
346
integration limit.
347
As for the EU3pf, methods CRs and VOR give the highest volume estimates, respectively, of 90% and 70% higher
348
with respect to the volume calculated using the TIN method. Volumes estimated with method TR and method PY (with two
349
segments approximation) are only slightly higher (+24% and +15% respectively) than that from the TIN method. Due to the
350
integration up to an infinite area of method PY, the result of this calculation could represent a maximum value for the
351
volume of the deposit. Finally, the TIN method was applied to calculate the volume using points on the three MRLs as
zero-352
thickness points, in order to have an estimation of the uncertainty related to the maximum dispersal area, which is however
353
moderately low (Table 5). The small uncertainty in the calculation of volume derives from the continuous and nearly regular
354
thinning with distance of the EU4b deposit, with low values of thickness measured at the most distal sites.
355
Because of the asymmetric dispersal of the EU4b deposits (the maximum runout distance for the southern
356
quadrants is larger on average with respect to that for the northern quadrants; Figs. 5b and 6) the deposits have been
357
subdivided into two distinct areas: NW and SE. These partitions were defined by drawing a straight line (dashed green line
358
in Figs. 5b and 7b) perpendicular to the axis of maximum elongation of the deposit (oriented roughly NW-SE). Despite the
359
larger area of the SE sector with respect to the NW, the volume results are more or less evenly distributed between the two
sectors (60% vs. 40%, respectively; Table 5), due to the generally lower thickness of the deposits of the SE sector, which is
361
probably related to the gentler slope and lower topographic roughness.
362
363
4.2.3 AD 472 Fg
364
Volume estimations for the two Fg PDC lobes from the AD 472 Pollena eruption utilized a total of 27 stratigraphic
365
sections (6 measured and 21 interpolated), and 31 sections (12 measured and 19 interpolated) for the Cupa Fontana and
366
Cupa Olivella, respectively. Thicknesses range between 1 cm and 4.8 m. Volumes were calculated with methods CRs, VOR
367
and TIN (Table 2), all referred to the MRL5/50 (Table 6).
368
The deposits volumes for these very restricted lobes are small: an order of magnitude lower than those calculated
369
for EU4b. This possibly reflects the lower intensity of this eruption with respect to the AD 79 eruption. Relative uncertainty
370
in the estimate is related to the extent of the invaded area which was evaluated by comparing the volumes within the
371
MRL5/50 and the MRL95 with the TIN method. This uncertainty is however of similar magnitude to the two larger PDC
372
deposits, and varies from 10% to 17% of the estimated volume (for the Cupa Fontana and Cupa Olivella lobes,
373
respectively). As for the other two cases discussed above, the lower volume values are returned by the TIN method, while
374
the use of the CRs method results in values nearly double those derived from the TIN method. The volume calculated with
375
the VOR method gives higher, but largely variable, values with respect to the TIN method (30% and 80% respectively, for
376
the two lobes). This is possibly related to the low number of sites available for measuring thickness in the field, which are
377
generally restricted to the upstream part of the two lobes and have high thickness values.
378
379
4.3 Total Grain Size Distribution (TGSD)
380
The Total Grain Size Distribution (TGSD) of PDC deposits represents an important parameter for the
381
understanding of physical processes involved in transport and deposition from these currents and for numerical modeling
382
related to hazard assessment. In this study, we applied and compared two methods for TGSD calculation (Table 7): (1) the
383
Voronoi tessellation method (Bonadonna and Houghton 2005), using as the integration limit the MRL50 for units EU3pf,
384
EU4b and Fg (Fig. 7); (2) the Walker (1980) method (referred to from now on as “isomass method”) integrating the
385
resulting plot of mass per area for each grain size class Φ (M/A Φ) vs. the square root of the area (A1/2) of each isomass
386
curve through the formula of Fierstein and Nathenson (1992). Grain size analyses were performed in the interval -4Φ to 5Φ
387
at 1Φ interval. For stratigraphic sections with more than one sample, the average grain size of the section was calculated by
388
averaging all the grain size analyses of samples collected at that section. Density values for the PDC deposits were directly
389
measured on several samples. In the supporting information we are providing the following detailed data: (1) grain size
390
analyses for all units (Online Resource 2); (2) deposit density measurements (Online Resources 3 and 4); (3) distribution of
391
stratigraphic sections for all units (Online Resource 5); (4) TGSD numerical values and subpopulations data (Online
392
Resource 6) and; (5) isomass maps for units EU4b and EU4c (Online Resources 7, 8, 9, 10). TGSD data are generally
393
polymodal, and in many cases the classical grain size distribution parameters are not appropriate to fully describe the whole
394
distribution. For this reason, TGSD data have been deconvoluted into multiple Gaussian subpopulations (SP) using the SFT
395
software (Wohletz et al. 1989), and for each subpopulation the median value, the standard deviation and percent by weight
396
with respect to the total sample have been calculated. Due to the lower limit of the sieving (5Φ), one SP was arbitrarily
placed around this diameter, and the median value of this should be considered as “finer than 5Φ”. In the studied examples,
398
this fine-grained SP represents from 1 to 15 % of the total.
399
The calculated TGSDs for the PDC deposits, whatever the method used, are only representative of the lapilli to
400
coarse ash fractions of the original pyroclastic mixture carried by the PDC. Estimation of the finer-grained fractions is
401
complication by elutriated by ash production by clast comminution and abrasion during the transport. Here, we attempted to
402
estimate the contribution to the TGSD of the elutriated ash deposited from the co-ignimbrite cloud for the EU4 unit using
403
data for EU4c sub-unit. Table 7 summarizes the information related to TGSD estimation for all the studied units.
404
405
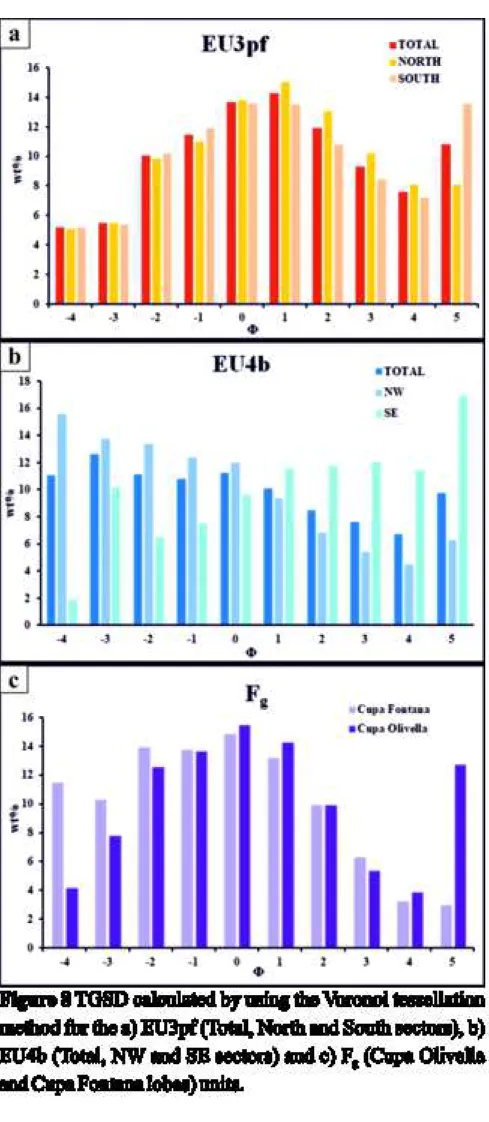
4.3.1 AD 79 EU3pf
406
TGSD was calculated for this unit only using the Voronoi method, as no simple fit was possible on an ln M/A Φ vs.
407
A1/2 plot for using the “isomass method”. As in the case of the volume calculation, TGSD was calculated both for the total
408
deposit (Fig. 7a), and for the N and S sectors (separated by the green dashed line of Fig. 5b) for the same reasons. TGSD for
409
the different sectors are however nearly coincident (Fig. 8a), the main difference being related to a larger (around 5%)
410
amount of fine ash (Φ > 5) in the deposits dispersed to the south. Resulting total TGSD is nearly unimodally distributed,
411
with a main mode at 0.5Φ representing around 92 % of the total (Online Resource 6). F1 value (wt. % of ash finer than 0 Φ;
412
Walker 1983) is around 40 %, while F2 (wt. % of ash finer than 4 Φ; Walker, 1983) is slightly more than 10 %.
413
414
4.3.2 AD 79 EU4
415
EU4 represents an unusual case in which both the deposits of a PDC (EU4b unit) and those of the associated
co-416
ignimbrite cloud (EU4c unit) can be recognized and mapped in the field. For this reason, it was possible to estimate the
417
TGSD for the two units, the weighted sum of which (EU4b/c) can be considered a good approximation of the TGSD of the
418
pyroclastic material in the collapsing column. The distribution of the sections and the related Voronoi polygons used for the
419
TGSD estimations for EU4b and EU4c are shown in Fig. 7b and 7c respectively.
420
TGSD with the Voronoi method for the EU4b unit is shown in Fig. 8b, both for the whole deposit and for the NW
421
and SE sectors. The results from the two sectors are very different, with TGSD for the SE sector being more fines-rich
422
compared to the NW sector: the value of F1 in the SE is nearly double respect to that in the NW). When integrated with
423
respect to the mass distributed over the two sectors, the TGSD results are strongly platykurtic and polymodal.
424
The comparison of TGSD of EU4b (Fig. 9) calculated with the different methods suggests that: (1) the Voronoi
425
tessellation method tends to estimate a lower amount of fine materials with respect to the isomass methods; (2) the
426
estimations, performed by integrating different approaches to the isomass maps, show an irregular distribution with a
427
marked polymodality (4 main subpopulations; Online Resource 6).
428
The dispersal outline used for tracing the isomass maps is the same used in section 4.2.2 for volume calculations.
429
TGSD is strongly asymmetric, with a main mode between 2.5 and 3.8Φ (Online Resource 6) and more than 90 wt% of ash
430
finer than 0 Φ. The total mass of EU4c, which represents around 10% of the mass of EU4b, was calculated by multiplying
431
the mean density of the deposit (Table 7) by the estimated volume of EU4c (see section 4.2.2). Summing up the TGSD data
432
of EU4b and EU4c units, after weighing for their total mass, we obtained a TGSD (EU4b/c) that can be considered
433
representative of the distribution of the erupting mixture ejected from the vent. This latter is characterized by a very poorly
434
sorted, polymodal distribution, with at least 4 subpopulations (Fig. 9c; Online Resource 6). With respect to the TGSD of
Fig. 9, it should be specified that at the current stage the position of the mode at the Φ=5 size should be considered an
436
artifact, as data for the Φ=5 class represent a total of all the grain sizes finer than that class.
437
438
4.3.3 AD 472 Fg
439
Given the limited dispersal and the very similar facies characteristics of the deposits throughout their dispersal, the
440
TGSD for the Cupa Fontana and the Cupa Olivella lobes was tentatively estimated only through the Voronoi method (Fig.
441
7d).
442
TGSD for both of the lobes are shown in Fig. 8c. It is evident the similar modal value for the two lobes (between 0
443
and -0.6 Φ; Table 5SM), and the more fines-rich nature (F1=32%) of the Cupa Olivella with respect to the Cupa Fontana
444
lobe (F1=23%), are possibly related to the availability of samples from more distal sites in the former (Fig. 7d).
445
446
5. Discussion
447
Estimating the natural variability and related uncertainties of physical parameters like maximum runout distance,
448
volume, and total grain size distribution of PDC deposits is complicated due to the intrinsic variability of dispersal and
449
sedimentological characteristics. Any study with these goals must begin with a detailed field analysis of the lithofacies
450
associations in the deposits (Branney and Kokelaar 2002; Sulpizio and Dellino 2008), in order to select the most appropriate
451
methods for the calculation of these parameters. Many field measurements (thickness of different units, density of the
452
deposit) and samples should be collected, especially from areas where the PDC was emplaced over rugged
453
paleotopography. The three cases discussed above for Somma-Vesuvius represent a range of PDC types, allowing us to
454
infer the main factors controlling their main parameters (volume, invaded area, runout distance and TGSD), to statistically
455
compare the methods for their estimation, and to quantify, for the first time, a comprehensive range of these parameters for
456
different PDC deposits that will be useful for future application of numerical models and hazard assessments at the volcano.
457
We think that the goal of a robust reconstruction of the properties of past PDC is not in contradiction with the presence of
458
uncertainty and it should deal with it specifically.
459
460
5.1 MRL and MIA estimations
461
Estimation of maximum runout and invaded area (MRL and MIA, respectively) define the possible area impacted
462
by a PDC. Several considerations can be made with respect to the methods for the definition of the maximum runout
463
outlines of past events based on incomplete stratigraphic records. While the occurrence at distal sites of thin PDC deposits
464
can be used for assessing minimum runout distances, it is difficult to constrain the distance at which the related PDC
465
actually stopped and/or lifted off based solely on deposit evidence (Andrews and Manga 2011). Thus, the rationale used for
466
constraining MRL and MIA varies on a case by case base.
467
The topography surrounding Somma-Vesuvius exerts a first-order control on maximum runout. This is especially
468
true in the case of PDCs with a runout of at least 10 km where low values of the thickness of the deposit coincide with the
469
onset of a positive gradient in the local topography. Areas with the highest degree of uncertainty in maximum runout are
470
those located in sectors where stratigraphic information is confined to proximal sites or where the PDCs entered the sea.
471
Documented cases elsewhere show that PDCs can either travel long distances over the water, or stop rapidly (Carey et al.
472
1996; Cole et al. 1998). The presence of EU4b deposits on the northern side of the Sorrentina peninsula (Figs. 1 and 3;
Cioni et al. 1992) is direct evidence of the ability of the PDC to travel over the sea for at least 7-8 km, passing across the
474
Gulf of Napoli (Fig. 1). Evidence for dense, granular PDCs entering the sea is reported for the AD 1631 sub-Plinian
475
eruption (Rosi et al. 1993): numerous paintings (e.g. Giovan Battista Passeri, “Vero disegno dell’incendio del mons Vesuvii
476
1631”) illustrate PDCs stopping only a few hundred meters after entering the sea. Definition of the maximum invaded area
477
and hence of the maximum runout lines for this side of the volcano for our study cases is consequently largely inferred.
478
Since in all these cases there is a large uncertainty in the position of MRL, the need for a quantitative range justifies the
479
application of expert judgement techniques to deal with it (Neri et al. 2014, 2015).
480
Additional information for the definition of the maximum runouts and of their uncertainties could be derived from
481
observations on PDC deposits. For those related to concentrated PDCs (AD 472 Fg), topography was the main controlling
482
factor on their dispersal, and topographic features could be used to constrain maximum runouts. For deposits of dilute PDCs
483
(AD 79 EU3pf and EU4b), the steep decrease of thickness with distance implies that the presence of thin (less than 10 cm
484
thick) massive, ash-dominated deposits at distal sites can be interpreted as good evidence of proximity to the maximum
485
runout distance, with a consequent lower uncertainty in its definition.
486
In the absence of direct data, and associated uncertainty, the use of different limits representing the reconstructed
487
maximum runout distance assessed in probabilistic terms (MRL5, MRL50, and MRL95) appears an effective way to quantify
488
the uncertainty on the estimate of this parameter. The position of the upper and lower uncertainty bounds are more
489
amenable to expert judgement.
490
As a consequence of large uncertainty in estimating maximum runout, estimates of the invaded area (MIA) are also
491
uncertain. The selected examples entail a wide variation, with MIAs varying from less than 10 km2 (in case of AD 472 F g
492
lobes) up to more than 500 km2 (in the case of AD 79 EU4b). Uncertainty is generally not symmetric with respect to the
493
reference value (MIA corresponding to the MRL50), and is generally lower for the lower bound (varying from 0 to 14%
494
relative) and larger for the upper bound (from 14 to 30%). Total uncertainty on area is however estimated around 15-20%
495
for the two small lobes of Fg, while it varies between around 25 and 40% for the widespread deposits related to
turbulence-496
dominated PDC (EU3pf, EU4b). We suggest that these percentages should be considered as first-order reference values for
497
uncertainty when assessing the area invaded by a PDC, especially in studies related to emergency planning.
498
499
5.2 Volume estimation
500
The evaluation of the volume of a PDC deposit is the first, necessary step to define the mass of magma (and
501
possibly non-juvenile material) dispersed by a PDC and is a fundamental parameter needed to physically describe and
502
realistically model the current. The volumes of the different PDC deposits examined here have been estimated using
503
different approaches, and their comparison can provide preliminary estimates of the method-related uncertainty. Due to the
504
non-regular spatial thickness variability of PDC deposits, the different approaches give in general quite different results, due
505
to the implicit differences in the area integration of thickness data. The TIN method represents a simpler way of
506
extrapolating thickness on the basis of a randomly spaced dataset of measured points. This is an advantage in the absence of
507
theoretical models able to derive a physical law for thickness variation with distance. In particular, the TIN method can be
508
also enhanced if, in addition to the measured data, inferred/hypothetical data can be added to the available dataset, based on
509
the observation of the paleotopography and some basic assumptions on the geometry of PDC deposits (see data used for Fg
510
unit). However, the comparison of TIN with other methods is a key to the estimation of the related uncertainty. In particular,