HAL Id: hal-01994861
https://hal.archives-ouvertes.fr/hal-01994861
Submitted on 13 Sep 2019HAL is a multi-disciplinary open access archive for the deposit and dissemination of sci-entific research documents, whether they are pub-lished or not. The documents may come from teaching and research institutions in France or abroad, or from public or private research centers.
L’archive ouverte pluridisciplinaire HAL, est destinée au dépôt et à la diffusion de documents scientifiques de niveau recherche, publiés ou non, émanant des établissements d’enseignement et de recherche français ou étrangers, des laboratoires publics ou privés.
layer of insect cuticle
Michel Mitov, Vanessa Soldan, Stéphanie Balor
To cite this version:
Michel Mitov, Vanessa Soldan, Stéphanie Balor. Observation of an anisotropic texture inside the wax layer of insect cuticle. Arthropod Structure and Development, Elsevier, 2018, 47 (6), pp.622-626. �hal-01994861�
1
Observation of an anisotropic texture inside the wax layer of insect
cuticle
Michel Mitov
a,*1, Vanessa Soldan
b, Stéphanie Balor
b aCentre d’Elaboration de Matériaux et d’Etudes Structurales (CEMES), CNRS, Toulouse, France.
b
Centre de Biologie Intégrative (CBI), Plateforme de Microscopie Électronique Intégrative (METi), CNRS, University of Toulouse III Paul-Sabatier, Toulouse, France.
Highlights
● Although considered isotropic, the wax may exhibit an internal anisotropic texture. ● Nanoscale laminate texture inside the wax of the scarab beetle Chrysina gloriosa. ● Investigation by different electron microscopies, in native or stained samples. ● Discussion on a layer-by-layer deposition of excreted wax.
___________________________________________________________________________
Article history:
Received: 20 September 2018 Accepted: 26 October 2018
Available online: 9 November 2018
*Corresponding author.
2 ABSTRACT
The outermost part of insect cuticles is very often covered with wax, which prevents desiccation and serves for chemical communication in many species. Earlier studies on cuticular waxes have mainly focused on their chemical composition revealing complex mixtures of lipids. In the absence of information on their physical organization, cuticular waxes have been considered isotropic. Her we report the presence of parallel stripes in the wax layer of the scarab beetle Chrysina gloriosa carapace, with a textural periodicity of ca. 28 nm, as revealed by electron microscopy of the transverse sections. Observations at oblique incidence argue for a layered organization of the wax, which might be related to a layer-by-layer deposition of excreted wax. Our findings may lay the foundation for further studies on the internal structure of cuticular waxes for other insects.
Keywords: insect physiology, cuticle, wax, physical organization.
___________________________________________________________________________
1. Introduction
The phylum Arthropoda arose around 550–600 million years ago and is the largest and most diverse phylum in the animal kingdom. The cuticular structures of arthropods have been pivotal to their successful adaptation to the external environment and have been conserved through eons (Cohen, 2016). The insect cuticle is made up of three main layers: the epicuticle, the exocuticle, and the endocuticle (Neville, 1975). The epicuticle is commonly divided into four layers: cement, wax, outer epicuticle and inner epicuticle (Neville, 1975). The outermost layer of the epicuticle is the wax layer for insects which lack cement. Wax generally consists of complex mixtures of lipids including straight-chain, methyl-branched, and unsaturated
3
hydrocarbon components with 21 to 40+ carbons (Howard and Blomquist, 2005). The major sites of hydrocarbon synthesis are the cells associated with the epidermal layer or peripheral fat body, specifically the oenocytes. Newly synthesized hydrocarbons are then transported through the hemolymph by lipophorin (Bagnères and Blomquist, 2010). Wax layer restricts water loss, prevents desiccation (Ginzel and Blomquist, 2016), and may lend superhydrophobic and self-cleaning properties to the cuticle (Nguyen et al., 2014). Importantly, the diversity of hydrocarbons on insect cuticles indicates a significant role in chemical communication where relatively non-volatile signals are required (Howard and Blomquist, 2005). Hydrocarbons serve as sex pheromones, kairomones, species and sex recognition cues, nestmate recognition, dominance and fertility cues, chemical mimicry, primer pheromones, and even maternal cues for the offspring (Blomquist and Bagnères, 2010). The active components that play key roles in chemical communication are likely present on the outer surface (Ginzel et al., 2003), but the mechanism by which wax is transported and deposited onto the surface of the cuticle is poorly documented (Hughes et al., 2011).
The studies on cuticular waxes have largely focused on their chemical composition overlooking their physical structures. In the same time, interrogations about the in situ internal organization of cuticular waxes and hydrocarbons were regularly raised in literature (Gibbs and Pomonis, 1995; Howard and Blomquist, 2005). For example, an understanding of lipid interactions and organizations is essential to understanding the physiological significance of the diversity of lipids and how it may affect functions (desiccation, pheromone behavior) (Gibbs, 1995). The assumption among entomologists is that cuticular waxes are ordered randomly (Neville, 1975; p. 11) inside a layer, and are considered isotropic (Jewell et al., 2007) or amorphous (Vrkoslav et al., 2010). Although the surface of the wax deposit has been known to show spatial heterogeneities in terms of size and shape—like tangled filaments
4
(Waku and Manable, 1981), blooms (McClain et al., 1985), particles or tubular-shaped curls (Nelson et al., 2000), islands (Vrkoslav et al., 2010) or pillars (Nguyen et al., 2013)—their internal organization has not been reported so far. By analyzing the carapace of the scarab beetle Chrysina gloriosa, we report the in situ observation by scanning electron microscopy (SEM) and transmission electron microscopy (TEM), in native and stained samples, of a stripe texture inside the wax layer.
2. Materials and methods
Samples: The cuticle samples including green and silver stripes and corresponding to the
elytra were removed with a razor blade. Two specimens from different countries and collected to years of distance were used. Specimen n°1: Male specimen, collected in Saltillo (Coahuila, Mexico) in July 2009. Specimen n°2: Male specimen, collected at Madera Canyon (Santa Cruz County, Arizona, USA) in July 2014.
Optical micrographs: The details of the elytral surface (Fig. 1B) and of the inclusion (Fig. S7)
were photographed with an Olympus BX51 stereomicroscope equipped with an Olympus DP73 digital camera.
Inclusions for TEM investigations: A small piece of cuticle was embedded in EMBed–812
resin (from Electron Microscopy Sciences) that was then cured at 60 °C for 48 h.
Preparation of samples for SEM: The cuticule sample was not fully embedded in resin (like
for samples used for TEM investigations) but it was glued on the resin lump with the waxy side exposed to the air. In that way, the surface and the cross-section of the cuticle could be observed during the same observation by SEM (Fig. 3). Incidentally, this choice allowed excluding any eventual influence of resin on wax and its intrinsic striated texture since the wax layer was never in contact with resin. A diamond knife of an ultramicrotome (UltraCut S
5
from Reichert) was used at room temperature to make a cross-section in the cuticle by aiming for a smooth transversal surface. This surface was then coated with a 2-nm-thick chromium film for conduction purposes.
Preparation of samples for TEM.—Ultramicrotomy: A diamond knife at ambient temperature
was used to cut 80-nm-thick ultrathin slices with an ultramicrotome UltraCut S from Reichert (Fig. 2 and S1) or Leica UCT. The material was cut perpendicularly to the cuticle surface (cross-sections). Slices were retrieved on 200 mesh Formvar-carbon-coated copper grids.—
The orientation of oblique sections: In order to make sections at an oblique incidence, we
chose to dispose and maintain the oblique fragment of the cuticles in the resin lump in a soft state (before the thermal polymerization significantly begins). After the resin hardened, the inclusion was cut at normal incidence as usual (Fig. S7).—Staining of sections: The samples were stained with UranyLess (brand mixture of lanthanides from Delta microscopy) for 20 to 30 min and with 3% Reynolds lead citrate (from ChromaLys) for 5 min, or with 1% aqueous uranyl acetate (from Electron Microscopy Sciences) for 15 min in Fig. S5. Different staining methods were used to investigate the eventual impact of the staining on the stripe texture and to exclude artefacts.
SEM conditions. Zeiss 1540 XB Crossbeam SEM equipped with a low-energy capable
Focused Ion Beam (FIB) column. WD = 4.9 mm. EHT = 20 kV.
TEM conditions. Jeol JEM–1400 microscope operating at 80 kV equipped with a Gatan Orius
SC1000B CCD camera. Philips CM20-FEG microscope operating at 200 kV equipped with a Gatan Orius SC1000-Model 832 CCD camera (Figs. 2 and S1).
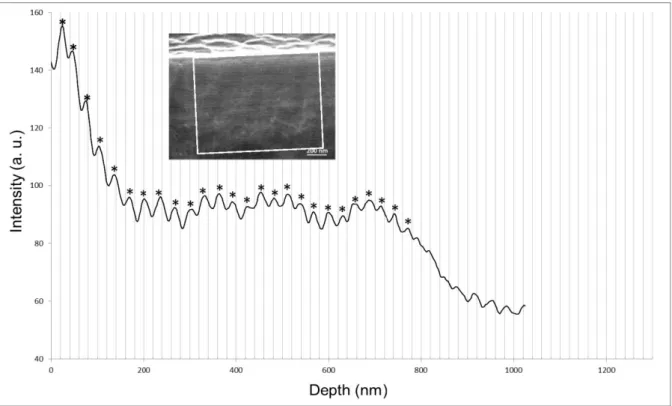
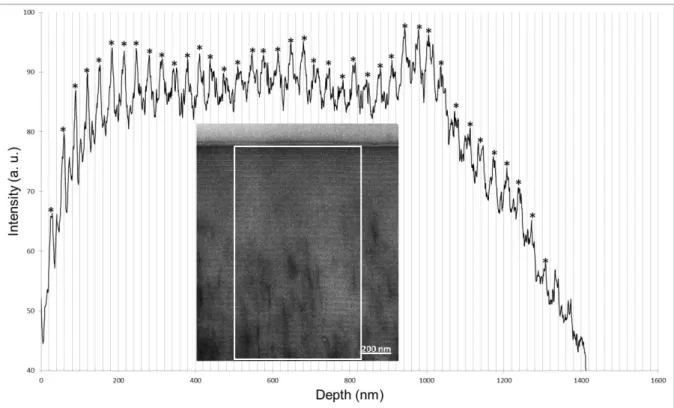
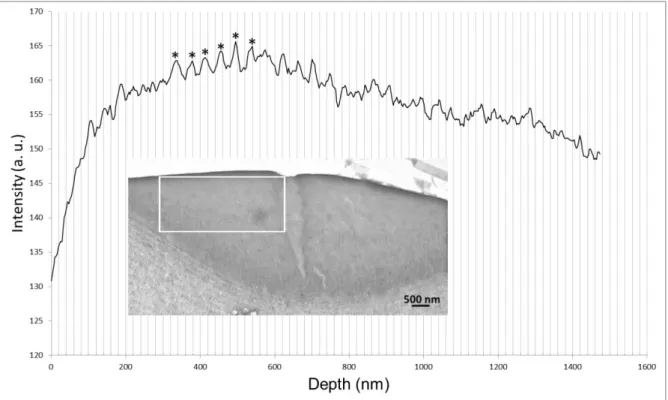
Quantitative image analysis with DigitalMicrograph software from Gatan. The intensities of
the grey levels on a given surface of the images were analyzed using the ‘Profile’ option. These profiles are shown in Figures S2 to S4, S6, S8, S10, S12 and S14, along with an insert
6
corresponding to the surface for analysis. The stars assigned to positive peaks corresponded to stripes of higher intensities with regard to the negative peaks (valleys). The distance between two consecutive peaks corresponded to the distance between two successive stripes of same contrast in the striated texture of the wax layer. Peaks without stars were not chosen for analysis when they corresponded to intensity changes related to the presence of staining agents or to noisy peaks for which the measurement was questionable (especially at the end of the profile, which corresponded to the bottom of the wax cup). The images related to the stained sections generally gave rise to noisier profiles compared to that of the unstained sections (Figs. S2 and S3) due to the presence of staining agents which introduced additional contrast variations.
3. Results
Chrysina gloriosa (Fig. 1A) is a scarab beetle that can be found from southwestern North America to Central America in pine, pine-oak, and juniper forests. The beetles from the genus
Chrysina show vivid iridescence from bright green to metallic silver-gold (Goldstein, 2006).
Owing to their chiral nature, the chitin macromolecules of the cuticle can self-organize into a helicoidal geometry and produce cholesteric liquid crystal structure (pioneering paper: Gaubert, 1924; review paper with many references: Mitov, 2017). As a Bragg medium, the cholesteric structure selectively reflects light and the reflection wavelength is directly proportional to the helicoidal pitch, defined as the length along the twist axis corresponding to a full turn of the molecular director. The cuticle of C. gloriosa exhibits alternately green and silver bands that correspond to selective and broad light reflections, respectively. The green bands have a polygonal texture as observed by optical microscopy (Fig 1B). Each polygonal cell contains a bright yellow core with orange edges surrounded by a dark-green region, with a brighter green rim delimiting the cells. Previous studies on the cuticle of C. gloriosa have reported the cellular structure of concentric rings in the green bands by TEM (Pace, 1972) or
7
by fluorescence confocal microscopy (Sharma et al., 2009), the polarizing properties of the cuticle by Mueller-matrix spectroscopic ellipsometry (Fernandez del Rio et al., 2014), and the existence of an array of multiwavelength micromirrors in green bands (Agez et al., 2017).
Figure 2 shows the cross-sectional TEM view of the different parts of the cuticle in the green band. From the bottom to the top, the cuticle displays parallel stripes in the endocuticle, nested and curved stripes in the exocuticle, and at the interface with the exterior, a wax layer that appears as a series of cups related to the polygonal cells. In the silver band, the stripes in the entire chitinous part of the cuticle are parallel and the wax appears as a flat layer (Fig. 2b in: Agez et al., 2017). For both bands, the distance between two identical stripes in the exocuticle and endocuticle is related to the half-pitch of the helicoidal cholesteric structure.
In situ TEM of 80-nm thick cross-sections of the wax revealed the existence of a striped texture. The contrast was very weak in comparison to the contrast of the periodic stripes displayed by the cholesteric organization of chitin. Whereas the stripe texture could be observed directly, it was difficult to discern in an image captured with a CCD camera (Fig. S1). However, the textural periodicity could be measured after image analysis using the Digital Micrograph software, which provided a mean value of 28 nm (Fig. S2). The observations were confirmed by FIB-SEM with a better contrast (Fig. 3A; a lower magnification view in Fig. 3B). In line with the values calculated from the TEM image, the mean periodicity was equal to 27 nm (Fig. S3).
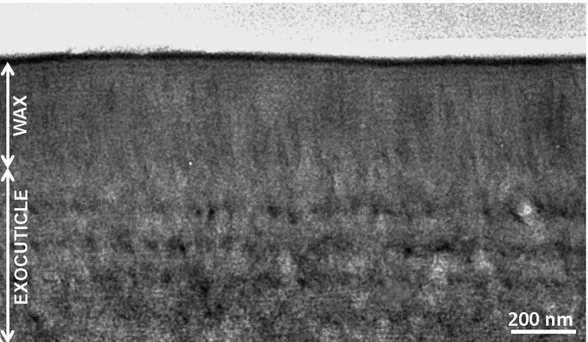
In order to enhance the contrast, the sections were stained and the stripes (Fig. 4B) exhibited a mean periodicity of 32 nm (Fig. S4), larger than that observed in the unstained sections, due to the additional staining agent. This staining procedure also helped observe the stripe patterns down to the bottom of the cups. Vertical filaments that were visible in the wax layer (Fig. 4B) corresponded to the pore canals, also called epicuticular filaments. The pore
8
canals gave the appearance of branching in the wax layer, and each pore canal contained several wax filaments (Neville, 1975; p. 33).
A network of straight stripes was also visible with a weaker contrast in the wax related to silver bands (Fig. S5) with a mean periodicity of 27 nm (Fig. S6), consistent with the wax related to green bands. Without staining, we could not detect them by TEM or FIB-SEM using the same conditions as with the green bands’ wax.
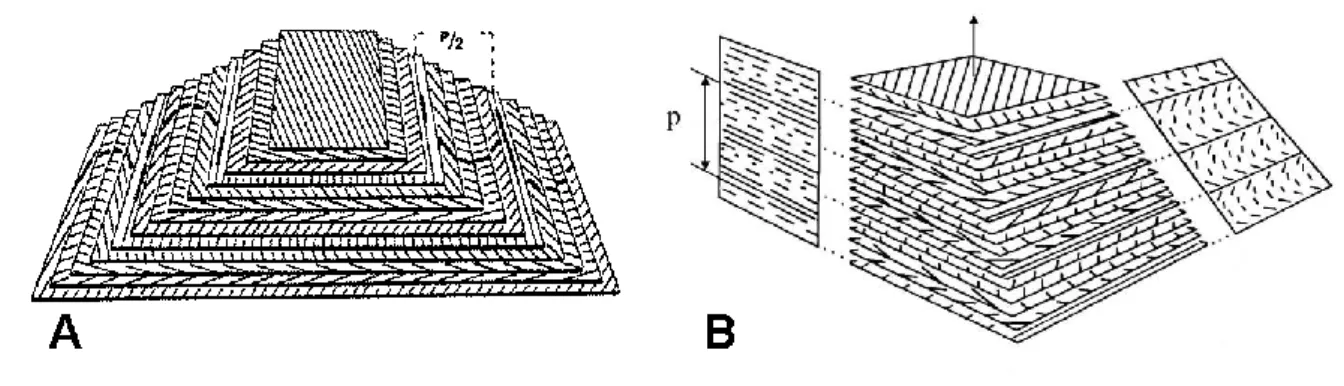
The evolution of the stripe patterns was studied at oblique incidence (Fig. S7). Our objective was to search for any arc patterns that might be reminiscent of the twisted cholesteric geometry, as observed by Bouligand in the chitinous part of crustacean cuticles. The Bouligand twisted plywood model (Fig. S8) was developed in 1965 (Bouligand, 1965) and was then extrapolated to the cholesteric organization found in very different living organisms. Imbricated arc patterns are microtomy artifacts, which are the indicators of twisted geometry when the material is cut at oblique incidence (Giraud-Guille, 1986). Branched hydrocarbons may have one or more chiral centers (Millar, 2010); it is not known at present which enantiomers are present in the biological samples, or whether chirality is important at all (Hefetz et al., 2010). Although the chemical composition of the cuticular wax of C.
gloriosa has not been reported, the layer might include chiral molecules. Since the periodicity
of the stripe texture was about 28 nm, it would lead to cholesteric structures with an extremely small pitch (cholesteric pitch typically varies from a few tens of nanometers to the micrometer range and beyond (Stanley et al., 2005)). When the cut angle was small at 10° with regard to a plane perpendicular to the cuticle surface, a stripe texture with a strong contrast was visible (Fig. S9) with a mean periodicity of 33 nm (Fig. S10). The stripe texture persisted in the wax when stained slices were cut at 46° but the contrast was weak and could not be seen in the captured image (Fig. S11). Nevertheless, a small number of stripes with a mean periodicity of 41 nm were detectable after image analysis (Fig. S12). The possibility of
9
cholesteric geometry was negated from these observations, and the new hypothesis was of a layered organization where the distance between layers increases with the angle of the oblique sectioning.
The observation of the striated texture in the wax layer of C. gloriosa was reproduced in the specimen n°2 (Fig. S13). In line with the values calculated for the specimen n°1, the mean periodicity in a stained section was equal to 31 nm (Fig. S14).
Further studies are required to elucidate the three-dimensional structure of the wax layer at the origin of the stripe texture.
4. Discussion
The physical properties of hydrocarbons may influence their distribution within the wax layer of insects (Gibbs and Crowe, 1991). For instance, the high melting point lipids would be preferentially present on the outer wax layer and the low melting point ones in the lower layers. In some insects (Rhodnius, Tenebrio, Pieris), two critical temperatures for water loss were reported (Beament, 1959) and indirectly correlated to the two layers forming the barrier to water loss. A stratification of the wax layer hydrocarbons in female Megacyllene robiniae (Coleoptera: Cerambycidae) was proposed (Hughes et al., 2011) on the basis of the behavioral response of males toward the reconstituted females. Solid phase micro-extraction of the waxes indicated a higher abundance of the contact pheromone Z9:C25 on the surface layer. However no physical evidence neither imaging of a stratified structure was given. Such a hypothesis would fit to a bilayer rather than a multilayer structure.
Cuticular lipid profiles are species-specific both in solitary and social insects and serve like fingerprints, making it possible to discriminate species taxonomically or to recognize sibling species (Vrkoslav et al., 2010). For example, differential analysis of body parts in ants
10
revealed an uneven hydrocarbon distribution throughout the body surface (Bonavita-Cougourdan, 1988), which could fit with a layered structure.
Both examples of investigations dealing with the possible stratification of wax might argue for a layer-by-layer deposition of excreted wax, which might be at the origin of a striated structure.
In case of both TEM and FIB-SEM, since the contrast of the stripe texture is weak, it can be missed unless one is specifically looking for the structure of the wax. This may be the reason as to why previous studies have not reported it in C. gloriosa. Our observations were realized from a couple of specimens collected in different countries (Arizona–USA and North Mexico) five years apart. The question of the generic character of our observations to insects whose the cuticle includes a waxy part is open. Might physical organization of hydrocarbons constitute a parameter in addition for taxonomic classification? Extending our findings to many different species for trying to answer to this question is out of our reach and purpose. Following this report, we hope to be joined by colleagues to re-examine past investigations of cuticular structures with a major focus on the wax layer. It could give the impetus to search for anisotropic textures in a wax layer of other scarab beetles, insects or arthropods in general.
Authors’ contributions
M. M. conceived and prepared the inclusions for observation at oblique incidence, led the conceptual development of research, oversaw data collection, performed the analysis of results, organized the contents of the manuscript, discussed the results with regard to the state-of-the-art, prepared the figures and wrote the manuscript. V. S. prepared the inclusions for observation at normal incidence, cut the inclusions by ultramicrotomy, stained the sections and carried out TEM observations. S. B. supervised the tasks related to ultramicrotomy,
11
staining of sections and TEM observations. V. S. and S.B. contributed to the conceptual development of operations related to the TEM investigations.
Acknowledgements
M. M. acknowledges P. Salles for acquiring FIB-SEM image (Fig. 3); C. Marcelot for acquiring TEM image of the unstained section (Figs. 2 and S1); G. Agez for the inclusion of cuticle and ultramicrotomy of the section used for Figs. 2 and S1, and to cut transversely the inclusion used for Fig. 3; C. Bayon for the metallization of the inclusion used for Fig. 3.
Supplementary data
Supplementary data related to this article can be found online at
https://doi.org/10.1016/j.asd.2018.10.003.
References
Agez, G., Bayon, C., Mitov, M., 2017. Multiwavelength micromirrors in the cuticle of scarab beetle
Chrysina gloriosa. Acta Biomater. 48, 357-367.
Bagnères, A.-G., Blomquist, G. J., 2010. Site of synthesis, mechanism of transport and selective deposition of hydrocarbons. In: Blomquist, G. J., Bagnères, A.-G. (Eds), Insect Hydrocarbons— Biology, Biochemistry and Chemical Ecology. Cambridge University Press, Cambridge, pp. 75-99. Beament, J. W. L., 1959. The Waterproofing Mechanism of Arthropods—The Effect of Temperature on Cuticle Permeability in Terrestrial Insects and Ticks. J. Exp. Biol. 36, 391-422.
Blomquist, G. J., Bagnères, A.-G. (Eds), 2010. Insect Hydrocarbons—Biology, Biochemistry and Chemical Ecology. Cambridge University Press, Cambridge.
Bonavita-Cougourdan, A., 1988. Interindividual variability and idiosyncrasy in social behaviours in the ant Camponotus vagus Scop. Ethology 77, 58–66.
Bouligand, Y., 1965. On a twisted fibrillar arrangement common to several biologic structures. C. R. Acad. Sci. Paris 261, 4864-4867.
12
Cohen, E., 2016. Preface. In: Cohen, E., Moussian, B. (Eds), Extracellular Composite Matrices ln Arthropods. Springer, p. V.
Fernandez del Rio, L., Arwin, A., Järrendahl, K., 2014. Polarizing properties and structural characteristics of the cuticle of the scarab beetle Chrysina gloriosa. Thin Solid Films 571, 410-415. Gaubert, P., 1924. Sur la polarisation circulaire de la lumière réfléchie par les Insectes. C. R. Acad. Sci. 179, 1148–1150.
Gibbs, A., Crowe, J. H., 1991. Intra-individual variation in cuticular lipids studied using Fourier transform infrared spectroscopy. J. Insect Physiol. 37, 743–748.
Gibbs, A., 1995. Physical properties of insect cuticular hydrocarbons: model mixtures and lipid interactions. Comp. Biochem. Physiol. 112B, 667-672.
Gibbs A., Pomonis, J. G., 1995. Physical properties of insect cuticular hydrocarbons: The effects of chain length, methyl-branching and unsaturation. Comp. Biochem. Physiol. 112B, 243-249.
Ginzel, M. D., Millar, J. G., Hanks, L. M., 2003. (Z)-9-Pentacosene – contact sex pheromone of the locust borer, Megacyllene robiniae. Chemoecology 13, 135–141.
Ginzel, M. D., Blomquist, G. J., 2016. Insect Hydrocarbons: Biochemistry and Chemical Ecology. In: Cohen, E., Moussian, B. (Eds), Extracellular Composite Matrices ln Arthropods. Springer, 221-252. Giraud-Guille, M. M., 1986. Direct visualization of microtomy artefacts in sections of twisted fibrous extracellular matrices. Tissue & Cell 18, 603-620.
Goldstein, H., 2006. Polarization properties of Scarabaeidae. Appl. Optics 45, 7944-7950.
Hefetz, A., Wicker-Thomas, C., Bagnères, A.-G., 2010. Future directions in hydrocarbon research. In: Blomquist, G. J. , Bagnères, A.-G. (Eds), Insect Hydrocarbons—Biology, Biochemistry and Chemical Ecology. Cambridge University Press, Cambridge, p. 478.
Howard, R. W., Blomquist, G. J., 2005. Ecological, behavioral, and biochemical aspects of insect hydrocarbons. Annu. Rev. Entomol. 50, 371–393.
Hughes, G. P., Spikes, A. E., Holland, J. D., Ginzel, M. D., 2011. Evidence for the stratification of hydrocarbons in the epicuticular wax layer of female Megacyllene robiniae (Coleoptera:
13
Jewell, S. A., Vukusic, P., Roberts, N. W., 2007. Circularly polarized colour reflection from helicoidal structures in the beetle Plusiotis boucardi. New J. Phys. 9, 99.
McClain, E., Seely, M. K., Hadley, N. F., 1985. Wax Blooms in Tenebrionid Beetles of the Namib Desert: Correlations with Environment. Ecology 66, 112-118.
Millar, J. G., 2010. Polyene hydrocarbons, epoxides, and related compounds as components of lepidopteran pheromone blends. In: Blomquist, G. J., Bagnères, A.-G. (Eds), Insect Hydrocarbons— Biology, Biochemistry and Chemical Ecology. Cambridge University Press, Cambridge, 390-447. Mitov, M., 2017. Cholesteric liquid crystals in living matter. Soft Matter 13, 4176-5209.
Nelson, D. R., Freeman, T. P., Buckner, J. S., 2000. Waxes and lipids associated with the external waxy structures of nymphs and pupae of the giant whitefly, Aleurodicus dugesii. Comp. Biochem. Physiol., Part B 125, 265–278.
Neville, A. C., 1975. Biology of the Arthropod Cuticle. Springer-Verlag.
Nguyen, S. H. T., Webb, H. K., Hasan, J., Tobin, M. J., Crawford, R. J., Ivanova, E. P., 2013. Dual role of outer epicuticular lipids in determining the wettability of dragonfly wings. Colloids Surf. B: Biointerfaces 106, 126– 134.
Nguyen, S. H. T., Webb, H. K., Mahon, P. J., Crawford, R. J. , Ivanova, E.P., 2014. Natural Insect and Plant Micro-/Nanostructured Surfaces: An Excellent Selection of Valuable Templates with Superhydrophobic and Self-Cleaning Properties. Molecules, 19, 13614-13630.
Pace, A., 1972. Cholesteric liquid crystal-like structure of the cuticle of Plusiotis gloriosa. Science 176, 678-680.
Sharma, V., Crne, M., Park, J. O., Srinivasarao, M., 2009. Structural origin of circularly polarized iridescence in jeweled beetles. Science 325, 449-451.
Stanley, C. B., Hong, H., Strey, H. H., 2005. DNA cholesteric pitch as a function of density and ionic strength. Biophys. J. 89, 2552-2557.
Vrkoslav, V., Muck, A., Cvacka, J. , Svatos, A., 2010. MALDI Imaging of Neutral Cuticular Lipids in Insects and Plants. J. Am. Soc. Mass Spectrom. 21, 220–231.
Waku, Y., Manable, Y., 1981. Fine Structure of the Wax Gland in a Scale Insect, Eriococcus
14
Fig. 1. Chrysina gloriosa. (A) Macroscopic view. (B) Optical texture of the cuticle at the
interface between green and silver bands (reflection mode, bright field, unpolarized incident light).
Fig. 2. Cross-section of a green band of the cuticle as observed by TEM. The main parts of
the cuticle are highlighted in a direction perpendicular to a couple of polygonal cells as shown in Fig. 1B: cup-like wax layer and chitinous exocuticle & endocuticle.
Fig. 3. (A) Magnified view of a cross-section of the wax layer as observed by FIB-SEM. The
wax exhibiting periodic stripe patterns. (B) Lower magnification view. The region shown in (A) is included in the white dashed frame.
Fig. 4. Cross-section of cuticle in the green band as observed by TEM after staining. (A)
Fig. 1
20
m
m
1
Supplementary data for
Observation of an anisotropic texture inside the wax layer of insect cuticle
Michel Mitov, Vanessa Soldan, Stéphanie Balor Correspondence to: mitov@cemes.fr
2
Fig. S1. Magnified view of a cross-section of the wax layer seen in Fig. 2 as observed by TEM.
Fig. S2. Analysis of the image in Fig. S1: Intensity profile as a function of depth from the
interface with the exterior. The number of detected stripes = 30. Mean periodicity = 28 nm. Range of measurements = 23–34 nm.
3
Fig. S3. Analysis of the image in Fig. 3A: Intensity profile as a function of depth from the
interface with the exterior. The number of detected stripes = 25. Mean periodicity = 27 nm. Range of measurements = 21–36 nm.
Fig. S4. Analysis of the image in Fig. 4B: Intensity profile as a function of depth from the
interface with the exterior.The number of detected stripes = 32. Mean periodicity = 32 nm. Range of measurements = 21–38 nm.
4
Fig. S5. Cross-section of cuticle in a silver band as observed by TEM (stained cut).
Fig. S6. Analysis of the image in Fig. S5: Intensity profile as a function of depth from the
interface with the exterior. The number of detected stripes = 8. Mean periodicity = 27 nm. Range of measurements = 20–32 nm.
5
Fig. S7. Geometry of the inclusion to generate cuts of cuticle at oblique incidence with regard to the cuticle surface (transmission mode, bright field, unpolarized incident light).
is the angle of oblique incidence corresponding to the angle between the direction of the cut and the direction perpendicular to the cuticle surface.
Fig. S8. The twisted plywood model. (A) Superimposed cards represent equidistant and
parallel planes forming a pyramidal model. On each card the orientations of the molecules are represented as parallel lines; their direction rotates by a small and constant angle from one plane to the other. A 180° rotation of the line direction defines the helicoidal half-pitch. The superimposed series of nested arcs are visible on the oblique sides of the model (Besseau and Giraud-Guille, 1995). Copyright © 1995 Academic Press. (B) When the section is perpendicular (left), the molecules appear as dots or parallel segments of different length as a consequence of the twist of the molecular orientation. When the section is oblique, the molecules appear as superposed series of nested arcs. (De Luca and Rey, 2003) Copyright © 2003, Springer-Verlag Berlin/Heidelberg.
6
Fig. S9. Cross-section of wax in the green band as observed by TEM when the slice is cut at an oblique incidence equal to 10° (stained cut).
7
Fig. S10. Analysis of the image in Fig. S9: Intensity profile as a function of depth from the
interface with the exterior.The number of detected stripes = 39. Mean periodicity = 33 nm. Range of measurements = 26–39 nm.
Fig. S11. Cross-section of wax in the green band as observed by TEM when the slice is cut at an oblique incidence equal to 46° (stained cut).
8
Fig. S12. Analysis of the image in Fig. S11: Intensity profile as a function of depth from the
interface with the exterior. The number of detected stripes = 5. Mean periodicity = 41 nm. Range of measurements = 35–44 nm.
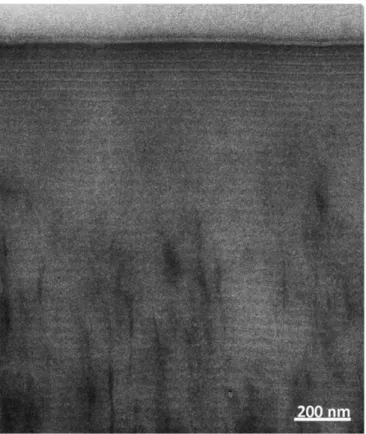
Figure S13. Cross-section of wax in the green band of specimen n°2 as observed by TEM when the slice is cut at normal incidence (stained cut).
9
Fig. S14. Analysis of the image in Fig. S13: Intensity profile as a function of depth from the
interface with the exterior.The number of detected stripes = 28. Mean periodicity = 31 nm. Range of measurements = 18–38 nm.
Besseau, L and M.-M. Giraud Guille, M. M., 1995. Stabilization of fluid cholesteric phases of collagen to ordered gelated matrices. J. Mol. Biol. 251, 197-202.
De Luca, G. and Rey, A. D., 2003. Monodomain and polydomain helicoids in chiral liquid-crystalline phases and their biological analogues. Eur. Phys. J. E 12, 291-302.