HAL Id: hal-00842380
https://hal.archives-ouvertes.fr/hal-00842380
Submitted on 8 Jul 2013
HAL is a multi-disciplinary open access
archive for the deposit and dissemination of
sci-entific research documents, whether they are
pub-lished or not. The documents may come from
teaching and research institutions in France or
abroad, or from public or private research centers.
L’archive ouverte pluridisciplinaire HAL, est
destinée au dépôt et à la diffusion de documents
scientifiques de niveau recherche, publiés ou non,
émanant des établissements d’enseignement et de
recherche français ou étrangers, des laboratoires
publics ou privés.
Hydraulic Modeling of a Mixed Water Level Control
Hydromechanical Gate
Ludovic Cassan, Jean-Pierre Baume, Gilles Belaud, Xavier Litrico,
Pierre-Olivier Malaterre, José Ribot-Bruno
To cite this version:
Ludovic Cassan, Jean-Pierre Baume, Gilles Belaud, Xavier Litrico, Pierre-Olivier Malaterre, et al..
Hydraulic Modeling of a Mixed Water Level Control Hydromechanical Gate.
Journal of
Irriga-tion and Drainage Engineering, American Society of Civil Engineers, 2011, vol. 137, pp. 446-453.
�10.1061/(ASCE)IR.1943-4774.0000305�. �hal-00842380�
OATAO is an open access repository that collects the work of Toulouse researchers and
makes it freely available over the web where possible.
This is an author-deposited version published in :
http://oatao.univ-toulouse.fr/
Eprints ID : 9011
To link to this article : DOI: 10. 1061/(ASCE)IR.1943-4774.0000305
URL : http://dx.doi.org/10.1061/(ASCE)IR.1943-4774.0000305
O
pen
A
rchive
T
OULOUSE
A
rchive
O
uverte (
OATAO
)
To cite this version : Cassan, Ludovic and Baume, Jean-Pierre and
Belaud, Gilles and Litrico, Xavier and Malaterre, Pierre-Olivier
and Ribot-Bruno, José Hydraulic Modeling of a Mixed Water
Level Control Hydromechanical Gate. (2011) Journal of Irrigation
and Drainage Engineering, vol. 137 (n° 7). pp. 446-453.
Any correspondence concerning this service should be sent to the repository
administrator:
staff-oatao@listes.diff.inp-toulouse.fr
㩷
Hydraulic Modeling of a Mixed Water
Level Control Hydromechanical Gate
Ludovic Cassan
1; Jean-Pierre Baume
2; Gilles Belaud
3; Xavier Litrico
4;
Pierre-Olivier Malaterre
5; and José Ribot-Bruno
6Abstract: This article describes the hydraulic behavior of a mixed water level control hydromechanical gate present in several irrigation canals. The automatic gate is termed “mixed” because it can hold either the upstream water level or the downstream water level constant according to the flow conditions. Such a complex behavior is obtained through a series of side tanks linked by orifices and weirs. No energy supply is needed in this regulation process. The mixed flow gate is analyzed and a mathematical model for its function is proposed, assuming the system is at equilibrium. The goal of the modeling was to better understand the mixed gate function and to help adjust their characteristics in the field or in a design process. The proposed model is analyzed and evaluated using real data collected on a canal in the south of France. The results show the ability of the model to reproduce the function of this complex hydromechanical system. The mathematical model is also implemented in software dedicated to hydraulic modeling of irrigation canals, which can be used to design and evaluate management strat-egies.
Author keywords: Numerical models; Hydraulic structures; Gates; Water levels; Field tests.
Introduction
In the past, irrigation canals have been operated with nonadjustable devices (spillways, proportional diversions, and others) or man-ually operated adjustable structures (gates). Automatic hydro-mechanical gates were developed in the twentieth century to better control water levels and water distribution. To our knowl-edge, the first commercial automatic gates were the AMIL gates. These gates are hydromechanical gates that use a float and two counterweights to maintain the water level upstream from the gate close to a setpoint. These gates were designed in the 1930s by the French company Neyrpic (later called Neyrtec, then Alsthom Fluide, it now belongs to the Gec-Alstom Group). Other hydro-mechanical gates have been designed by using alternative ap-proaches and technologies for an upstream water level control.
The Begemann and Vlugter gates are examples of theses structures and were designed by Dutch engineers (Vlugter 1940;Brouwer 1987; Burt et al. 2001;Litrico et al. 2005; Belaud et al. 2008). Upstream water level control is effective when water is distributed to users by using a fixed rotation schedule. This control strategy is easy to implement and favored by canal managers but rigid for the water users. It is the source of possible important water losses.
The Neyrpic company later developed hydromechanical gates for downstream water level control. The AVIS and AVIO gates have the important advantage of being adapted for a type of canal regulation called downstream control (Malaterre et al. 1998). This type of control allows on-demand water distribution to water users, as opposed to a fixed-rotation schedule. To our knowledge, the AVIS and AVIO gates are the only hydromechanical gates designed for downstream control of irrigation canals. In some cases, the upper reaches of large irrigation canals are managed by an upstream control strategy, and the lower reaches are managed by a downstream control strategy. This prevents frequent head discharge changes in the upstream part and adapts the release to the water demand in the downstream reaches. These two ap-proaches can be used in combination only if storage volume is available in the reaches and properly managed. The use of this water storage can be managed by a third type of gate called mixed gates, also developed by Neyrpic. These gates are the only example of such advanced automatically operated gates using only hydro-mechanical principals.
Hydromechanical gates are unique because they do not require power or electronic components. They only need regular mainte-nance (painting and greasing). They are very well suited for diffi-cult environments, such as those prevailing in developing countries or in remote locations. Their properties are all the more interesting in the context of increasing energy costs and possible power out-ages. Because of their performance and robustness properties, they are still installed on new irrigation canals (e.g., the PHLC canal in Pakistan and the Atbarra canal in Sudan) even though electronically controlled and motorized gates are increasing their market shares.
1
Researcher, UMR G-EAU, Cemagref, 361 rue J-F Breton, 34196 Montpellier Cedex 5, France (corresponding author). E-mail: ludovic .cassan@cemagref.fr
2
Research Engineer, UMR G-EAU, Cemagref, 361 rue J-F Breton, 34196 Montpellier Cedex 5, France. E-mail: jean-pierre.baume@ cemagref.fr
3
Assistant Professor, UMR G-EAU, SupAgro/IRD, 361 rue J-F Breton, 34196 Montpellier Cedex 5, France. E-mail: gilles.belaud@supagro.inra.fr
4
Researcher, UMR G-EAU, Cemagref, 361 rue J-F Breton, 34196 Montpellier Cedex 5, France. E-mail: xavier.litrico@cemagref.fr
5
Researcher, UMR G-EAU, Cemagref, 361 rue J-F Breton, 34196 Montpellier Cedex 5, France. E-mail: pierre-olivier.malaterre@cemagref .fr
6
Research Engineer, UMR G-EAU, Cemagref, 361 rue J-F Breton, 34196 Montpellier Cedex 5, France. E-mail: jose.ribot-bruno@cemagref .fr
The AVIS, AVIO, and mixed gates have been built in several coun-tries, such as France, Algeria, Morocco, Spain, Portugal, Brazil, and the United States (Cemagref 2004) and have been installed on hundreds of irrigation canals.
Several examples of irrigation canals using mixed gates exist, such as the Beni Moussa canal of the Tadla irrigation scheme canal in Morocco, where the original gates installed in the 1950s are still very well maintained. Although mixed gates have been used for decades, only a few studies mathematically modeled their hydraulic behavior (Ramirez Luna 1997). Their hydraulic behavior is com-plex because it is based on a series of tanks connected by multiple orifices and weirs. The tanks and connections are designed in such a way that the mixed gate can simultaneously maintain a down-stream water level and store water in the updown-stream reach. The mixed gate can be used without human intervention because two security modes prevent overflow and dewatering of reaches. Mathematical models of these gates are useful to design and analyze hydraulic management strategies in irrigation canals equipped with them. They are also useful to help adjust their characteristics in the field or in a design process.
The purpose of this paper is to develop a mathematical model of the mixed gate that can be implemented in a software solving open-channel flow equations. The paper is organized as follows. First, the first section provides a physical description of the gate and define its general functioning. The next section develops a math-ematical model of the gate, taking into account the various hy-draulic devices. Subsequently, the model is used to study its sensitivity to various parameters. Finally, the model results are compared to experimental measurements from an operating mixed gate installed in a real channel network.
Gate Design and Behavior
The mixed gate is designed to manage the difference between a supply discharge Qp provided into the network by pumping or
derivation and a demanded discharge Qd corresponding to water
offtakes. If Qp> Qd, the upstream reach will be used for water
storage, and the upstream water level will increase. If this differ-ence persists, or during transient if Qpincreases rapidly, the gate
will open at the maximum opening to avoid overtopping in the up-stream reach. If Qp≤Qd, then the mixed gate allows the system to
fulfill the demand as long as the discharge through the gate is equal to Qdand until the upstream level reaches a minimum value. The
gate closes completely when the discharge variation persists or
during transient, if Qddecreases rapidly. Demands can no longer
be fulfilled, but the upstream water level is maintained at its setpoint.
The overall functioning of the mixed gate can be described by the design relation between the upstream level Zu and the
down-stream level Zd, as depicted in Fig.1(Alsthom 1993). This curve
shows that the mixed gate is similar to a constant downstream level gate (AVIS) with two security modes. These models for low and high values of downstream level prevent the complete emptying and overflowing of the upstream reach, respectively. These modes are called Mode 1 and Mode 5, respectively (see Fig.1). Physical Description of the Mixed Gate
A mixed gate consists of two main parts: a set of side tanks and a metal frame with floats and a gate leaf (Figs.2and3). The first part is a set of side tanks connected by weirs and orifices. Figs.3and4
show the geometry of the tanks and their connections.
The inlet tank is connected to the upstream reach of the channel through a circular orifice O1. Water can flow into the upstream
regulation tank through submerged orifice O3 or above the weir
W10 (if the flow depth is sufficient). Water is evacuated from the upstream regulation tank by three different orifices, depending on the water depth.
• The orifice O4is always submerged; it connects the upstream
tank to the downstream tank. Water flows out of O4when the
Fig. 1. Design curve of the upstream level as a function of the downstream level
Fig. 3. Hydraulic structures, position of side tanks and front view of the grid; floats are installed in the upstream tank and in the downstream tank (not shown)
upstream water level is higher than both Z2and the downstream
water level Zd.
• The grid G7is shaped so that the width of opening decreases as
the water level rises (Fig.3). Water going through G7enters the
middle tanks.
• The orifice O9flows directly into the downstream reach.
The downstream tank has a weir W5that maintains a minimum
water level. It is connected to the downstream reach through the
orifice O6. Similarly, a middle tank is linked with the downstream
reach through the orifice O8.
The second part is composed of a sector float and a gate leaf, both of which are mounted on a metal frame (Fig.2). This part can revolve around a rotational axis. The gate leaf has a trapezoidal section, and it is placed across the channel to regulate the flow in the canal at the gate location. The floats are weighted so that the gate leaf and the floats are in equilibrium for the whole range of possible openings. Therefore, without water in the tanks, the torque on the axis of rotation because of the weight of the gate leaf is exactly compensated by the torque caused by the ballast (Fig.5). Therefore, the opening or closing of the gate will be only attribut-able to the difference in water levels between the upstream (Z3) and
downstream tanks (Z4), respectively.
The orifices O3, O4, O6, and O9 are equipped with shutters
designed to block off part of the orifices. They allow manual adjustment to the orifice openings and modification of the shape of the design curve, as shown subsequently.
Operation Modes
Water can flow through different combinations of orifices and weirs depending on the upstream and downstream water levels. These different flow patterns determine the operational modes of the gate [Figs.6(a)–6(e)].
Five different modes can be distinguished in the relationship between upstream and downstream levels, as depicted in Fig.1. These five modes can be linked to the flow patterns between the tanks (Fig.6).
Mode 1 [Fig.6(a)] regulates the upstream water level Zuand is
represented by the line a-b in Fig.1. This mode occurs when the weir W5 is under free flow conditions. In that case, there is no
influence of the downstream water level Zdon the water levels in
the upstream and downstream tanks, and the gate behaves similarly to an AMIL gate.
Fig. 4. Flowchart of the mixed gate
Fig. 6. Flowchart for the five modes Fig. 5. Description of torques acting on gate and the counterweight
In Mode 2 [Fig.6(b), line b-c in Fig.1], the floats impose a constant head difference between the upstream and downstream tanks, D¼ Z3" Z4. Because the orifice O4is submerged, its
dis-charge Q4is also constant. Because O1, W2, O3, O4, W5, and O6
are submerged, the head losses Zu" Z1, Z2" Z3, and Z5" Zdare
also constant. Moreover, Z1≈Z2, and Z4≈Z5. Consequently, the
difference between the upstream and downstream levels is also constant. This mode occurs when Z3is below the level of the grid
bottom (G7).
Mode 3 [Fig. 6(c), line c-d in Fig. 1], imposes a linear relationship between Zu and Zd. Similar to the previous mode,
the discharge in the downstream tank Q4 remains constant, but
Z2" Z3 depends on the flow through the grid G7. The shape of
G7 ensures that Z2increases linearly with Z3.
Mode 4 [Fig.6(d), line d-e in Fig.1], begins when water flows through orifice O9. It provides a constant downstream level
regu-lation. An increase in Zucauses a limited increase of Z3because of
O9and G7and then a limited variation of Zd. The flow through O9
may be manually adjusted by using a shutter that controls the varia-tion of Zd with Zu.
Mode 5 [Fig.6(d), line e-f in Fig.1] occurs when water flows over the weir W10. The principle is identical to Mode 4, but here Zu
is maintained nearly constant by the weir W10.
Gate Equilibrium Design
The torque because of floats on the axis of the gate, C0, is a function
of the difference D between water levels in the upstream and down-stream tanks. This torque is calculated as follows (Alsthom 1993):
C0¼
ρgLfDðr21" r22Þ
2g ð1Þ
where Lf (m) = width of floats; r1and r2 (m) = outer and inner
radius of the floats, respectively; ρ (kg=m3) = water density;
and g (m=s2) = gravitational acceleration.
The gate is in equilibrium for any openings (with water in the tanks); a counterweight is placed in the upstream float, which pro-duces an opposite torque, exactly compensating C0. This ensures
that, for any value of the discharge, there is a constant difference D between the upstream and the downstream levels in the tanks. Indeed, if the difference in the upstream and downstream level de-creases, the counterweight will tend to close the gate. Conversely, if this difference increases, the counterweight will tend to open the gate. Flows in the side tanks will vary with changing water levels to establish a new equilibrium state. This state only depends on the water levels in the upstream and downstream reaches, so the rela-tionship between water levels in the upstream and downstream tanks is independent of the discharge in the main channel.
Modeling of the Mixed Gate
The proposed mathematical model assumes the gate is in equilib-rium for any given upstream Zuand downstream Zdwater levels.
Because water levels in the tanks respond rapidly in comparison with changes in the water levels Zu and Zd, transient dynamic
effects of the gate can be neglected (Ramirez Luna 1997). A formal relationship between upstream and downstream levels can be derived depending on the different devices included in the mixed gate (weir and orifice elevation, orifice opening). Equations for the calculation of discharges and water depths were solved with Matlab software and are given below (Cemagref 2004; Sepulveda and Gomez 2009).
The hydraulic behavior of the gate has been modeled to rep-licate a curve Zu¼ f ðZdÞ that reflects the actual water levels in the
tanks. For a given hydraulic structure, h1 = upstream head;
h2= downstream head; w = orifice opening; L = equivalent width (Chow 1959); Cd = discharge coefficient; D0 = orifice diameter;
and Q = discharge.
For a free flow weir (h2≤23h1 and h1< kD0)
Q¼ CdLpffiffiffiffiffi2ghð3=2Þ1 ð2Þ For a submerged weir (h2>23h1 and h1≤kD0)
Q¼ Cd3 ffiffiffi 3 p 2 Lh2 ffiffiffiffiffiffiffiffiffiffiffiffiffiffiffiffiffiffiffiffiffiffiffi 2gðh1" h2Þ p ð3Þ
For a free flow orifice (h2≤23h1and h1> kD0)
Q¼ Cd 2 3p Lffiffiffi3 ffiffiffiffiffi 2g p ½hð3=2Þ1 " ðh1" kD0Þð3=2Þ' ð4Þ
For a partially submerged orifice [h2≤23h1þ ðkD0=3Þ and
h1> kD0] Q¼ CdLpffiffiffiffiffi2g # h2 ffiffiffiffiffiffiffiffiffiffiffiffiffiffiffi h1" h2 p " 2 3 ffiffiffi 3 p ðh1" kD0Þð3=2Þ $ ð5Þ
For a completely submerged circular orifice [h2>23h1þ
ðkD0=3Þ and h1> kD0] Q¼ CdLkD0 ffiffiffiffiffiffiffiffiffiffiffiffiffiffiffiffiffiffiffiffiffiffiffi2gðh1" h2Þ p ð6Þ k¼ w D0 ð7Þ
where k ∈ 0½ 1' = relative orifice opening.
All orifices function as weirs at low upstream water levels. To ensure flow continuity through the orifice and to take into account the contraction for orifice flow [Cd¼ 0:60, as recommended in
Bos (1989)], a continuous increase of Cdwith the dimensionless
depth (h1=w) is proposed as follows:
Cd¼ðC d0þ CdWÞ 2 þ ðCd0" CdWÞ π arctan % βh1" w w & ð8Þ
where CdO = 0.60 and CdW = 0.40. Parameter β defines the
tran-sition steepness between weir and orifice flow. A value β¼ 10 gives a correct description of this transition, with a monotonic in-crease of Q with h1. Eq. (8) is not established by physical
consid-erations, but it allows us to obtain a continuous expression. An additional equation results from the assumption of a constant differ-ence in water levels between the upstream and downstream tanks (see Fig.1):
Z3" Z4¼ D ð9Þ
Eq. (9) results from the correct balancing of the gate, as explained previously. The calculation proceeds sequentially from the downstream condition.
• The first step is to calculate the levels Z5, Z4, and Z3by using
the fact that the same discharge (Q4) flows through O4, W5, and
O6. The nonlinear system of three discharge equations, Eq. (9),
and four unknowns is solved by using a bisection method. • The second step is the calculation of the flow through grid G7.
The two discharge equations in G7and O8give Z6and the flow
into the midtank (Q7).
• In the third step, the flow Q9through orifice O9 is calculated
• Finally, the water depths Z2, Z1, and Zuare determined from the
discharge equations through hydraulic structures W2, W10, O1,
and O3 and the discharge balance in the upstream tank
[Eq. (10)]:
Q3þ Q10¼ Q4þ Q9þ Q7 ð10Þ
The grid G7consists of several horizontal openings, the widths
of which decrease with elevation. Therefore, Q7varies as a function
of Z3. To simplify, the computed equivalent width is established,
denoted L7. This equivalent width of grid G7is calculated from the
wetted area, which depends on the difference between Z3and Z7.
Given Z3, Z7 and L7, the flow through the grid is described by
Eqs. (2)–(6), according to the flow conditions.
Sensitivity Analysis
Before testing the model on experimental data, a sensitivity analy-sis was performed to ensure that our model can reproduce the design curve of a mixed gate. The design characteristics of the gate are presented in Table1.
A simpler method to compute the design curve can be devel-oped by considering the geometric characteristics of the gate. In this case it is assumed that Zu¼ Z1, Zd¼ Z4, and Zdis constant
for Mode 4. Then, the change of modes occurs when flow begins through or over the associated device (see “Operation Modes”). Compared with the curve based on the geometric characteristics, the curve based on the mathematical model is not strictly constant in Mode 4 (Fig. 7). The difference between the curves can be
significant around the transition between Modes 3 and 4. At that point, the upstream level is estimated more accurately with the present mathematical model than with the curve based on the sim-pler method, described previously. In addition, the water level transitions do not exactly correspond to the heights of structures because they also depend on flows. Thus, the upstream water level is often higher than the corresponding height of the device.
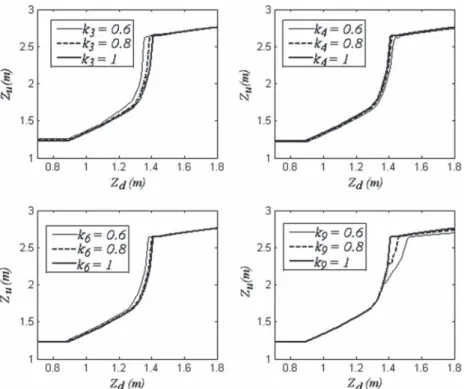
A sensitivity analysis of the design curve was performed by varying the values of the orifice relative opening ki, where i
cor-responds to an orifice equipped with shutters. Fig. 8shows the variation of the modeled curve when each orifice relative opening is changed. Modifying head losses between two tanks by closing the orifice allows Zuto either increase or decrease, depending on
the orifice considered.
Openings k4and k6act on the difference Z4" Zd. This
differ-ence is generally limited because the discharge in the downstream tank is low and the head losses in O4, W5, and O6are small
com-pared to those in the upstream part. This explains why both k4and
k6 have a limited influence on design curve.
The modification of k3 (O3) influences the exchange between
the upstream reach and the upstream tank. If k3 is decreased,
head losses through O1, W2and O3increase, which indicates that
Zu" Z3 increases. Because Z3and Z4are linked by Eq. (9), the
difference between Zuand Zdincreases.
Orifice O9 becomes effective when level Z3 is high enough,
therefore in Modes 4 and 5. Opening O9 causes the discharge in
the upstream tank to increase, then the head loss in O1, W2,
and O3 also increases. Therefore, for a given downstream level,
the upstream level Zuis increased when k9 increases.
The upstream level Zuis mainly sensitive to D, which is fixed by
the floats (Fig.9). The most useful mode for the downstream regu-lation is Mode 4, and the curve for this mode can be easily adjusted by reducing the openings of O4, O3, and O9with the shutters, as
described previously. The sensitivity analysis is useful to adjust the shutters according to given target control levels.
• Because Z4≈Zd (downstream tank) and Z3¼ Z4þ D
(up-stream tank), the up(up-stream tank level (Z3) is not significantly
affected by any of the shutter settings.
• For a given D, Zu is mainly adjusted using shutters on O3
and O9.
However, shutter adjustment could increase the transitional time necessary to reach steady-state conditions. It may therefore disturb the normal functioning of the gate. For instance, if Z4decreases, the
gate will open because the difference between Z3and Z4will be
greater than D. If Z3 is not rapidly adjusted by the flow through
orifices (emptying of upstream tank) to get a head loss equal to D, the mixed gate will deliver a large discharge over a long time, compared to the situation without shutters. This transitional aspect is not taken into account in our steady-state model, but it imposes additional conditions for the adjustment of the orifice openings.
Results and Discussion
A mixed gate located on the Bas-Rhône Languedoc canal in southern France was equipped with a set of sensors to automatically record water levels and gate openings. The characteristics of this gate are provided in Table2. Four sensors measured the water levels Z1, Z3, Z4, and Z6. Because Z4¼ Zd and Z1 is close to Zu, the
sensors were installed in the side tanks for convenience. A posi-tion sensor measured the distance from the float to the bed of the canal. This measurement was then converted to obtain the value of the opening angle, α. The sampling rate was 3 min and the mea-surements were made continuously over a period of two months.
Table 1. Design Characteristics of the Modeled Gate
Number Type Crest level (m) CdW Cd0 Lor diameter (m)
1 Orifice 0.7 0.4 0.6 0.2 2 Weir 1.1 0.4 — 0.8 3 Orifice 0.7 0.4 0.6 0.1 4 Orifice 0 0.4 0.6 0.05 5 Weir 0.9 0.4 — 1.2 6 Orifice 0.5 0.4 0.6 0.1 7 Orifice 1.4 0.4 0.6 Computed 8 Orifice 0.6 0.4 0.6 0.1 9 Orifice 1.6 0.4 0.6 0.15 10 Weir 2.6 0.4 — 1.2
Fig. 7. Relationship between upstream and downstream water levels from model calculation and height of hydraulic devices; letter labels refer to Fig.1and mode analysis
During this period, three significant flow changes were observed, corresponding to a decrease in the flow, which caused a decrease of the upstream water level. The shutter adjustments were maintained constant, but they were not measured during the period. The test covered Modes 1–4. The noise because of the sensors or high-frequency fluctuations was filtered by a moving average method over 15 min. Most of the time, the upstream and downstream water levels exhibited the same oscillations with two time periods. The first time period is about 3 h and is attributable to waves in the channel. The second period is about 1 day, corresponding to water withdrawals. When the water level decreased, the gate opened to maintain a constant discharge. The mixed gate was effective and regulated the water depths and flow in the channel at the gate location.
Flow changes were obtained by setting Qp to 0, then Zu
de-creased and the gate opened to satisfy Qd. This situation ended after few hours because the storage in the upstream reach was not suf-ficient. The mode of regulation changed and the downstream water level also decreased. The data corresponding to very small gate openings (α< 1:5°) were not considered in the analysis (see Fig.5). For these data, the parameter D increased linearly with Z3(it was
not constant). This behavior cannot be explained by a defect of the counterweight mechanism, which must maintain a constant dis-tance from the rotational axis. One possible explanation is that at small gate openings, friction on the gate bay may generate a small resistive torque. The model does not account for this effect, so these data have not been used in the analysis.
Given the number of adjustable parameters (k and Cd),
optimi-zation of these factors would have little meaning because the open-ings of the hydraulic structures inside the tanks cannot be verified and accurately measured. Moreover, not enough data are available to get the setting of each orifice. To fit the model to experiments, only the most sensitive orifice relative opening k3, k9, and the
dis-charge coefficient CdW7were calibrated by using the model defined
by Eqs. (2)–(6). The calibration was made by minimizing the mean Fig. 8. Modeled curves of Zuas a function of Zdfor various opening orifice coefficients (D¼ 0:3 m); k3, k4, k6, and k9are the relative opening
coefficients of the orifice O3, O4, O6, and O9, respectively; discharge coefficients are given by Eq. (8) (0.6 for an orifice and 0.4 for a weir)
Fig. 9. Relationship between upstream level Zuand downstream level
Zd for various values of parameter D (m). Discharge coefficients are
given by Eq. (8) (0.6 for an orifice and 0.4 for a weir)
Table 2. Design Characteristics of the Experimental Gate
Number Type Crest level (m) CdW Cd0 Lor diameter (m)
1 Orifice 0.588 0.4 0.6 0.2 2 Weir 0.996 0.4 — 0.8 3 Orifice 0.588 0.4 0.6 0.1 4 Orifice 0 0.4 0.6 0.05 5 Weir 0.9 0.4 — 1.2 6 Orifice 0.653 0.4 0.6 0.1 7 Orifice 1.055 0.4 0.6 Computed 8 Orifice 0.533 0.4 0.6 0.1 9 Orifice 1.067 0.4 0.6 0.15 10 Weir 2.208 0.4 — 1.2
square error between experimental data (Z1, Z3, Z4, or Z6) and
simulated results.
• First, D is fixed by the relationship between Z3 and Z4
[Fig.10, Eq. (9)].
• Second, the flow balance (Q7¼ Q8) in the midtank allows
fitting the model to the experimental water level (Z3, Z4 and
Z6) by adjusting CdW7 independently of other opening
coeffi-cients (Fig.10).
• Third, the opening coefficients are adjusted to reproduce the design curve (Fig. 11). As shown in Fig. 8, k3 and k9 act in
an opposite way on the curve and are limited to one, so only one solution is possible to fit curves for all modes (k3¼ 0:88, k9¼ 0:78).
Fig.11shows that the model can satisfactorily reproduce the relationship between Z1and Z4. On the same graph, the curve
giv-ing Zuas a function of Zdis depicted. As expected, both curves are
similar because experimental observation showed that Zuand Zd
are almost equal to Z1 and Z4, respectively. The range of gate
operations is limited by the actual functioning of the irrigation network. Additional measurements are needed to validate our model outside this range.
Even if the experimental curve is similar to the design curve (Fig. 1), only Modes 4 and 5 are possible. For Modes 1, 2, and 3, the difference between the weir height W5and W2is insufficient
to permit flow in the tanks to ensure the opening of the gate. Fur-thermore, the difference of height between the bottom of the orifice O9and the weir W5is lower than D. Then flows through O9and
over W5are possible. The security mode that avoids dewatering is
provided by a mixed mode between Modes 1 and 4.
Conclusions
A model was derived to describe the mixed gate, which is a par-ticular hydromechanical gate that is able to combine an upstream control strategy in the upstream pool and a downstream control strategy in its downstream pool. A numerical algorithm has been proposed that establishes the relationships among the flow rate and the different water levels in the tanks and in the reaches. A univocal relation depending on flow and design characteristics was obtained. With this model, the influence of the different shutters installed on the orifices connecting the tanks was analyzed, and the analysis showed how they can be used to achieve the desired water levels. Comparisons between the model and experimental data have been made for an operating gate. A good agreement was observed be-tween the model and the empirical data obtained on an operating mixed gate in the south of France.
The model derived here was implemented recently in SIC, the canal simulation software developed by Cemagref (Cemagref 2004) and used to analyze management strategies in modernizing irrigation schemes in Morocco.
Acknowledgments
The authors would like to acknowledge the support provided by the BRL Exploitation company for the field measurements.
Notation
The following symbols are used in this paper: C0 = torque due to floats (N • m);
Ccounterweight = torque due to counterweight (N • m);
Cd = discharge coefficient of the hydraulic structures;
CdOi = discharge coefficient of hydraulic structure i
(functioning as an orifice);
CdWi = discharge coefficient of hydraulic structure i
(functioning as a weir);
D= water level gap between upstream side tank and downstream side tank (m);
DO = orifice diameter (m);
g= gravitational acceleration (m=s2);
G7 = name of grid between upstream and mid tanks;
h1 = upstream device water head (m); h2 = downstream device water head (m);
ki = opening orifice coefficient of the orifice Oi;
L= equivalent width of device (m); L7 = equivalent width of the grid G7(m);
Lf = width of float (m); Oi = name of orifice i;
Q= discharge (m3=s);
Qi = discharge through or over the device i (m3=s);
Qd = required discharge (m3=s);
Qp = provided discharge (m3=s);
r1 = outer radius of floats (m);
r2 = inner radius of floats (m);
w= orifice opening (m); Fig. 10. Comparison of modeled curve (line) and measured data (sign)
(D¼ 0:31 m, CdO¼ 0:6, CdW ¼ 0:4, CdW7¼ 0:2, k9¼ 0:78,
k3¼ 0:88)
Fig. 11. Comparison of modeled curve (dash) and measured data (dot) (D¼ 0:31 m, CdO¼ 0:6, CdW ¼ 0:4, CdW7¼ 0:2, k9¼
Wi= name of weir i;
Z1= water level in the inlet tank upstream of W2 (m);
Z2= water level in the inlet tank downstream of W2(m);
Z3= water level in the upstream tank (m);
Z4= water level in the downstream tank upstream of W5
(m);
Z5= water level in the downstream tank downstream of
W5(m);
Z6= water level in the mid tank (m);
Z7= level of the grid bottom (m);
Zu= water level in the upstream reach (m);
Zd = water level in the downstream reach (m);
α= opening angle of the gate leaf (°);
β= parameter of the discharge coefficient law for orifice; and
ρ= water density (kg=m3).
References
Alsthom. (1993). “Vanne mixte. Technical note.” Rep. No. NT04130, France.
Belaud, G., Litrico, X., De Graaf, B., and Baume, J.-P. (2008). “Hydraulic modeling of an automatic upstream water-level control gate for submerged conditions.”J. Irrig. Drain Eng., 134(3), 315–326.
Bos, M. (1989). Discharge measurement structures, 3rd Ed., International Institute for Land Reclamation and Improvement, Wageningen, Netherlands.
Brouwer, R. (1987). “Design and application of automatic check gate for tertiary turnouts.” Proc., 13th Int. Congress on Irrigation and Drainage (ICID), Rabat, Morocco, 671–683.
Burt, C., Angold, R., Lehmkuhl, M., and Styles, S. (2001). “Flap gate design for automatic upstream canal water level control.”J. Irrig. Drain Eng., 127(2), 84–91.
Cemagref. (2004). Simulation of irrigation canals (SIC) version 4.30: User’s guide and theoretical concepts, France.
Chow, V. T. (1959). Open-channel hydraulics, McGraw-Hill, New York.
Litrico, X., Belaud, G., Baume, J.-P., and Ribot-Bruno, J. (2005). “Hydraulic modeling of an automatic upstream water-level control gate.”J. Irrig. Drain Eng., 131(2), 176–189.
Malaterre, P., Rogers, D., and Schurmans, J. (1998). “Classification of canal control algorithms.”J. Irrig. Drain Eng., 124, 3–10.
Ramirez Luna, J. (1997). “Modélisation des ouvrages frontaux et latéraux dans les canaux d’irrigation.” Ph.D. thesis, Engref (in French). Sepulveda, C., Gomez, M., and Rodellar, J. (2009). “Benchmark of
discharge calibration methods for submerged sluice gates.” J. Irrig. Drain Eng., 135(5), 676–682.
Vlugter, H. (1940). “Over zelfwerkende peilregelaars bij den waterstaat in Nederlandsch-Indie.” De Ingenieur in Nederlandsch-Indie, 6, 84–93 (in Dutch).