RESEARCH OUTPUTS / RÉSULTATS DE RECHERCHE
Author(s) - Auteur(s) :
Publication date - Date de publication :
Permanent link - Permalien :
Rights / License - Licence de droit d’auteur :
Institutional Repository - Research Portal
Dépôt Institutionnel - Portail de la Recherche
researchportal.unamur.be
University of Namur
Tracking developmentally regulated post-synthetic processing of homogalacturonan
and chitin using reciprocal oligosaccharide probes
Mravec, Jozef; Kraun, Stjepan K.; Rydahl, Maja G.; Westereng, BjøRge; Miart, Fabien;
Clausen, Mads H.; Fangel, Jonatan U.; Daugaard, Mathilde; Cutsem, Pierre Van; De Fine
Licht, Henrik H.; Höfte, Herman; Malinovsky, Frederikke G.; Domozych, David S.; Willats,
William G T
Published in: Development (Cambridge) DOI: 10.1242/dev.113365 Publication date: 2014 Document VersionPublisher's PDF, also known as Version of record Link to publication
Citation for pulished version (HARVARD):
Mravec, J, Kraun, SK, Rydahl, MG, Westereng, B, Miart, F, Clausen, MH, Fangel, JU, Daugaard, M, Cutsem, PV, De Fine Licht, HH, Höfte, H, Malinovsky, FG, Domozych, DS & Willats, WGT 2014, 'Tracking
developmentally regulated post-synthetic processing of homogalacturonan and chitin using reciprocal oligosaccharide probes', Development (Cambridge), vol. 141, no. 24, pp. 4841-4850.
https://doi.org/10.1242/dev.113365
General rights
Copyright and moral rights for the publications made accessible in the public portal are retained by the authors and/or other copyright owners and it is a condition of accessing publications that users recognise and abide by the legal requirements associated with these rights. • Users may download and print one copy of any publication from the public portal for the purpose of private study or research. • You may not further distribute the material or use it for any profit-making activity or commercial gain
• You may freely distribute the URL identifying the publication in the public portal ?
Take down policy
If you believe that this document breaches copyright please contact us providing details, and we will remove access to the work immediately and investigate your claim.
RESEARCH ARTICLE TECHNIQUES AND RESOURCES
Tracking developmentally regulated post-synthetic processing of
homogalacturonan and chitin using reciprocal oligosaccharide
probes
Jozef Mravec1,*, Stjepan K. Krač un1,*, Maja G. Rydahl1, Bjørge Westereng1,2, Fabien Miart3, Mads H. Clausen4,
Jonatan U. Fangel1, Mathilde Daugaard4, Pierre Van Cutsem5, Henrik H. De Fine Licht1, Herman Hö fte3,
Frederikke G. Malinovsky1, David S. Domozych6and William G. T. Willats1,‡
ABSTRACT
Polysaccharides are major components of extracellular matrices and are often extensively modified post-synthetically to suit local requirements and developmental programmes. However, our current understanding of the spatiotemporal dynamics and functional significance of these modifications is limited by a lack of suitable molecular tools. Here, we report the development of a novel non-immunological approach for producing highly selective reciprocal oligosaccharide-based probes for chitosan (the product of chitin deacetylation) and for demethylesterified homogalacturonan. Specific reciprocal binding is mediated by the unique stereochemical arrangement of oppositely charged amino and carboxy groups. Conjugation of oligosaccharides to fluorophores or gold nanoparticles enables direct and rapid imaging of homogalacturonan and chitosan with unprecedented precision in diverse plant, fungal and animal systems. We demonstrated their potential for providing new biological insights by using them to study homogalacturonan processing during Arabidopsis thaliana root cap development and by analyzing sites of chitosan deposition in fungal cell walls and arthropod exoskeletons.
KEY WORDS: Polysaccharides, Arabidopsis, Exoskeletons, Carbohydrate microarrays, Cell wall, Fluorescence imaging, Root cap
INTRODUCTION
Many organisms produce polysaccharide-rich extracellular matrixes, including the cell walls of plants and fungi, and the exoskeletons of arthropods. Homogalacturonan (HG) is a major structural feature of the pectic polysaccharides that are present in plant cell walls; it provides structural support, mediates cell adhesion, regulates wall porosity and generates a dynamic operating environment for other cell wall components (Caffall and Mohnen, 2009; Willats et al., 2001). HG is a linear polysaccharide composed ofα-(1→4)-linked D-galacturonic acid residues, which can be methyl esterified at C-6
(Caffall and Mohnen, 2009). HG is frequently subject to post-synthetic demethylesterification in the cell wall by pectin methylesterases (PMEs), and the degree of methyl esterification and the distribution of remaining ester groups profoundly impacts upon the functional properties of HG (Wolf et al., 2009). Plants typically produce dozens of PMEs, enabling them to fine-tune these functional properties in muro with exquisite precision within cell wall microdomains (Pelloux et al., 2007). The spatiotemporal regulation of PME activities is one of the key downstream components of many plant developmental pathways that determine growth and development, and responses to biotic and abiotic stresses (Wolf et al., 2009, 2012; Peaucelle et al., 2008; Peaucelle et al., 2011a; Peaucelle et al., 2011b; Ferrari et al., 2013).
Chitin, a polymer ofβ-(1→4)-linked N-acetylglucosamine is the main constituent of the exoskeletons of arthropods and of fungal cell walls, and may be deacetylated by chitin deacetylases (CDAs) to produce chitosan (Eijsink et al., 2010; Tsigos et al., 2000). Analogous to methyl esterification of HG, the degree of acetylation has important functional implications. In many cases, the biological significance of chitin acetylation state is poorly understood, but the quantity and ratio of chitin to chitosan is highly dynamic depending on the developmental phase and cellular interactions (Christodoulidou et al., 1999; Baker et al., 2011; Heustis et al., 2012; Luschnig et al., 2006; Wang et al., 2006). For example, tracheal tube elongation in Drosophila melanogaster is regulated by luminal CDA proteins (Luschnig et al., 2006; Wang et al., 2006).
Understanding the developmental roles and cellular processing of structural polysaccharides such as HG and chitosan requires specific detection of them in situ and, preferably, in vivo. Monoclonal antibodies (mAbs) and carbohydrate binding modules have been widely used as probes, but these large proteinaceous molecules have considerable limitations in terms of penetration and suitability for live- and real-time labelling (Verhertbruggen et al., 2009; McCartney et al., 2006). Other advanced labelling procedures, such as the use of sugars attached in vivo through click chemistry, are powerful but time consuming and technically challenging (Anderson et al., 2012).
It is known that chitosan oligosaccharides (COS) can modulate the biological activity of oligogalacturonate (OGA) fragments of HG (Cabrera et al., 2010), and our molecular modelling of the COS and OGA interaction confirmed that their reciprocal binding is mediated by the precise alignment of the positively charged amino groups on COS and the negatively charged carboxyl groups on OGA (Fig. 1A). We exploited this natural affinity to develop oligosaccharide-based reciprocal probes for de-esterified HG and chitosan (Fig. 1B). These probes have several desirable features when compared with the use of antibodies: they are very rapid to use and easy to couple directly to a variety of tags; furthermore, their small size allows high-resolution
Received 26 May 2014; Accepted 12 October 2014
1
Department of Plant and Environmental Sciences, University of Copenhagen, Frederiksberg 1871, Denmark.2Department of Chemistry, Biotechnology and Food Science, Norwegian University of Life Sciences, Aas NO-1432, Norway.3Institut Jean-Pierre Bourgin, UMR1318 INRA/AgroParisTech, Saclay Plant Sciences, INRA Centre de Versailles, Versailles 78026, Cedex, France.4Center for Nano medicine and Theranostics and Department of Chemistry, Technical University of Denmark, Kongens Lyngby DK-2800, Denmark.5Unité de Recherche en Biologie cellulaire végétale, University of Namur, Namur B-5000, Belgium.6
Department of Biology and Skidmore Microscopy Imaging Center, Skidmore College, Saratoga Springs, NY 12866, USA.
*These authors contributed equally to this work
‡
Author for correspondence ([email protected])
DEVEL
O
imaging and effective tissue penetration. Moreover, unlike antibodies, they are suitable for direct real-time imaging of polysaccharide processing.
RESULTS
Testing of COS488and OGA488reciprocal specificity using microarrays of defined glycans
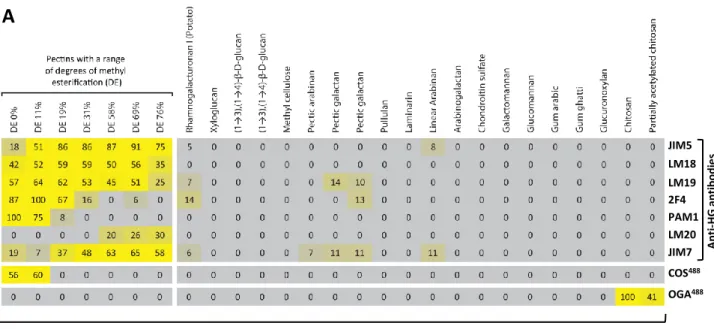
COS and OGA samples (supplementary material Fig. S1) were coupled to aminooxy-functionalized Alexa Fluor fluorophores or to gold nanoparticles (Fig. 1B). To assess the binding specificities of these conjugates, we utilized carbohydrate microarrays (Pedersen et al., 2012) populated with 41 defined oligo- and polysaccharides. The arrays included pectin samples that had been treated with PMEs to produce HG with progressively lower degrees of methyl esterification. The COS probe coupled to Alexa Fluor 488 (COS488) bound to
HG-containing pectic polysaccharides and to OGAs, but not to other oligo-or polysaccharides. Impoligo-ortantly, no binding to bovine serum albumin (BSA) or the polyanionic polysaccharides chondroitin sulphate A and B was observed (Fig. 1C; supplementary material Fig. S2). As expected, COS488binding to the pectic polysaccharides was positively
correlated with decreasing degrees of methyl esterification, and to the oligosaccharides with increasing degrees of polymerization. In the case of oligosaccharides, the strongest binding was detected for
octagalacturonate, weaker binding for heptagalacturonate and pentagalacturonate, and no binding for shorter OGAs (Fig. 1C; supplementary material Fig. S2). Using the same approach, we also characterized the reciprocal probe, OGA coupled to Alexa Fluor 488 (OGA488). As predicted, this probe bound to chitosan and, more
weakly, to partially acetylated chitosan but not to fully acetylated chitohexaose or any other oligo- or polysaccharides (Fig. 1C; supplementary material Fig. S2). These data indicate that COS and OGA are highly selective probes for non-methyl esterified HG and chitosan, respectively.
Only one antibody against chitosan has been reported (Sorlier et al., 2003), but several mAbs against HG have been described previously in detail (Verhertbruggen et al., 2009), and we compared their binding to that of COS488. COS488binding was distinct from that of the seven
mAbs against HG tested and was more selective towards sparsely methyl esterified pectins (supplementary material Fig. S2). It is worth noting that the mAb with the most similar binding profile to that of COS488was the synthetic phage display mAb PAM1, which is also
produced non-immunologically (Willats et al., 1999). However, PAM1 binding, which requires at least 20 contiguous non-methyl esterified galacturonic acid residues, appears to be dependent on the helical conformation adopted by long stretches of non-esterified HG (Willats et al., 1999). This might account for the fact that PAM1 also
Fig. 1. Reciprocal binding of oligogalacturonates and chitosan
oligosaccharides. (A) Molecular model showing the conformational features of oligogalacturonate (OGA) and chitosan oligosaccharides (COS) that promote binding by the alignment of opposing charges of the carboxyl groups on OGA and amino groups on COS. The numbers indicate the distance in Angstroms (Å) between carboxylate carbon atoms (on OGA) and ammonium group nitrogen atoms (on COS) after minimization. (B) Schematic showing the charge-based binding of COS and OGA to homogalacturonan (HG) with a low degree of methyl esterification (DE) and chitosan, respectively. Binding sites are created by pectin methylesterases (PME) and chitin deacetylases (CDAs) acting on HG and chitin to form de-esterified HG and chitosan, respectively. Directly tagged COS and OGA probes were produced through coupling to a range of fluorophores or nanogold particles. The probes were named according to their tag; hence, a COS probe coupled to Alexa Fluor 488 is designated COS488and COS coupled to nanogold particles is COSAuNP. For MALDI-ToF analysis of COS and OGA, see supplementary material Fig. S1 and methods in the supplementary material. (C) The binding specificity of COS488and OGA488was tested by probing carbohydrate microarrays that were populated with the oligo- and
polysaccharides listed, including lime pectins, with a range of degrees of methyl esterification. Numbers indicate normalized mean of spot signals obtained from microarrays. Colour intensity is correlated to signal strength. For more extensive specificity analysis and comparison with antibodies against HG, see supplementary material Fig. S2.
DEVEL
O
bound to DNA on arrays, whereas COS488binding to DNA was very
weak (supplementary material Fig. S2).
Detection of HG in diverse plant species using COS conjugates
We tested whether COS488could be used to directly visualize HG in
a variety of plant systems (Fig. 2). Rapid (<20 min) labelling was possible by directly immersing the samples into a COS488
-containing solution for a short time, followed by a brief washing step (Fig. 2A). HG-specific labelling was confirmed by using a set of controls that demonstrated the reduction of the labelling signal following treatment with polygalacturonase (supplementary material Fig. S3A-D). By using COS488in conjunction with mAb
JIM7 (Verhertbruggen et al., 2009), which recognizes highly methyl esterified HG, we were able to observe the cellular location of HG with different esterification states within discrete cell wall microdomains in Arabidopsis stem parenchyma cells (Fig. 2B-F). When initially synthesized and deposited in cell walls, HG typically had a high degree of methyl esterification, as shown by the labelling of JIM7 on the plasma membrane face of cell walls (Fig. 2B). Demethylesterified HG, produced by the activity of extracellular PMEs, is typically located between cells, where it is required for cell adhesion (Willats et al., 2001). Consistent with this, binding of COS488 was restricted to the corners of intercellular spaces and
middle lamellae (Fig. 2C,E,F). Using COS488, we also investigated
the spatiotemporal distribution of HG in green algae, which often display highly dynamic HG post-synthetic modifications (Sørensen et al., 2011). In the charophyte alga Micrasterias furcate, at a late stage of cell division, COS488labelled punctate structures on the
surface of the growing daughter cell, but not the mother semi-cell (Fig. 2G). By contrast, the mother semi-semi-cell, but not the daughter semi-cell was labelled with JIM7, which binds to HG that
has a high degree of methyl esterification (Fig. 2G). Labelling of whole cells of the multicellular Spirogyra sp. with COS488revealed
demethylesterified HG that was present at the tips of growing cell outgrowths. Labelling was also strong at the junction planes between cells, and this is important because it suggests that the role of HG in cell adhesion emerged early in green plant evolution (Fig. 2H). The unicellular alga Penium margaritaceum is covered in a highly intricate pectin-rich lattice with projections (Fig. 2I). Labelling of P. margaritaceum demonstrated that the small size of the COS and OGA probes compared with that of antibodies (approximately 1.7 and >150 kDa, respectively) provided superior image resolution. Using COS488, this network was clearly resolved
with particularly strong labelling of spine-like projections (Fig. 2J). Probing with the antibody JIM5 (against HG) produced a similar overall labelling pattern, but the resolution was apparently lower than that obtained using COS488(Fig. 2K). Moreover, using COS
coupled to nanogold particles (COSAuNP) in conjunction with
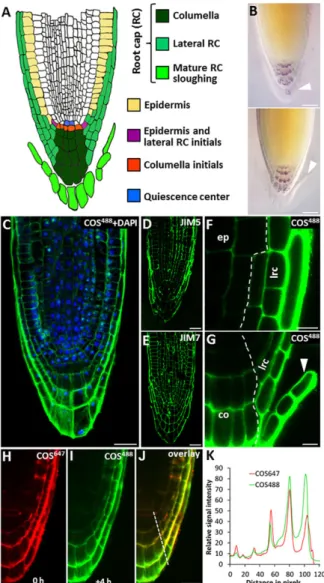
transmission electron microscopy enabled us to locate HG at the ultrastructural level (Fig. 2L; supplementary material Fig. S3E,F). The Arabidopsis root cap is a hotspot for HG de-esterification The Arabidopsis root tip is a widely used developmental model in plant biology, and we analyzed HG distribution and turnover during root cap development using the COS probe (Fig. 3). As the outermost layer of the root cap matures with time, it is usually sloughed as a file of cells, sometimes called border-like cells. This is a cyclic event that protects the root proper during penetration through the soil (Bennett et al., 2010; Driouich et al., 2007; Fig. 3A,B). Many aspects of the cellular processes underlying root cap maturation, including cell wall turnover, are poorly understood, although a regulatory role for NAC transcription factors has been demonstrated previously (Bennett et al., 2010).
Fig. 2. COS labelling of different plant species. (A) Labelling of homogalacturonan (HG) with COS488in a section through an Arabidopsis stem. (B-F) Triple labelling of Arabidopsis stem showing highly methyl esterified HG labelled with mAb JIM7 (B), de-esterified HG labelled with COS488(C) and cellulose labelled by using Calcofluor (D). (E) Overlay image showing COS488labelling the interface between cells (c) and intercellular spaces (is). The arrow indicates the position of the plasma membrane face of the wall, and the arrowhead denotes the middle lamella. (F) Higher magnification image of the intercellular space region (dashed box in E). (G) The alga Micrasterias furcata dual labelled with COS488(green) and the mAb JIM7 against
HG (red). Note the developmentally regulated distribution of the highly methyl esterified HG that is recognized by JIM7 in the older mother cell (bottom) and the de-esterified HG recognized by COS488in the slightly smaller daughter cell
(top). (H) Labelling of HG in Spirogyra sp. with COS488 (green). Arrows indicate intercellular junction zones. Chloroplast auto-fluorescence is red. (I) Scanning electron micrograph (SEM) of the pectin-rich matrix on the surface of the unicellular alga Penium margaritacium. (J,K) Fluorescent labelling of HG in the P. margaritacium surface pectin matrix using COS488(J) and JIM5 (K). Insets show the close-up of the spine-like structures (asterisks). (L) Transmission electron microscopy showing the labelling of the P. margaritacium outer pectic matrix (asterisks) using COSAuNPwith silver enhancement. Scale bars: 100μm (A); 10 μm (B-E,G,H,J,K); 1μm (F,I,L and J,K insets).
DEVEL
O
The high penetrative capacity of COS488made it a promising tool
in order to study the role of HG in this process, and when whole unfixed Arabidopsis roots were immersed in COS488, labelling was
clearly observed at least three cell layers in from the epidermis. By
contrast, the mAbs JIM5 and JIM7 (Verhertbruggen et al., 2009) did not penetrate the epidermal cell layer (supplementary material Fig. S4A-D,G). We also produced longitudinal thin sections of resin-embedded root tips (Fig. 3C-E; supplementary material Fig. S4E,F). Labelling of these sections with COS488 indicated
that de-esterified HG appeared to be especially abundant in mature root cap cells (Fig. 3C). We also compared this pattern of staining with that of the mAbs JIM5 and JIM7. JIM5 labelling of HG was more pronounced in the mature lateral root cap but largely absent from the columella (Fig. 3D), whereas the JIM7 signal was uniformly distributed across the root tip with no obvious enrichment in the mature root cap layer (Fig. 3E). Because they are loosely attached, the mature root cap cells tend to be lost during resin embedding. By contrast, whole-mount in vivo labelling of intact root tips and then using COS488enabled observation of these
cells during the process of detachment (Fig. 3F,G). It was notable that the cell walls of the root cap cells become thicker during maturation (supplementary material Fig. S4E-G). We measured the signal intensities of JIM5, JIM7 and COS488across the root tip and
found that the signals increased for all three probes, but the increase was greater for JIM5 and COS488 than that for JIM7. These
observations indicated that the increased signals were not merely a function of greater wall thickness in mature root cells and that the occurrence of HG, especially with a lower degree of methyl esterification, was elevated in outer root cap cells (supplementary material Fig. S4E-G).
Time-lapse labelling experiments to visualize HG dynamics in root cap
The root labelling experiments suggested that HG demethylesterification could be a distinctive feature of these cells related to their particular functional characteristics, and we further investigated this using a time-lapse experiment that exploited the live-labelling potential of the COS probes (Fig. 3H-J; supplementary material Fig. S5A-C). This experiment would not be feasible using mAbs because of the incompatibility between the conditions required for root growth and mAb binding. The basis of the experiment was to use two fluorescent variants of COS sequentially to distinguish original and newly generated HG epitopes within a relatively short time period (4 h). To accomplish this, we generated another fluorescent COS variant, conjugated to Alexa Fluor 647 (COS647), which had the same penetrative capacity and labelling
pattern as COS488(supplementary material Fig. S5B,C). First, we
labelled the seedlings with COS647, then washed out the probe and
let them grow for 4 h, and then relabelled them with COS488. Initial
labelling with COS647 identified original demethylesterified HG
(Fig. 3H), whereas the second labelling with COS488identified the
demethylesterified HG that had freshly formed in the intervening 4 h period (Fig. 3I). The composite overlay image of the two labels indicated that the greatest abundance of newly formed demethylesterified HG was located in mature root cap cells (Fig. 3J,K). Importantly, the same result was also achieved in the reverse order, using first COS488and then COS647; therefore, this
effect was not due to the different properties of the COS conjugates (supplementary material Fig. S5D-H).
Several PME and PMEI-like genes are specifically expressed in the root cap
Because COS labelling experiments suggested a role for enhanced PME activity in root cap cells, we reviewed the expression profiles of PMEs and related genes in publically available microarray transcriptome databases. This showed that several PMEs and
Fig. 3. HG processing during root cap maturation in Arabidopsis. (A) Diagram showing the cellular anatomy of the Arabidopsis root tip with tissues related to the root cap (RC) highlighted. (B) Different phases of the mature root cap (arrowhead) sloughing. Top panel, the outermost layer of the root cap is mature and primed to be sloughed. Bottom panel, the sloughing usually begins from the lateral root cap region as one file of cells. (C) COS488(green) labelling of a thin longitudinal resin section through a root tip. Note the strong signal in the mature layer (outer-most layer of the root cap). DAPI (blue) was used to stain nuclei. (D,E) Labelling of resin sections by using mAbs against HG, JIM5 (D) and JIM7 (E). (F,G) Whole-mount labelling of the root tip using COS488. Note the labelling pattern is similar to that observed in resin sections. (F) The lateral root cap region and (G) the columella region. Note the sloughing cell layer (arrowhead). lrc, lateral root cap; ep, epidermis; co, columella. (H-K) Time-lapse experiment using two fluorescent variants of the COS probe. Seedlings were labelled first using COS647(red), washed and allowed to grow for 4 h. Seedlings were then re-labelled with COS488(green) and washed. The simultaneous scan of (H) COS647and (I) COS488labelling at the end of the experiment. (J) The
overlay image shows the differences between the initial and the freshly formed HG with a low degree of methyl esterification. (K) Fluorescence plot profile of the two signals from H and I, the plot position is indicated as the dashed line in J. Note the higher accumulation of the COS488signal (freshly formed epitopes) in
the cell walls of the mature layer of root cap than in the inner regions. This pattern was seen in 83% of cases (three independent experiments, at least eight roots were analyzed in each). Scale bars: 10μm.
DEVEL
O
PMEI enzymes exhibited strong and specific expression patterns in root cap cells (supplementary material Fig. S6). We confirmed this pattern for two PME- and PMEI-like genes by generating GUS reporter lines. Importantly, expression of both genes was upregulated in the mature layer of the root cap (Fig. 4A,B), suggesting that root cap maturation is indeed a hotspot of HG esterification processing through the activity of PMEs.
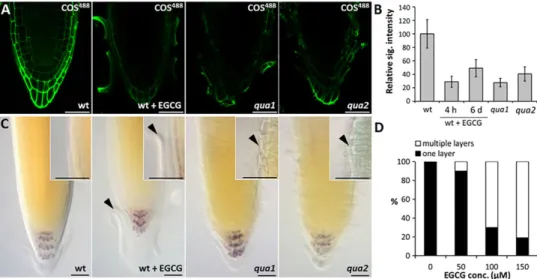
Consequences of the loss of COS488binding sites in mature
root cap cells
We also investigated the physiological role of HG de-esterification in the root cap. We did not observe any phenotypic variation in the transfer (T)-DNA insertional mutants of the respective PME genes
compared with the phenotype of wild-type plants, and one probable explanation for this is the known high level of genetic redundancy of PMEs (Pelloux et al., 2007; Wolf et al., 2009). To overcome this, we employed a systemic chemical inhibitor of PMEs, (-)-epigallocatechin gallate (EGCG) (Lewis et al., 2008; Wolf et al., 2012), which targets PME activity in vivo. We treated seedlings with EGCG for 4 h at a concentration of 200μM (this concentration did not completely inhibit root growth) or by directly supplementing EGCG to Murashige-Scoog agar plates at a concentration of 100μM for continuous growth inhibition. Following treatment, the roots were labelled with COS488, JIM5
and JIM7, confirming that EGCG did indeed inhibit the formation of demethylesterified HG, whereas the highly methyl esterified HG was unchanged (Fig. 5A,B; supplementary material Fig. S5I). Inhibition during the pulse experiment was more pronounced than that upon continuous growth on EGCG, which further supports the notions that a feedback signalling loop exists (Wolf et al., 2012) and that the upregulation of some PMEs might partially diminish the inhibitory effect of EGCG (Fig. 5B). Next, we investigated the diminution of HG synthesis through COS488labelling of quasimodo1 and quasimodo2
mutants, which are defective in galacturonosyltransferase and methyltransferase activity, respectively (Bouton et al., 2002; Mouille et al., 2007). Both mutants have an HG content of approximately 50% of that in wild-type plants. Their characteristic phenotype is that of being defective in cell adhesion (Bouton et al., 2002; Mouille et al., 2007) with altered organization of border-like cells (Durand et al., 2009). The binding of COS488to both quasimodo
mutant roots was substantially reduced, as was the case with treatment with EGCG (Fig. 5A,B), confirming that both HG synthesis and the activity of PME are responsible for the formation of COS488-binding
epitopes.
The effect of EGCG on root cap physiology was further examined by growing seedlings on plates containing three concentrations of EGCG. We observed that treatment with EGCG resulted in the retention of root cap cells in a dose-dependent manner, such that
Fig. 4. Expression of some PME related genes. (A,B) GUS staining of reporter lines of root cap-specific related genes. (A) Expression of PME-like gene At2g21610 and (B) PMEI-PME-like gene At4g00080. The bottom panels show close-ups of the root cap regions. Note the higher expression in the maturing layer of the root cap. Scale bars: 10μm.
Fig. 5. Functional analysis of COS epitopes in root cap. (A,B) The effect of EGCG treatment and quasimodo mutations on the binding of COS488to Arabidopsis
root tips. (A) Panels from left to right: wild type (wt), wild type continuously grown on 100μM EGCG, quasimodo1 (qua1) and quasimodo2 (qua2) mutants. The COS488signal was reduced to similar degree in EGCG-treated roots and both quasimodo mutants. (B) Quantification of the COS488signals relative to that of wild type (the wild-type signal was set to 100%). The 4 h long pulse treatment with EGCG (200μM) resulted in higher inhibition of the COS488signal than when roots were grown continuously for 6 days (6 d) on media supplemented with 100μM EGCG. Error bars indicate s.e.m. (n=7). (C,D) Phenotypes observed in the root tips grown on the EGCG and in the quasimodo mutants. Panels from left to right: wild type, wild type grown on 100μM EGCG, quasimodo1 and quasimodo2 mutants. Insets are higher magnification images of the defects. Note the two layers of the mature root cap being detached in EGCG treated roots and premature detachment in quasimodo mutants. Defects are indicated by arrowheads. (D) Quantification of the effects on cell detachment of treatment with EGCG at different concentrations (n>20). Scale bars: 10μm.
DEVEL
O
multiple layers of cells accumulated rather than being sloughed off (Fig. 5C,D). Interestingly, although quasimodo mutants and EGCG-treated plants both showed reduced binding of COS488,
the effects on root cap cell separation were different. Although EGCG-treated plants exhibited root cap cell retention, this was not the case for the quasimodo mutants, in which we observed instances of premature separation (Fig. 5C). Thus, although reduced HG synthesis and the inhibition of PME activity are both characterized by the diminution of COS488 epitopes, the physiological
consequences are distinct. Taken together, these data provide new insights into the role of PMEs and HG turnover in root cap maturation, and demonstrate the potential of COS-based probes as powerful new tools for studying the developmental role of HG in planta.
Detection of chitosan in fungal cells using OGA488
Next, we tested whether the OGA-based probe OGA488could be
used for chitosan detection in fungal model species (Fig. 6; supplementary material Fig. S7). Saccharomyces cerevisiae spores are known to have a cell wall structure that differs from that of diploid cells in that they possess a chitosan layer (Christodoulidou et al., 1999). Consistent with this, OGA488 labelled the tetrad of
spores inside asci, but did not label diploid cell walls (Fig. 6A). In another model fungi, Neurospora crassa, OGA488 binding was
restricted to septa between cells (Fig. 6B; supplementary material
Fig. S7A,B). Chitosan production has also been implicated in fungal pathogenesis (Baker et al., 2011), and we explored this in the context of host-parasite tissue interactions in the housefly Musca domestica that had been infected with the pathogenic fungus Entomophthora schizophorae. This fungus grows inside the fly haemocoel before corrupting host behaviour and inducing the fly to move to an elevated position where it attaches itself to the substrate and eventually dies (Roy et al., 2006). The fungus then grows out through the membrane between the sclerotized segments of the abdomen to produce new infectious spores. OGA488only labelled fungal structures and not fly tissue, and revealed that chitosan was exclusively located in the conidiophore cell walls emerging between the abdominal sclerites of the fly (Fig. 6C; supplementary material Fig. S7C-F).
OGA488as a tool to study the exoskeletons of arthropods
Finally, we used OGA488to probe for chitosan in arthropod species.
Whole-mount labelling of adult Drosophila flies revealed that chitosan localized in the tarsal knee joints, with a higher abundance in the socket of the joint (Fig. 7A-D; supplementary material Fig. S8A-J). To confirm that this apparently restricted localization of chitosan was not simply owing to limited access in the whole-mount material, we also probed sections of resin-embedded material (supplementary material Fig. S8G-J). As expected, the leg exoskeleton was evenly labelled throughout by the chitin stain
Fig. 6. OGA labelling of different fungal species. (A) OGA488labelling of chitosan (green) on the surface of a tetrad of four Saccharomyces cerevisiae spores (only three spores are visible). Note that the ascus wall (arrowhead) and diploid cells (arrows) are not labelled. Nuclei are stained by DAPI (blue). (B) Neurospora crassa mycelium labelled with OGA488(green). Chitosan is restricted to the septa between cells (arrowheads). Nuclei are stained by DAPI (blue). (C) Labelling of the chitosan by OGA488(green) in the pathogenic fungus Entomophthora scizhophorae outgrowing housefly Musca domestica. Chitin is stained by
Calcofluor (blue) and nuclei by propidium iodide (PI, red). Only conidiofores (cf ) are labelled, but not spores (sp) or cuticle of the fly (cu). Scale bars: 10μm.
Fig. 7. OGA labelling of exoskeletons of arthropods. (A-D) OGA488labelling of Drosophila legs. Chitosan is restricted to the knee joint region with the most intense labelling in the socket. (A) OGA488labelling,
(B) autofluorescence signal, (C) the overlay of signals from A and B. (D) Differential interference contrast (DIC) microscopy scan. Upper panels show the ventral view, middle and the bottom panels show the posterior view of the legs. The bottom panels show the OGA488labelling after treatment by NaOH to remove the acetyl groups. Note that the whole cuticle is now labelled. (E,F) OGA488labelling of exoskeletons of two small fresh water crustaceans that had been deacetylated using NaOH. (E) Cyclops sp. and (F) Dafnia pulex. Scale bars: 10μm (D), 100 μm (E,F).
DEVEL
O
Calcofluor, whereas the OGA488signal was still restricted to tarsal
knee joints. To further validate that the epitope recognized by OGA488 was indeed chitosan, we treated some samples with
chitosanase and some we re-acetylated using pyridine-acetic anhydride. In both cases, the binding of OGA488 was greatly
diminished (supplementary material Fig. S8E,F). Moreover, we also performed chemical deacetylation of all chitin that was present in the legs of D. melanogaster using concentrated NaOH (Kurita et al., 1991). This treatment converts chitin to chitosan, and as expected resulted in strong OGA488 labelling in the whole leg cuticle
(Fig. 7A-D, bottom panels). Thus, treatment with NaOH followed by OGA488labelling is an efficient way to detect chitin per se, and
we demonstrated this approach on small fresh water crustaceans Cyclops sp. and Dafnia pulex, in which the majority of the exoskeleton is constructed of chitin (Fig. 7E-F; supplementary material Fig. S8K-Q). In Cyclops sp., chitosan only occurs in a region of the segmented body and in the tail appendages (supplementary material Fig. S8L). After NaOH deacetylation, OGA488 labelled the entire exoskeleton (Fig. 7E; supplementary
material Fig. S8N). Similarly, OGA488labelling of untreated Dafnia
pulex exoskeletons showed only weak signals, but after deacetylation the whole specimen was brightly stained, which was again lost after chemical re-acetylation (Fig. 7F; supplementary material Fig. S8O-Q).
DISCUSSION
By exploiting their unique physicochemical properties, we have developed a new class of molecular probes for HG, chitosan, and in combination with sodium hydroxide pre-treatment, also chitin. These new tools address significant analytical deficiencies and have several distinct advantages over antibodies: one-step labelling is rapid and simple, their small size ensures excellent tissue penetration and high resolution, and the ease of direct conjugation to a variety of tags facilitates dual labelling and time course experiments. An important additional feature is that, unlike antibodies, these probes are not optimized for use at the mammalian physiological pH of around 7. This is especially important in the case of plant research because most antibodies are not compatible with plant growth conditions (usually less than pH 5.7) and therefore cannot be used for live-labelling studies. This is a serious limitation because it means that HG localization studies have been largely confined to dead, sectioned plant materials without the possibility to investigate the often rapid and highly dynamic processes associated with HG synthesis and processing.
The epitope and paratope interactions that govern the binding of conventional hybridoma-based mAbs are generally mediated by a variety of non-covalent bonds, and this contribution from multiple forces might explain why relatively subtle variations in the degree of methyl esterification are not sufficient to define specificity in these mAbs. This is especially true for the most commonly used probe against HG, mAb JIM5, which binds to HG with a relatively broad range of degrees of methyl esterification (supplementary material Fig. S2). By contrast, because binding of COS and OGA probes appears to be entirely mediated by ionic interactions and particular molecular stereochemistry, they are highly sensitive to changes in methylation and acetylation status; thus, they are well suited to study chitin and HG synthesis, and subsequent processing by PMEs and CDAs.
The study of Arabidopsis root tips demonstrated the potential of the COS probe for tracking HG turnover in vivo. Our data indicated that, in Arabidopsis root cap cells, the inhibition of demethylesterification, as well as lower levels of HG synthesis,
resulted in a reduction of COS binding sites with some distinct cellular consequences. HG with a low degree of methyl esterification has been associated with the formation of Ca2+
-crosslinked ‘egg box’ structures that are generally considered to promote cell-to-cell adhesion (Fig. 2C). Consistent with this, loss or reduction of HG synthesis leads to defects in cell adhesion, as seen in the quasimodo mutants (Bouton et al., 2002; Mouille et al., 2007). Conversely, removal of methyl esters also creates cleavage sites for certain HG-degrading enzymes, for example polygalacturonases, that act to disassemble HG networks and promote cell separation (Rhee et al., 2003; Francis et al., 2006; Ogawa et al., 2009). This might explain the reduced cell separation defect after PME inhibition by EGCG. However, the pectin degrading activity during separation should be apparent through the loss of the COS signal. In fact, we observed strong COS labelling before and after separation in mature root cap cells (Fig. 3F,G). One explanation for this intriguing finding is that in these cells, which are subjected to an unusual degree of mechanical stress, Ca2+-crosslinked HG plays a primary role in cell wall
stiffening rather than adhesion. If Ca2+-crosslinked HG is used for
this purpose, it might limit the formation of egg box structures that are available between the cells. Partial loss of PME activity would make more HG available in middle lamellae than usual and would explain the observed phenotypes in the EGCG-treated seedling. Taken together, our findings demonstrate that HG methylation is fine-tuned at the cellular level and provide evidence for a possible new and subtle aspect of this regulation operating in a subset of root cells.
OGA probes appear to be powerful new tools for studying chitosan deposition in opisthokonts, and we newly identify several instances of restricted chitosan production in model organisms. Additional genetic and physiological experiments would be necessary to fully understand the biological roles of chitosan, but some insight into functionality can be inferred from its known physicochemical properties (Rinaudo, 2006) and the localization experiments described here. For example, chitosan in the sporangiophores of E. schizophorae might facilitate the hydration of the fungal tissue after exiting the host environment, and the chitosan in tarsal joints might play a role in lubrication. This notion is supported by the fact that silencing of a CDA gene in the beetle Tribolium castaneum results in impaired articulation of tibial-femoral joints in adult animals (Arakane et al., 2009).
In conclusion, we believe that OGA- and COS-based probes have the potential to shed new light on the numerous subtle and dynamic processes that are associated with chitin and HG post-synthetic developmental regulation. Because the properties that promote reciprocal binding are particular to COS and OGA, the potential for extending this general concept to other oligosaccharides could be limited. Nevertheless, the glycan microarrays we used for this study would be well suited to screening large chemical libraries, and new candidates might emerge using this approach.
MATERIALS AND METHODS
Sourcing and growth of plant, animal and fungal materials
Penium margaritaceum, Micrasterias furcata and Spirogyra sp. were grown in sterile liquid Woods Hole Medium (WHM) at 18°C under 2000 lux of cool white fluorescent light with a 16 h light:8 h dark photocycle. Cells were collected by using centrifugation and then washed three times with WHM before labelling or experimental treatment. Arabidopsis thaliana Col-0, Ws, qua1-2 (Bouton et al., 2002), qua2-1 (Mouille et al., 2007) and tobacco plants were grown in a greenhouse (long day, 22°C). Arabidopsis seedlings were grown on vertical Murashige-Scoog plates with 1% sucrose in a growth chamber (long day, 21°C). To create the GUS reporter lines, the genomic
DEVEL
O
fragment of At2g21610, including 1385 bp of the promoter region, and the promoter region of At4g00080 (1385 bp upstream of ATG) were amplified and cloned into pGWB3 (Nakagawa et al., 2007) using Gateway technology (Invitrogen). The resulting constructs were transformed by using the Agrobacterium-mediated floral dip method to Col-0 plants. The GUS staining was performed as described previously (Benková et al., 2003). Saccharomyces cerevisiae strain BY4743 was cultivated on yeast peptone dextrose (YPD) plates, and the sporulation was performed as described previously (Elrod et al., 2009). Neurospora crassa FGSC no. 2489 was grown on potato dextrose agar plates. Drosophila melanogaster strain Oregon-R-S was cultivated in standard conditions on cornmeal media, anaesthetized with ether and fixed in 70% ethanol. Cyclops sp. was collected in a local pond and Dafnia pulex was obtained from a shop selling aquarium supplies. Entomophthora schizophorae was cultivated by consecutively infecting adult houseflies, Musca domestica, by placing sporulating fly cadavers over small plastic cups covered with insect netting and allowing spores to shoot downwards onto 20-30 flies. After an incubation period of 5-7 days at 21°C, dead flies attached to the underside of the net were collected for analysis.
Arabidopsis physiological experiments
At 6 days of age, Arabidopsis seedlings were grown on vertical plates supplemented with or without EGCG (Sigma) from a 100 mM aqueous stock solution. The phenotypes were observed under a light microscope after Lugol staining and chloralhydrate clearing, as described previously (Benková et al., 2003). For the short term inhibitory experiments, seedlings were transferred from solid plates to liquid Murashige-Scoog that had been supplemented with 200μM EGCG, and then incubated for 4 h, washed twice with MES buffer and probed with COS488.
Molecular interaction modelling
The illustration of the oligosaccharides was generated using MacroModel (http://schrodinger-macromodel-v99111.software.informer.com/9.9/) using the fragment library. The conformational search was performed using MacroModel and the OPLS_2005 force field. Water solvation was simulated implicitly by MacroModel. Charges were taken from the structure file. The conformational searches were carried out using 10,000 steps of the Monte Carlo multiple minimum (MCMM) torsional sampling procedure and applying an energy window of 21 kJ/mol. No ring-opening or closing was allowed. The lowest energy conformations of COS and OGA from the minimizations were combined.
Conjugation of COS and OGA with fluorescent tags
COS were prepared as previously described (Cabrera et al., 2010) and had a degree of polymerisation between 6 and 11. OGAs were prepared as described previously (van Alebeek et al., 2003), and OGA with a degree of polymerisation of 7 was used for preparation of the OGA probes. OGAs with degrees of polymerization from 3 to 8 were also produced and used on the microarray. The partially acetylated chitosan sample was produced as previously described (Kurita et al., 1991). Oligosaccharides, 10 mg/ml for COS and 1 mg/ml for OGA, were dissolved in 0.1 M NaOAc buffer, pH 4.9 and incubated with aminooxy-functionalized fluorophores Alexa Fluor 488 and Alexa Fluor 647 (Invitrogen) at 10 mg/ml in water at a ratio of 0.5 equivalents for the OGA probes and 0.1 equivalents for COS. The reaction mixture was incubated with shaking at 1400 r.p.m. in the dark at 37°C for 24 h and for a further 24 h at room temperature. The reaction mixtures were stored at−20°C in the dark and used without purification.
Conjugation of COS with nanogold particles
A heterobifunctional aminooxy/amino linker was synthesized as described previously (Bohorov et al., 2006) and was reacted (1 mg, 1 equivalent) with 157 mg of COS (25 equivalents) at 37°C for 48 h with shaking at 1400 r.p.m. in 1 ml of 0.1 M NaOAc buffer, pH 4.9. The product was lyophilized and used without purification. 20 mg of the COS with the bi-functional linker was reacted with the mono-sulfo-NHS-Nanogold nanoparticle suspension (50μl; Nanoprobes) together with 450 μl of 0.1 M potassium phosphate buffer, pH 8.0 and incubated at room temperature for 2 h with shaking at
1400 r.p.m. After that, 1μl of ethanolamine was added to the mixture to block unreacted sulfo-NHS esters, and the reaction mixture was incubated for an extra 30 min. The nanoparticles were then purified by filtration through 10 kDa molecular mass cut-off filters (Nanosep 10 K Omega) and washed three times with 400μl of water. The particles were then collected from the filter in 100μl of water. Negative controls (ethanolamineAuNP and linkerAuNP) were produced in an identical fashion by reacting the nanogold particles with ethanolamine (1μl) or the linker (1 mg) under the same reaction conditions.
Carbohydrate microarrays of oligo- and polysaccharides
Carbohydrate microarrays were produced, probed with antibodies and quantified as described previously (Pedersen et al., 2012). For probing with COS488 and OGA488probes, the arrays were blocked with 5% skimmed
milk in MES buffer pH 5.7 for 30 min followed by three washes with MES buffer. COS488or OGA488were applied to arrays for 15 min, diluted 1 in
1000 in MES buffer. After washing three times, each for 10 min, with MES buffer, the arrays were dried prior to scanning (GenePix 4400) and quantified as described previously (Pedersen et al., 2012).
Transmission electron microscopy of Penium margaritaceum cell walls using COSAuNP
Centrifugation was used to collect 7-day-old cultures of P. margaritaceum, washed and spray-frozen in liquid propane as previously described (Domozych, 1999). The cells were then freeze substituted in 0.5% glutaraldehyde with acetone for 48 h at−80°C. The cells were warmed to −20°C, washed with cold acetone and then infiltrated and embedded in London Resin at−20°C. Polymerization was by UV light over 16 h at −20° C. Sections (50-70 nm) were obtained using a Leica Ultramicrotome and collected on formvar coated nickel grids. The sections were incubated for 2 h at room temperature or overnight at 4°C in either 1μg/ml COSAuNPor ethanolamineAuNP and linkerAuNP. The sections were then washed extensively with deionized water, fixed with 1% glutaraldehyde in PBS buffer for 3 min and washed over 5 min in deionized water. The sections were then treated with HQ silver enhancement solution (Nanoprobes) for 4 min and counterstained with 1% uranyl acetate for 5 min. The sections were viewed with a Zeiss Libra 120 transmission electron microscope at 120 kV.
Chemical and enzymatic treatment
For deacetylation, samples were chemically deacetylated through pre-treatment with 5 M NaOH at 99°C for 1 h and extensively washed with water before labelling. For re-acetylation, samples were incubated with pyridine as a base catalyst for 20 min. The same amount of acetic anhydride was then added, and the mixture was incubated for 30 min. The samples were washed twice with 0.1 M sodium methoxide in methanol to remove O-acetyl groups while preserving N-acetyl groups, and the sample was then washed with water four times before staining. For chitosanase treatment, samples were incubated in 0.03 U/ml of chitosanase (Sigma) in 50 mM sodium acetate buffer ( pH 5.0) overnight at 37°C. For polygalacturonase treatment, samples were incubated in endo-polygalacturonase (Megazyme) 2.5 U/ml in 100 mM sodium acetate buffer ( pH 4.2) for 3 h at 37°C.
Labelling of samples using fluorophore-conjugated COS and OGA
In all cases, COS488, COS647and OGA488were applied diluted 1 in 1000 in
50 mM MES pH 5.7. After 15 min, the samples were washed several times with MES buffer and mounted in MES buffer and glycerol solution (1:1) before viewing. Stem sections (100μm thick) of Arabidopsis and tobacco were prepared using vibrating microtome (Vibratome, Leica VT1000S). Prior to sectioning, samples were embedded in 8% agarose gel. For COS488
labelling of algal materials, algae were washed three times in WHM containing 9 mg/ml of MES, and the pH was adjusted to 5.7 with MES. The algae were then labelled in the dark at room temperature as described above. Where antibodies were used in conjunction with COS probes, resin sectioning and immunocytochemistry was performed as described previously (Sørensen et al., 2011). Algae were viewed with either an Olympus Fluoview 300 or
DEVEL
O
1200 confocal laser microscope. All other materials were viewed using a Leica SP-5 confocal laser microscope. The signal intensities were quantified by using ImageJ software.
Competing interests
The authors declare no competing financial interests.
Author contributions
J.M. developed the probes; S.K.K. synthetized the probes; M.G.R. generated binding data on carbohydrate arrays; B.W., F.M. and F.G.M. performed analytical and physiological experiments; P.V.C, H.H., H.H.D.F.L. and J.U.F. provided material and support; D.S.D. performed algal experiments; M.D. and M.H.C. performed the molecular modelling; W.G.T.W. designed the study and wrote the manuscript.
Funding
This work was supported by the FP7 Marie Curie action project CeWalDyn under contract 329830 and Danish National Advanced Technology Foundation project B21st (J.M.); by the Danish Foundation for Strategic Research (S.K.K., M.H.C. and M.D.); by the Norwegian Research Council [214613]; by the FP7 project Waste2Go under contract 308363 (B.W.); and by the US National Science Foundation (NSF) Molecular and Cellular Bioscience [0919925] and NSF Division of Biological Infrastructure [0922805] (D.S.D.).
Supplementary material
Supplementary material available online at
http://dev.biologists.org/lookup/suppl/doi:10.1242/dev.113365/-/DC1
References
Anderson, C. T., Wallace, I. S. and Somerville, C. R. (2012). Metabolic click-labeling with a fucose analog reveals pectin delivery, architecture, and dynamics in Arabidopsis cell walls. Proc. Natl. Acad. Sci. USA 109, 1329-1334.
Arakane, Y., Dixit, R., Begum, K., Park, Y., Specht, C. A., Merzendorfer, H., Kramer, K. J., Muthukrishnan, S. and Beeman, R. W. (2009). Analysis of functions of the chitin deacetylase gene family in Tribolium castaneum. Insect Biochem. Mol. Biol. 39, 355-365.
Baker, L. G., Specht, C. A. and Lodge, J. K. (2011). Cell wall chitosan is necessary for virulence in the opportunistic pathogen Cryptococcus neoformans. Eukaryot. Cell 10, 1264-1268.
Benková, E., Michniewicz, M., Sauer, M., Teichmann, T., Seifertová, D., Jü rgens, G. and Friml, J. (2003). Local, efflux-dependent auxin gradients as a common module for plant organ formation. Cell 115, 591-602.
Bennett, T., van den Toorn, A., Sanchez-Perez, G. F., Campilho, A., Willemsen, V., Snel, B. and Scheres, B. (2010). SOMBRERO, BEARSKIN1, and BEARSKIN2 regulate root cap maturation in Arabidopsis. Plant Cell 22, 640-654. Bohorov, O., Andersson-Sand, H., Hoffmann, J. and Blixt, O. (2006). Arraying glycomics: a novel bi-functional spacer for one-step microscale derivatization of free reducing glycans. Glycobiology 16, 21C-27C.
Bouton, S., Leboeuf, E., Mouille, G., Leydecker, M.-T., Talbotec, J., Granier, F., Lahaye, M., Hö fte, H. and Truong, H.-N. (2002). QUASIMODO1 encodes a putative membrane-bound glycosyltransferase required for normal pectin synthesis and cell adhesion in Arabidopsis. Plant Cell 14, 2577-2590. Cabrera, J. C., Boland, A., Cambier, P., Frettinger, P. and Van Cutsem, P. (2010).
Chitosan oligosaccharides modulate the supramolecular conformation and the biological activity of oligogalacturonides in Arabidopsis. Glycobiology 20, 775-786.
Caffall, K. H. and Mohnen, D. (2009). The structure, function, and biosynthesis of plant cell wall pectic polysaccharides. Carbohydr. Res. 344, 1879-1900. Christodoulidou, A., Briza, P., Ellinger, A. and Bouriotis. (1999). Yeast
ascospore wall assembly requires two chitin deacetylase isozymes. FEBS Lett. 460, 275-279.
Domozych, D. S. (1999). Disruption of the Golgi apparatus and secretory mechanism in the desmid, Closterium acerosum, by brefeldin A. J. Exp. Bot. 50, 1323-1330.
Driouich, A., Durand, C. and Vicré-Gibouin, M. (2007). Formation and separation of root border cells. Trends. Plant Sci. 12, 14-19.
Durand, C., Vicré-Gibouin, M., Follet-Gueye, M. L., Duponchel, L., Moreau, M., Lerouge, P. and Driouich, A. (2009). The organization pattern of root border-like cells of Arabidopsis is dependent on cell wall homogalacturonan. Plant Physiol. 150, 1411-1421.
Eijsink, V. G. H., Hoell, I. A. and Vaaje-Kolstad, G. (2010). Structure and function of enzymes acting on chitin and chitosan. Biotechnol. Genet. Eng. Rev. 27, 331-366.
Elrod, S. L., Chen, S. M., Schwartz, K. and Shuster, E. O. (2009). Optimizing sporulation conditions for different Saccharomyces cerevisiae strain backgrounds. Methods Mol. Biol. 557, 21-26.
Ferrari, S., Savatin, D. V., Sicilia, F., Gramegna, G., Cervone, F. and Lorenzo, G. D. (2013). Oligogalacturonides: plant damage-associated molecular patterns and regulators of growth and development. Front. Plant Sci. 13, 44-49. Francis, K. E., Lam, S. Y. and Copenhaver, G. P. (2006). Separation of Arabidopsis
pollen tetrads is regulated by QUARTET1, a pectin methylesterase gene. Plant Physiol. 142, 1004-1013.
Heustis, R. J., Ng, H. K., Brand, K. J., Rogers, M. C., Le, L. T., Specht, C. A. and Fuhrman, J. A. (2012). Pharyngeal polysaccharide deacetylases affect development in the nematode C. elegans and deacetylate chitin in vitro. PLoS ONE 7, e40426.
Kurita, K., Kamiya, M. and Nishimura, S.-I. (1991). Solubilization of a rigid polysaccharide: controlled partial N-acetylation of chitosan to develop solubility. Carbohydr. Polym. 16, 83-92.
Lewis, K. C., Selzer, T., Shahar, C., Udi, Y., Tworowski, D. and Sagi, I. (2008). Inhibition of pectin methyl esterase activity by green tea catechins. Phytochemistry 69, 2586-2592.
Luschnig, S., Bä tz, T., Armbruster, K. and Krasnow, M. A. (2006). serpentine and vermiform encode matrix proteins with chitin binding and deacetylation domains that limit tracheal tube length in Drosophila. Curr. Biol. 16, 186-194.
McCartney, L., Blake, A. W., Flint, J., Bolam, D. N., Boraston, A. B., Gilbert, H. J. and Knox, J. P. (2006). Differential recognition of plant cell walls by microbial xylan-specific carbohydrate-binding modules. Proc. Natl. Acad. Sci. USA 103, 4765-4770. Mouille, G., Ralet, M.-C., Cavelier, C., Eland, C., Effroy, D., Hématy, K., McCartney, L., Truong, H. N., Gaudon, V., Thibault, J.-F. et al. (2007). Homogalacturonan synthesis in Arabidopsis thaliana requires a Golgi-localized protein with a putative methyltransferase domain. Plant J. 50, 605-614. Nakagawa, T., Kurose, T., Hino, T., Tanaka, K., Kawamukai, M., Niwa, Y.,
Toyooka, K., Matsuoka, K., Jinbo, T. and Kimura, T. (2007). Development of series of gateway binary vectors, pGWBs, for realizing efficient construction of fusion genes for plant transformation. J. Biosci. Bioeng. 104, 34-41.
Ogawa, M., Kay, P., Wilson, S. and Swain, S. M. (2009). ARABIDOPSIS DEHISCENCE ZONE POLYGALACTURONASE1 (ADPG1), ADPG2, and QUARTET2 are Polygalacturonases required for cell separation during reproductive development in Arabidopsis. Plant Cell 21, 216-233.
Peaucelle, A., Louvet, R., Johansen, J. N., Hö fte, H., Laufs, P., Pelloux, J. and Mouille, G. (2008). Arabidopsis phyllotaxis is controlled by the methyl-esterification status of cell-wall pectins. Curr. Biol. 18, 1943-1948.
Peaucelle, A., Braybrook, S. A., Le Guillou, L., Bron, E., Kuhlemeier, C. and Hö fte, H. (2011a). Pectin-induced changes in cell wall mechanics underlie organ initiation in Arabidopsis. Curr. Biol. 21, 1720-1726.
Peaucelle, A., Louvet, R., Johansen, J. N., Salsac, F., Morin, H., Fournet, F., Belcram, K., Gillet, F., Hö fte, H., Laufs, P. et al. (2011b). The transcription factor BELLRINGER modulates phyllotaxis by regulating the expression of a pectin methylesterase in Arabidopsis. Development 138, 4733-4741.
Pedersen, H. L., Fangel, J. U., McCleary, B., Ruzanski, C., Rydahl, M. G., Ralet, M.-C., Farkas, V., von Schantz, L., Marcus, S. E., Andersen, M. C. F. et al. (2012). Versatile high resolution oligosaccharide microarrays for plant glycobiology and cell wall research. J. Biol. Chem. 287, 39429-39438. Pelloux, J., Rustérucci, C. and Mellerowicz, E. J. (2007). New insights into pectin
methylesterase structure and function. Trends Plant Sci. 12, 267-277. Rhee, S. Y., Osborne, E., Poindexter, P. D. and Somerville, C. R. (2003).
Microspore separation in the quartet 3 mutants of Arabidopsis is impaired by a defect in a developmentally regulated polygalacturonase required for pollen mother cell wall degradation. Plant Physiol. 133, 1170-1180.
Rinaudo, M. (2006). Chitin and chitosan: properties and applications. Prog. Polym. Sci. 31, 603-632.
Roy, H. E., Steinkraus, D. C., Eilenberg, J., Hajek, A. E. and Pell, J. K. (2006). Bizarre interactions and endgames: entomopathogenic fungi and their arthropod hosts. Annu. Rev. Entomol. 51, 331-357.
Sørensen, I., Pettolino, F. A., Bacic, A., Ralph, J., Lu, F., O’Neill, M. A., Fei, Z., Rose, J. K. C., Domozych, D. S. and Willats, W. G. T. (2011). The charophycean green algae provide insights into the early origins of plant cell walls. Plant J. 68, 201-211.
Sorlier, P., Hartmann, D. J., Denuzière, A., Viton, C. and Domard, A. (2003). Preparation and development of anti-chitosan antibodies. J. Biomed. Mater. Res. A. 67, 766-774.
Tsigos, I., Martinou, A., Kafetzopoulos, D. and Bouriotis, V. (2000). Chitin deacetylases: new, versatile tools in biotechnology. Trends Biotechnol. 18, 305-312.
van Alebeek, G.-J. W. M., van Scherpenzeel, K., Beldman, G., Schols, H. A. and Voragen, A. G. J. (2003). Partially esterified oligogalacturonides are the preferred substrates for pectin methylesterase of Aspergillus niger. Biochem. J. 372, 211-218. Verhertbruggen, Y., Marcus, S. E., Haeger, A., Ordaz-Ortiz, J. J. and Knox, J. P. (2009). An extended set of monoclonal antibodies to pectic homogalacturonan. Carbohydr. Res. 344, 1858-1862.
Wang, S., Jayaram, S. A., Hemphä lä, J., Senti, K.-A., Tsarouhas, V., Jin, H. and Samakovlis, C. (2006). Septate-junction-dependent luminal deposition of chitin deacetylases restricts tube elongation in the Drosophila trachea. Curr. Biol. 16,
180-185.
DEVEL
O
Willats, W. G. T., Gilmartin, P. M., Mikkelsen, J. D. and Knox, J. P. (1999). Cell wall antibodies without immunization: generation and use of de-esterified homogalacturonan block-specific antibodies from a naive phage display library. Plant J. 18, 57-65.
Willats, W. G. T., Orfila, C., Limberg, G., Buchholt, H. C., van Alebeek, G. J., Voragen, A. G., Marcus, S. E., Christensen, T. M., Mikkelsen, J. D., Murray, B. S. et al. (2001). Modulation of the degree and pattern of methyl-esterification of
pectic homogalacturonan in plant cell walls. Implications for pectin methyl esterase action, matrix properties, and cell adhesion. J Biol. Chem. 276, 19404-19413. Wolf, S., Mouille, G. and Pelloux, J. (2009). Homogalacturonan
methyl-esterification and plant development. Mol. Plant. 2, 851-860.
Wolf, S., Mravec, J., Greiner, S., Mouille, G. and Hö fte, H. (2012). Plant cell wall homeostasis is mediated by brassinosteroid feedback signaling. Curr. Biol. 22, 1732-1737.
DEVEL
O
Supplemetary Material and Methods
MALDI-TOF-MS
2 μL of a 9 mg/mL mixture of 2,5-dihydroxybenzoic acid (DHB) in 30% acetonitrile was applied to a MTP
384-spot ground steel target plate TF (Bruker Daltonics). A 1 μL sample was then mixed into the DHB
droplet and dried under a stream of air. The samples were analysed with an Ultraflex MALDI-ToF/ToF
instrument (Bruker Daltonics GmbH, Bremen, Germany) equipped with a nitrogen 337 nm laser beam. The
instrument was operated in positive acquisition mode and controlled by the FlexControl 3.0 software
package. All spectra were obtained using the reflectron mode with an acceleration voltage of 25kV, a
reflector voltage of 26kV, and pulsed ion extraction of 40 ns in the positive ion mode. The acquisition range
used was from m/z 0 to 4000. The data was collected from averaging 1000 laser shots, with the lowest laser
energy necessary to obtain sufficient signal to noise ratios. Peak lists were generated from the MS spectra
using Bruker FlexAnalysis software (Version 3.3).
A
B
C
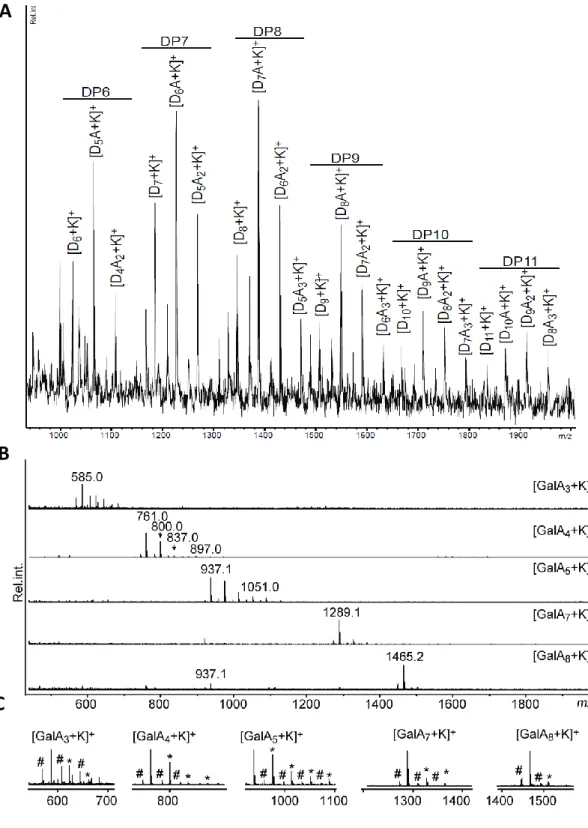
Fig. S1. Oligosaccharide analysis using MALDI-ToF-MS. (A) MALDI-ToF-MS spectrum
of the chitosan oligosaccharides used to produce the COS probes. D
nis the degree of
polymerisation and A
nis the number N-acetyl substitutions (B) MALDI-ToF-MS spectra of
oligogalacturonides used on the microarrays and, in the case of GalA7, used to produce OGA
probes. (C) Mass spectrum fragments showing sodium (hash) and potassium (asterisk)
adducts from the spectrum shown in (B).
Polysaccharides
C
2F4 JIM5 LM18 LM19 PAM1 LM20 JIM7 COS488 OGA488 A nt i-H G ant ibodi e s Oligosaccharides 2.7 mm 7.8 m m LM19 2F4 2F4 JIM5 LM18 LM19 PAM1 LM20 JIM7 COS488 OGA488 A nt i-H G ant ibodi e s COS488A
B
Fig. S2. Binding specificity of COS and OGA. Carbohydrate microarrays populated with (A)
polysaccharides and (B) oligosaccharides were probed with a selection of anti-homogalacturonan
antibodies (listed to the right), COS
488and OGA
488. The heatmap shows mean signal intensities from
three replicate arrays. The highest signal in the data set was set to 100 and all other values adjusted
accordingly. (C) Representative examples of carbohydrate microarrays from which the heatmap was
produced.
A
B
E
C
D
F
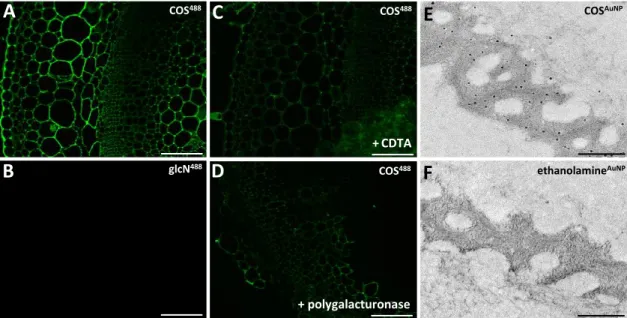
COS488 glcN488 COS488 COS488 +CDTA + polygalacturonase COSAuNP ethanolamineAuNPFig. S3. Microscopy labelling controls for COS
binding. (A-D) Sections through tobacco
stem labelled with COS
488(A) and control conjugate glucosamine
488(B). Glucosamine was
coupled to Alexa Fluor 488 using the same procedure as for COS
488. Binding of COS
488to
tobacco sections was reduced by pre-treatment with a reagent used to extract pectins
1,2-cyclohexanediaminetetraaceticacid (C) and the homogalacturonan-degrading enzyme
polygalacturonase (D). (E) Transmission electron microscopy images showing resin-embedded
sections of P. margaritaceum labelled with COS coupled with nanogold particles (COS
AuNP)
and enhanced with silver. (F) A control image showing labelling with ethanolamine
AuNP. Scale
E
Distance (pixels) 1 2 3 4 5 1 2 3 4 5 1 2 3 4 5 1 2 3 4 5 1 2 3 4 5F
G
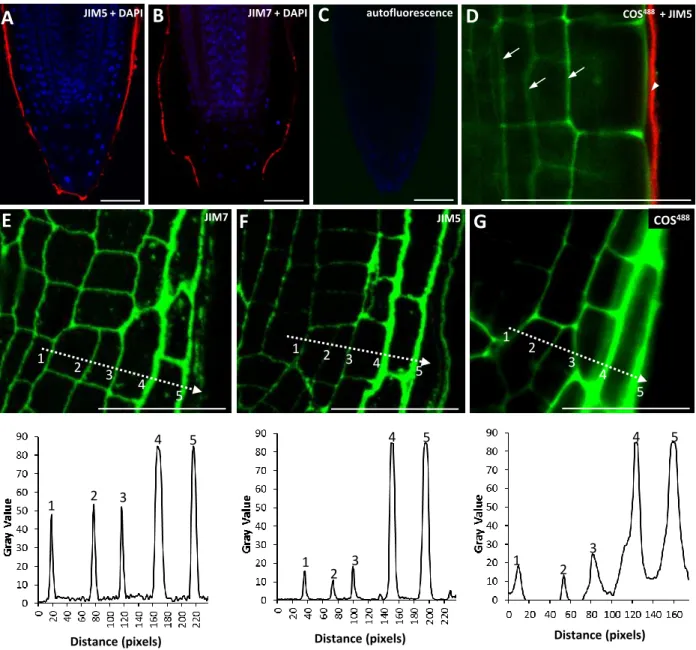
JIM7 JIM5D
A
JIM5 + DAPIB
C
autofluorescence COS488 + JIM51 2 3 4 5 JIM7 + DAPI COS488 Distance (pixels) Distance (pixels)
Fig. S4. Analyses of root tip labelling by mAbs and COS probes. (A,B) Whole mount labelling
of Arabidopsis root tips using JIM5 (A) and JIM7 (B). Antibody binding was visualized using with
rhodamine-tagged secondary antibody (red). Nuclei are stained with DAPI blue. (C) Control image
showing an Arabidopsis root tip labeled with secondary antibody only. (D) Dual labelling of a
whole unfixed Arabidopsis root with COS
488(green) and the anti-HG monoclonal antibody JIM5
(detected with rhodamine-tagged secondary antibody, red). Note that whilst COS
488penetrates to the
cortical parenchyma (arrows), JIM5 does not penetrate the root (arrowhead). (E-G) Signal intensity
analyses of HG labelling in lateral root caps. (E,F) Top panels, sections through resin-embedded
root tips labeled by antibodies (E) JIM7 and (F) JIM5. (G) In vivo labeling of a whole root tip using
COS
488. Bottom panels: plot profiles showing fluorescence intensities of the regions indicated by the
dashed line in the panels above. The positions of the areas producing the peaks are indicated by
numbers 1-5. Note that the signal plot profiles indicate a significant increase of JIM5 and COS
488G
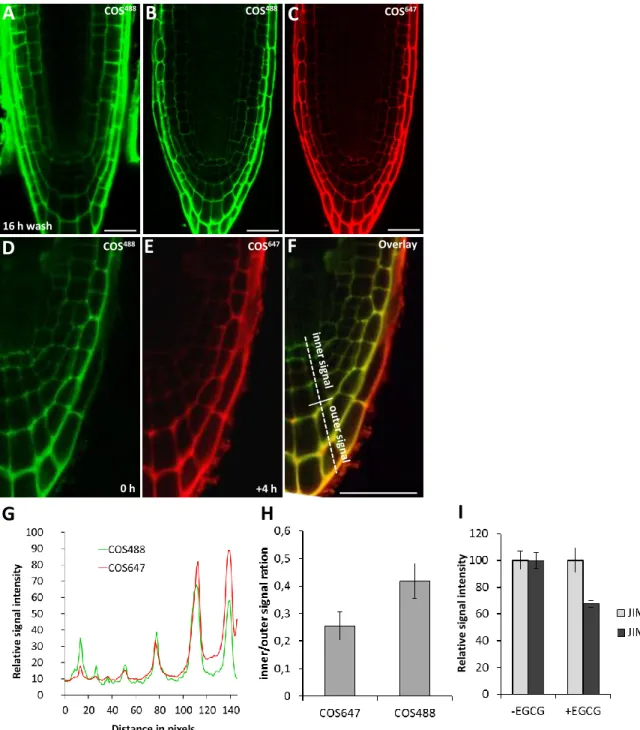
H
I
D
COS488E
COS647F
OverlayFig. S5. Dynamics of HG turn-over in root cap. (A) Control for the stability of the COS
488labelling.
Fixed roots were stained with COS
488, washed 3 times and incubated in the labelling buffer for 16h
before scanning. No significant wash-out of the probe was observed. (B,C) Comparison of two COS
fluorescent variants simultaneously applied to root tips. (B) COS
488and (C) COS
647have identical
labeling patterns and penetration properties. (D-G) Time lapse labeling of the root tip by two COS
variants but in a reverse order as shown in Fig. 3H-K. Seedlings were labelled first using COS
488,
washed
and allowed to grow for 4 hours. Seedlings were then re-labelled with COS
647and washed.
The simultaneous scan of (D) COS
488and (E) COS
647labelling at the end of the experiment. (F) Overlay
image showing the occurrence of newly formed epitopes present in mature layers of the root tip. (G) Plot
profile of the dashed line indicated in (F). (H) Quantification of the difference in signal intensities from
COS
488and COS
647in the ‘inner’ and ‘outer’ regions indicted in (F) from 8 root tips. The inner region
denotes the first three columella layers and outer region the last two columella layers. Note the higher
difference between the two signals in the case of COS
647(freshly formed epitopes) labelling indicating
more signal from the outer region. (I) The effect of EGCG (4 hours at 200 μM EGCG) on JIM5 and JIM7
labeling of root tip resin sections. The JIM7 signal was unchanged whilst the JIM5 signal was reduced in
roots treated by EGCG. Error bars indicate s.e.m. n=8. Scale bars: 10 μm
R e lat iv e s ig nal int e ns it y
B
COS488C
COS647A
COS488 16 h wash 0 h +4 hPMEI-like
PME-like
Fig. S6. In silico expression analyses of PME- and PME-like genes. Microarray
data of PME-like and PMEI-like genes expressed in Arabidopsis root tip from
public database (
https://www.genevestigator.com
). Only those with significant
expression in root tips are shown. The expression in the root cap is highlighted by
red outline. The root cap specific genes analyzed by GUS reporter constructs are
indicated by red arrowheads.
cu my my sp sp cu cu cu