HAL Id: pasteur-03236121
https://hal-pasteur.archives-ouvertes.fr/pasteur-03236121
Submitted on 26 May 2021
HAL is a multi-disciplinary open access
archive for the deposit and dissemination of
sci-entific research documents, whether they are
pub-lished or not. The documents may come from
teaching and research institutions in France or
abroad, or from public or private research centers.
L’archive ouverte pluridisciplinaire HAL, est
destinée au dépôt et à la diffusion de documents
scientifiques de niveau recherche, publiés ou non,
émanant des établissements d’enseignement et de
recherche français ou étrangers, des laboratoires
publics ou privés.
Distributed under a Creative Commons Attribution| 4.0 International License
are associated with fatal Lassa fever in macaques
Nicolas Baillet, Stéphanie Reynard, Emeline Perthame, Jimmy Hortion,
Alexandra Journeaux, Mathieu Mateo, Xavier Carnec, Justine Schaeffer,
Caroline Picard, Laura Barrot, et al.
To cite this version:
Nicolas Baillet, Stéphanie Reynard, Emeline Perthame, Jimmy Hortion, Alexandra Journeaux, et al..
Systemic viral spreading and defective host responses are associated with fatal Lassa fever in macaques.
Communications Biology, Nature Publishing Group, 2021, 4 (1), pp.27. �10.1038/s42003-020-01543-7�.
�pasteur-03236121�
ARTICLE
Systemic viral spreading and defective host
responses are associated with fatal Lassa fever
in macaques
Nicolas Baillet
1,2, Stéphanie Reynard
1,2, Emeline Perthame
3, Jimmy Hortion
1,2, Alexandra Journeaux
1,2,
Mathieu Mateo
1,2, Xavier Carnec
1,2, Justine Schaeffer
1,2, Caroline Picard
1,2, Laura Barrot
4,
Stéphane Barron
4, Audrey Vallve
4, Aurélie Duthey
4, Frédéric Jacquot
4, Cathy Boehringer
4, Grégory Jouvion
5,
Natalia Pietrosemoli
3, Rachel Legendre
3, Marie-Agnès Dillies
3, Richard Allan
6, Catherine Legras-Lachuer
6,
Caroline Carbonnelle
4, Hervé Raoul
4& Sylvain Baize
1,2✉
Lassa virus (LASV) is endemic in West Africa and induces a viral hemorrhagic fever (VHF) with up to 30% lethality among clinical cases. The mechanisms involved in control of Lassa fever or, in contrast, the ensuing catastrophic illness and death are poorly understood. We used the cynomolgus monkey model to reproduce the human disease with asymptomatic to mild or fatal disease. After initial replication at the inoculation site, LASV reached the sec-ondary lymphoid organs. LASV did not spread further in nonfatal disease and was rapidly controlled by balanced innate and T-cell responses. Systemic viral dissemination occurred during severe disease. Massive replication, a cytokine/chemokine storm, defective T-cell responses, and multiorgan failure were observed. Clinical, biological, immunological, and transcriptomic parameters resembled those observed during septic-shock syndrome, sug-gesting that similar pathogenesis is induced during Lassa fever. The outcome appears to be determined early, as differentially expressed genes in PBMCs were associated with fatal and non-fatal Lassa fever outcome very early after infection. These results provide a full char-acterization and important insights into Lassa fever pathogenesis and could help to develop early diagnostic tools.
https://doi.org/10.1038/s42003-020-01543-7 OPEN
1Unité de Biologie des Infections Virales Emergentes, Institut Pasteur, Lyon, France.2Centre International de Recherche en Infectiologie (CIRI), Université de
Lyon, INSERM U1111, Ecole Normale Supérieure de Lyon, Université Lyon 1, CNRS UMR5308, Lyon, France.3Hub de Bioinformatique et Biostatistique–
Département Biologie Computationnelle, Institut Pasteur, USR 3756 CNRS, Paris, France.4Laboratoire P4 INSERM– Jean Mérieux, INSERM US003,
Lyon, France.5Neuropathologie Expérimentale, Département de Santé Globale, Institut Pasteur, Paris, France.6ViroScan3D SAS, Trévoux, France.
✉email:[email protected]
123456789
L
assa Fever is a viral hemorrhagic fever that is endemic in Nigeria and the Mano River Union countries (Sierra Leone, Guinea, and Liberia), with sporadic cases in bordering West African countries and recent outbreaks in Benin1,2. Lassa feverrepresents a significant cause of morbidity and mortality, with tens of thousands of cases annually and thousands of fatalities. The main natural host of Lassa virus (LASV), a Mammarenavirus of the Arenaviridae family, is the widespread and commensal rodent Mastomys natalensis, but alternate rodent reservoirs have been described3. Rodent-to-human transmission of LASV
gen-erally occurs after the inhalation of contaminated dust or cutaneous-mucosal contact with material soiled by rats, and human-to-human transmission is then observed4. Approximately
20–40% of hospitalized patients succumb to infection. No licensed vaccine or treatment with demonstrated efficacy is cur-rently available. Lassa fever has been recently listed by the WHO as an epidemic threat requiring urgent preparedness.
The diverse LASV strains are grouped into seven major lineages based on their geographical location. Lineages I, II, and III circulate in Nigeria and lineage IV strains were isolated in the Mano River Union countries of Guinea, Sierra Leone, and Liberia. Three additional lineages have recently emerged in Mali, Cote d’Ivoire, Ghana, Togo, and Benin2,5–7. The two strains used in
this study, AV and Josiah, belong to lineage V and IV, respec-tively, and are known to induce a severe disease in humans and non-human primates (NHPs)8,9. The AV strain has been isolated
in a fatally-infected patient in 2000, whereas the Josiah strain represents the prototypic and reference LASV strain used in almost all studies. These strains are phylogenetically close as they share ~82% of nucleotide homology and 95% of amino acids identity, based on the S segment9. A large number of Lassa fever patients experience asymptomatic infections or mild symptoms, such as fever, headache, and asthenia. In other patients, fever, asthenia, anorexia, abdominal pain, nausea, vomiting, diarrhea, cough, and sore throat are observed. Edema of the face and neck, conjunctivitis, hemorrhage, and acute respiratory distress then occur in severe patients. The terminal stage is characterized by multiorgan failure and terminal shock10. In survivors, sequelae
may appear after recovery, including sensorineural hearing loss11.
The location of endemic areas and the difficulty in accessing patients have stifled the investigation of Lassa fever in humans. Our current understanding of the pathogenesis and immune response comes from animal models but is still limited. Animals, such as immunocompromised mice and strain 13 guinea pigs, are widely used to screen vaccines and therapeutics, but they fail to mirror human disease12–15. Only NHPs fully mimic the clinical
signs, viral tropism, immune responses, pathophysiological changes, and various outcomes observed in humans8,16–21. LASV
infection is believed to begin with the targeting of macrophages and dendritic cells (DCs), with subsequent spreading to other cells22. However, direct viral cytopathic effects are not sufficiently
severe to account for the observed vascular permeability and multiorgan failure. Thus, the cascade of pathogenic events that leads to terminal shock and death is still poorly known. Similarly, the immune mechanisms that allow patients to clear LASV infection and recover from Lassa fever have not been identified. Although macrophages and DCs may be thefirst target cells, they are not activated and do not secrete high amounts of cytokines. Low titers of neutralizing antibodies have been observed in NHPs and patients only after recovery and therefore do not correlate with survival. However, we and others have demonstrated that early activation and strong proliferation of T cells are associated with the control of LASV and recovery from Lassa fever in cynomolgus monkeys8,23,24. A robust T-cell response was also
correlated with viremia resolution in a human case of Lassa Fever25. Here, we further explored the pathogenesis of Lassa fever
and the immune responses induced by LASV by infecting cynomolgus monkeys with two different LASV strains: Josiah and AV, using the same dose and route of inoculation. Subcutaneous infection with LASV-AV resulted in nonfatal Lassa fever with moderate clinical signs, whereas all the animals infected with LASV-Josiah succumbed to Lassa fever. Thus, we performed a full characterization of Lassa fever pathophysiogenesis in an NHP model by analyzing clinical pathology, viral tropism and dynamics, histopathological changes, cytokine profile, immune responses, and transcriptomic signatures that are associated with fatal and nonfatal Lassa fever during the course of infection and disease.
Results
Clinical parameters and viral spreading during Lassa fever. Cynomolgus monkeys were subcutaneously inoculated at the back of the thigh with 1000 focus-forming units (FFU) of LASV-AV (n= 4) or LASV-Josiah (n = 6) (Fig. S1a), whereas three were mock-infected. The animals were then monitored for 28 days and attributed clinical scores based on body tempera-ture, weight, food and water intake, behavior, and clinical signs, with an endpoint score of 15. All Josiah-infected animals pre-sented clinical scores that increased relentlessly from day 3 and were killed 11–15 days post infection (DPI) (Fig. 1a). They presented severe symptoms, with a high fever from day 4 and hypothermia at the terminal stages, asthenia, piloerection, anorexia, and continuous weight loss (Fig. S1b). One animal presented epistaxis on the day of euthanasia, whereas abdom-inal extravasation was detected in two others at necropsy. AV-inoculated animals experienced only mild clinical signs with no fever and a moderate clinical score due to weight loss and recovered by ~15 DPI (Fig.1a). C-reactive protein (CRP) levels in the plasma of LASV-infected animals increased (Fig. S1c). Viral RNA appeared in the plasma of infected animals as soon as three DPI and infectious particles were first detected in Josiah- and AV-infected animals at 6 and 8 DPI, respectively (Fig. 1b). Viremia peaked at 12 DPI and then decreased in survivors, whereas it increased relentlessly in the Josiah-infected animals. Similar results were obtained in bone mar-row (BM) samples, except that viral RNA was still detectable in the survivor samples 28 DPI (Fig. S1 d, e).
Additional groups of three animals were also infected with LASV-AV or LASV-Josiah and sequentially killed 2, 5, and 11 (only AV for this last timepoint) DPI to obtain access to the organs during the incubation period, at the onset of viremia, and at the peak of the disease (Fig. S1a). We also quantified the viral loads in organs obtained from the sequentially killed animals. Viral RNA was detected in the skin, close to the inoculation site, of all Josiah-and AV-infected animals as soon as 2 DPI, as well as in the spleen, inguinal lymph nodes (ILNs), and thymus of one and two, respectively, Josiah-infected animals and in the mesenteric lymph nodes (MLNs) of two of three AV-infected NHPs (Fig. 1c). Infectious particles were also detected in the skin of almost all infected animals. Five days after infection, the highest amounts of viral RNA were found for all animals in the skin, ILNs, MLNs, and spleen. The liver, cerebellum, kidneys, adrenal glands, intestines, lungs, thymus, and pancreas also contained viral RNA. At this timepoint, we detected infectious particles in the secondary lymphoid organs (SLOs), skin, and liver of all Josiah- and most AV-infected animals, whereas we detected LASV in the kidneys, adrenal glands, large intestine, lungs, reproductive system, and pancreas of Josiah-infected animals only. At 11 DPI, corresponding to the peak of the disease, all assessed tissues contained viral RNA. However, viral loads were 10- to 1000-fold higher in organs after infection with LASV-Josiah than with LASV-AV. In AV-infected
animals, the presence of infectious particles in the lymphoid organs, liver, adrenal glands, intestines, skin, lungs, reproductive system, and pancreas was heterogeneous. In contrast, all organs of Josiah-infected NHPs contained very high LASV titers, particularly the
adrenals and central nervous system (CNS). In these animals, the viral RNA to titer ratio, an indicator of the efficiency of viral replication, ranged between 100 and 1000 for most tissues, except for brain and cerebellum, for which it was ~3000, and liver and
Fig. 1 Clinical and virological features of Lassa fever. a Clinical score, survival rate, and monitoring of body temperature are presented. Results show mean values and individual data for each cohort, except for survival rate, represented with a Kaplan–Meier curve. Controls (n = 3), LASV-AV (n = 4), LASV-Josiah (n = 6). *p < 0.05, **p < 0.01, ***p < 0.001, ****p < 0.0001, as determined by a one-way ANOVA multiple comparisons test for analysis between controls and AV- and Josiah-infected animals and by at test for comparison between only controls and AV-infected NHPs. Red asterisks indicate a significant difference between LASV-Josiah and controls, blue asterisks a significant difference between LASV-AV and controls, and black asterisks a significant difference between LASV-Josiah and LASV-AV. b Quantification of viral load and infectious particles in the plasma of animals according to the time after LASV infection. Mean values of each cohort and individual data points are presented as the number of viral RNA copies/ml (viral load) or FFU/ ml (infectious particles) according to the time after challenge with AV (blue dots) or Josiah (red dots). LASV-AV (n = 4), LASV-Josiah (n = 6). The individual data at the time before the death of all LASV-Josiah-infected primates were used to calculate the mean determined at 12 DPI *p < 0.05, **p < 0.01, as determined by a Student’s t test. c Quantification of viral RNA copies and infectious particles per milligram of various tissues, including inguinal lymph nodes (ILN), mesenteric lymph nodes (MLN), small intestine (Small int.), large intestine (Large int.), the reproductive system (ovaries or testicles) (Reprod. system), and cerebrospinalfluid (CSF) at 2 (left panel), 5 (middle panel), and 11 (right panel) DPI. Individual and mean values are presented for the two cohorts. *p < 0.05, as determined by a Student’s t test.
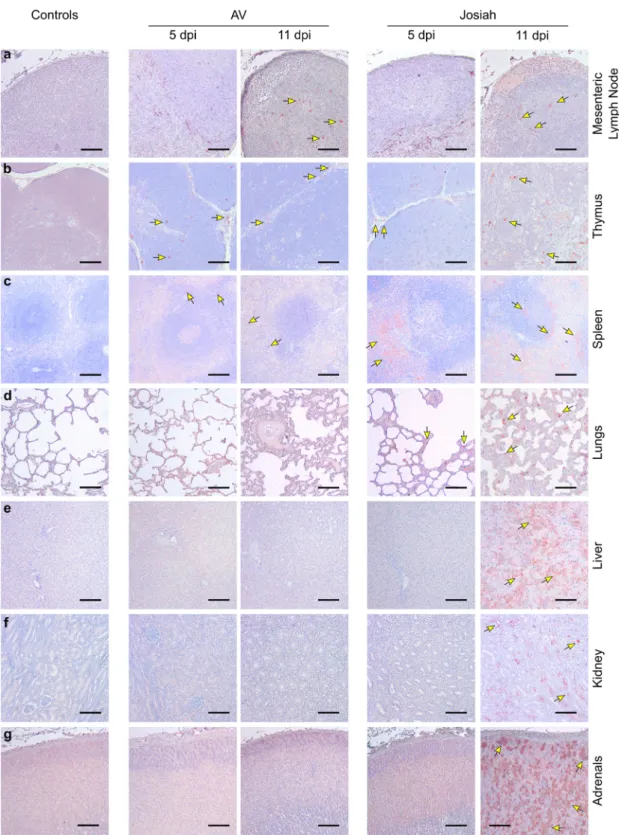
pancreas, for which the ratio was ~30 (Fig. S1f). Viral RNA was still present 28 DPI in the tissues of AV-infected animals (Fig. S1g). Histopathological features of Lassa fever. The earliest patholo-gical events were mostly detectable at 5 DPI in the SLOs and lungs of infected NHPs. In the LNs, AV-, and Josiah-infected animals exhibited an alteration of the cortex architecture, char-acterized by disorganization or hyperplasia of the lymphoid fol-licles (Fig. S2a middle and right panel). At 11 DPI, the loss of follicle architecture was still observable in AV- and Josiah-infected animals, often with hyperplasia of macrophages, some-times containing phagocytized apoptotic bodies (tingible-body macrophages; see insets). LASV was frequently observed 5 DPI in non-lymphocytic cells in all infected animals and was still observable in LNs 11 DPI (Fig. 2a). AV-infected cynomolgus monkeys also exhibited apoptotic lymphocytes in the thymus as soon as 5 DPI (Fig. S2b middle panel). There was also massive lymphocyte apoptosis 11 DPI in the thymus of Josiah-infected animals (Fig. S2b right panel). LASV was detected at 5 and 11 DPI in the thymus of all infected NHPs (Fig.2b). In the spleen, amyloid protein was present in the center of lymphoid follicles of all Josiah-infected animals and in one AV-infected animal (Fig. S2d inset). There were numerous tingible-body macrophages in the Josiah-infected NHPs. Accordingly, LASV was observable in the spleen as soon as 5 DPI, and more frequently at 11 DPI, in both AV- and Josiah-infected animals (Fig. 2c). However, the distribution of LASV antigen was much more widespread in the Josiah-infected animals. We did not observe histopathological changes in the lungs of the AV-infected NHPs, either at 5 or 11 DPI, with the exception of one of three animals at each timepoint that presented minor foci of interstitial pneumonitis (Fig. S2c middle panel). This was more pronounced in the Josiah-infected animals, with infiltration of mononucleated cells, resulting in thickening of the alveolar walls prior to death at 11 DPI (Fig. S2c right panel). LASV was also present in the alveolar cells of Josiah-infected animals 5 and particularly 11 DPI (Fig.2d). Although we detected minor evidences of inflammation in the liver of AV-infected NHPs, the Josiah-AV-infected animals showed portal to more extensive hepatitis (with apoptosis of hepatocytes for one out of three animals) (Fig. S2e). These observations are in accordance with the strong widespread LASV immunopositive staining throughout the hepatic parenchyma and observed only in Josiah-infected NHPs (Fig. 2e). We observed similar
inflam-mation patterns in the kidneys in the vicinity of arteries from the cortico-medullary junction in Josiah- but not AV-infected ani-mals (Fig. S2f). Accordingly, LASV was detectable in cells from the cortico-medullary junction in Josiah- but not AV-infected NHPs (Fig. 2f). We detected foci of LASV-positive adrenal cor-tical cells in the zona glomerulosa and zona fasciculata of all Josiah- but not AV-infected animals (Fig.2g). Although probably nonspecific, the cerebral cortex of all infected animals showed edema. However, at 11 DPI, we detected perivascular cuffing and microglial activation, i.e., signs of cerebral inflammation encountered in severe forms of the disease, in the brain of Josiah-infected CMs (Fig. S2g). Histopathological features were also present during recovery 28 DPI in some AV-infected animals. We indeed detected inflammatory infiltrates centered on (i) hepatic portal tracts (Fig. S2h), (ii) renal cortico-medullary junction and medulla (Fig. S2i), (iii) myocardial arteries (Fig. S2j) and (iv) 2 cerebral blood vessels (perivascular cuffing, Fig. S2k).
Biochemical analytes and soluble mediators during Lassa fever. There was a slight but significant increase in the concentration of aspartate aminotransferase (AST) and alanine aminotransferase (ALT) in survivors at 10 DPI, which returned to basal values 21
DPI. AST and ALT levels increased earlier and were much higher until death in Josiah-infected cynomolgus monkeys (Fig. 3a). High concentrations of lactate dehydrogenase (LDH) were pre-sent in the plasma of the animals that died from day 6, increasing steadily until death. In contrast, the increase in LDH levels occurred later and was moderate in survivors. The level of albumin (ALB) dropped in both groups, with the minimum values at the peak of the disease in the survivors. Creatinine and urea levels increased substantially in Josiah-infected NHPs. We observed low levels of Na+and Cl−in the plasma at the terminal stages of the animals that died.
We then have set out the profiles of circulating soluble mediators in infected animals. Concerning pro-inflammatory cytokines, plasma levels of IL-6, TNFα, and IL12/23 started rising from 6 to 8 DPI and continued rising until death at 12 DPI in Josiah- but not AV-infected animals (Fig. 3b). There was a transient release of IFNα, peaking at 6 DPI, for all infected animals. IL-15 levels increased in animals starting from 2 DPI and continued to rise until death for the Josiah-infected NHPs, whereas they returned to basal values 15 DPI for the AV-infected animals. The levels of anti-inflammatory cytokines IL-1RA and IL-10 increased dramatically from 6 DPI to death in the Josiah-infected animals, whereas there was only a moderate increase in AV-infected NHPs from 6 to 15 or 28 DPI for IL-1RA and IL-10, respectively (Fig. 3c). Monocyte chemoattractant protein (MCP) 1 and macrophage inflammatory protein (MIP) 1β concentra-tions slightly and transiently increased in AV-infected animals, whereas high and increasing levels were measured in the terminal stages for the Josiah-infected animals (Fig. 3d). IL-8 was transiently secreted at 1 DPI in the Josiah-infected NHPs, whereas its release was delayed and more sustained in the AV-infected animals. Wefinally assessed different soluble mediators involved in cytotoxic activities and regulation of the immune response. We detected elevated levels of soluble (s) CD137 and perforin, peaking at 12 DPI in all animals before returning to basal values at ~18 DPI in the AV-infected animals (Fig. 3e). In contrast, a transient increase in granzyme B (GrzB) levels occurred solely in the AV-infected NHPs between 9 and 15 DPI. We detected a moderate and transient peak of soluble CD40L 1 DPI in the Josiah-infected animals, whereas it occurred later, at 6 DPI, in the AV-infected NHPs. A transient release of IFNγ, peaking at 8 DPI, occurred in all infected animals, whereas the level of IL-2 increased significantly in only the Josiah-infected monkeys, until death. Finally, there was a peak in IL-5 secretion between 8 and 15 DPI only in the AV-infected NHPs.
Innate immune responses during Lassa fever. The number of leukocytes tended to transiently drop ~1 week after infection in all animals, but this change was not significant (Fig. 4a). The Josiah-infected NHPs showed an increase in the number of cir-culating granulocytes in the last days before death. Although the granulocytes were all CD10+ neutrophils in thefirst DPI in all animals, the percentage of CD10−granulocytes steadily increased until death after Josiah infection. In the AV-infected animals, there was only a moderate and transient increase in the pro-portion of this cell population. The number of circulating myeloid dendritic cells (mDCs) did not change significantly during the course of the disease, except for a non-significant increase 10 and 11 DPI in AV-infected animals. No data were obtained after 11 DPI. After Josiah infection, a transient increase in monocyte count was observed 3 DPI, was followed by a drop 1 week after infection, and finally rose again in the last days before death. In AV-infected animals, the number of monocytes was elevated from 15 DPI. An activated phenotype was rapidly observed in monocytes in LASV-infected animals, with expression of CD80,
CD86, and CD40. The percentage of CD80+ and CD40+ monocytes was significantly more elevated after Josiah infection, particularly in the terminal stages. NK cell count also transiently dropped about one week after infection in all animals (Fig. 4b). An increasing percentage of NK cells proliferated at the same time in all infected animals, as demonstrated by the expression of KI67. A moderate but significant amount of NK cells expressed CD107a at their surface 6 DPI in infected animals, suggesting a
cytotoxic activity. Finally, the proportion of NKp80-expressing NK cells dramatically dropped during the 2 weeks following infection whatever the LASV strain was, whereas expression of NKG2D was not significantly modified. The percentage of KI67+
NK cells was increased in spleen and MLN 11 DPI in LASV-infected NHPs, and as soon as 5 DPI in the spleen of Josiah-infected animals (Fig. 4c). A moderate but non-significant
increase in GrzB+and CD107a+NK cells was measured in the
Fig. 2 Examples of LASV spreading as a function of the severity of the disease. Immunohistochemistry of LASV-GP (red) during the course of the disease ina MLNs, b thymus, c spleen, d lungs, e liver, f kidneys, and g adrenal glands. a, b Scale bars: 100µm. c–g Scale bars: 200 µm. Key immunohistological features are indicated by arrows.
spleen of LASV-infected animals. A significantly higher propor-tion of GrzB+NK cells was observed in AV-infected NHP MLNs. The percentage of CD107a-expressing NK cells slightly increased from 5 DPI and at 11 DPI in MLN of Josiah- and AV-infected
animals, respectively. The proportion of CXCR3+ NK cells transiently dropped 5 DPI in LASV-infected NHP spleen. In MLN, CXCR3+NK cell percentage decreased moderately by day 5 in Josiah-infected animals and dramatically 11 DPI in AV
Fig. 3 Biochemical and inflammatory responses monitoring after LASV challenge. a Analysis of biological parameters during LASV infection. The data from longitudinally followed and sequentially killed animals at 2, 5, and 11 DPI were collected: controls (n = 3 animals), LASV-AV (n = 10), LASV-Josiah (n = 12). The individual data at the time before the death of all longitudinally followed LASV-Josiah-infected primates were collected to calculate the mean determined at 12 DPI. Results show the mean (curve) and individual data points for each group. Statistical analyses were performed and are presented as in Fig.1. Quantification of pro-inflammatory cytokines b, anti-inflammatory cytokines c, chemokines d, and T-cell response-related mediators e in plasma according to the time after LASV infection.b–e Results show the mean (curve) and individual data points for each group: controls (n = 3), LASV-AV (n = 4), LASV-Josiah (n = 6). Statistical analyses were performed and are presented as in Fig.1.
animals. A transient increase of NKp80+NK cells was observed 5 DPI in Josiah-infected NHPs and from 5 to 11 DPI after AV infection. However, this cell population was significantly decreased compared to control animals from 11 DPI. Finally, we observed an enrichment in CD16+CD56−NK cells from 5 DPI, particularly in Josiah-infected animals.
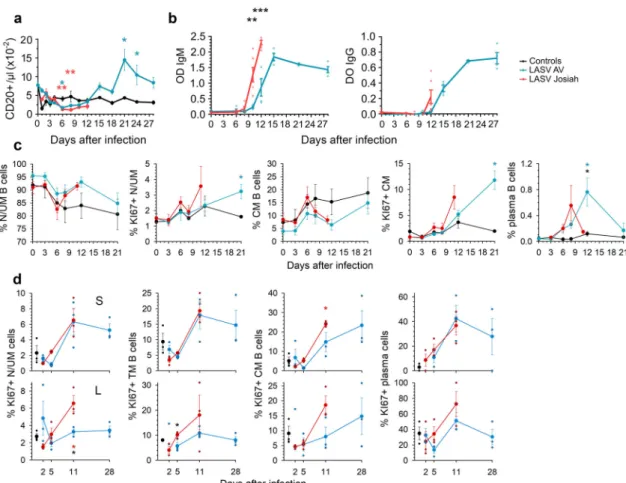
Adaptive immune response during Lassa fever. There was a modest and transient drop in the number of B lymphocytes in both Josiah- and AV-infected NHPs ~6–8 DPI, followed by a significant increase in B-cell number from 2 weeks after infection in AV animals. There was a large increase in both LASV-specific IgM and IgG titers 8 DPI in the Josiah-infected animals, which occurred ~12 DPI in the AV-infected NHPs, with significantly higher titers 12 DPI in the Josiah-infected animals (Fig. 5b). We did not detect
neutralizing antibodies during the course of the disease, with the exception of low titers (1:20) in two of four survivors 28 DPI. There was a drop in the percentage of circulating naive/unconventional memory (N/UM) B cells (CD20+ CD38mid CD27− CD10−) ~1 week after infection, but similar changes were observed in control animals (Fig. 5c). An inverse pattern was observed for conventional memory (CM) B cells (CD20+ CD38mid CD27+ CD10−) in animals. An increase in the percentage of proliferating (KI67+) N/UM and CM B cells was observed 11 and 21 DPI in Josiah- (non-significant) and AV-infected NHPs, respectively. Finally, a transient increase in the proportion of plasma cells (CD20lowCD38brightCD27+) among B cells was observed 8 and 12 DPI in Josiah- and AV-infected NHPs, respectively. In SLO, whereas the percentage of B-cell subpopulations did not change significantly, an increase of the proportion of proliferating U/UM, transitory memory (CD20+CD38midCD10+CD27−), CM, and
Fig. 4 Analysis of circulating innate immune cells after LASV challenge. a The number of leukocytes, granulocytes, mDC (HLA-DR+CD14−CD1c+and HLA-DR+CD14−CD11c+), and monocytes (HLA-DR+CD14+) in the blood is presented according to the time after LASV infection. The percentage of CD10−cells among granulocytes is also presented. The percentage of monocytes expressing CD80, CD86, or CD40 is shown. Results show the mean ± standard error of the mean (SEM) for each group: controls (n = 3), LASV-Josiah (n = 6, except for day 14 where n = 2) and AV-infected animals (n = 4) were analyzed for leukocyte, granulocyte, CD10−, and monocyte numbers. For mDC, CD80, CD86, and CD40 analysis, six AV-infected animals were analyzed from day 0 to 6 and three of them from day 8 to 11.b The number of circulating NK cells (CD8+CD3−CD20−cells) is presented, as well as the percentage of KI67+, CD107a+, NKp80+, and NKG2D+cells among NK cells (n = 3 for controls, n = 6 for LASV-Josiah, and n = 4 for AV-infected animals). Statistical analyses were performed and are presented as in Fig.1. Individual values can be found in Supplementary data 1 for a and b.c The proportion of NK cells (CD8+CD3−CD20−) expressing KI67, (granzyme B) GrzB, CD107a, CXCR3, and NKp80 was quantified in spleen (S, upper graphs) and MLN (L, lower graphs) of controls (n = 3), AV- (n = 3), and Josiah-infected (n = 3) animals, as well as the percentage of CD16+CD56−cells among NK cells. Individual values and mean ± SEM are expressed for each group. Statistical analyses were performed and are presented as in Fig.1.
plasma B cells was observed by 11 DPI in spleen and MLN of infected NHPs, except for N/UM B cells in MLN of AV-infected animals (Fig.5c). Moreover, similar changes were observed in the spleen in all infected NHPs whereas B-cell proliferation was more intense in Josiah-infected animals.
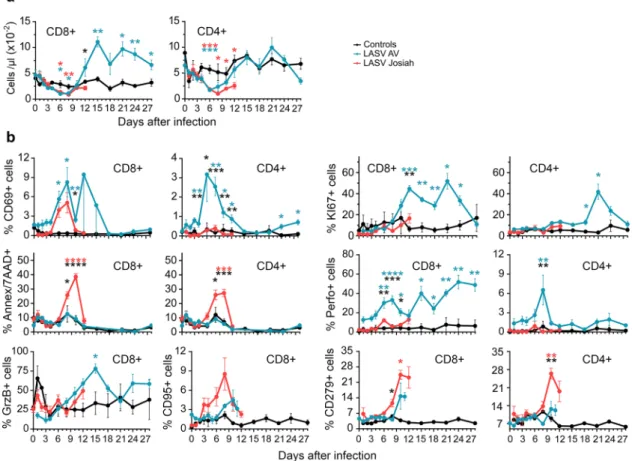
A transient lymphopenia affecting CD8+and CD4+T cells of all infected NHPs was observed from 3 to 10 DPI (Fig. 6a). Lymphocytosis of CD8+and CD4+T cells then occurred only for AV-infected NHPs, starting at 12 DPI. The percentage of CD69-expressing CD8+ cells transiently increased after 4 DPI in all infected NHPs, whereas such an increase in CD4+ T cells occurred between 4 and 15 DPI solely in the AV-infected animals (Fig.6b). The percentage of KI67+CD8+T cells increased by 8 DPI in the AV- but not Josiah-infected animals and remained high during the course of the disease. CD4+ T cells showed a similar pattern, with a transient increase in the proportion of proliferative cells in the AV-infected animals from 18 to 28 DPI. The percentage of apoptotic (Annexin V+/7AAD+) CD8+T and CD4+T cells increased significantly between 6 and 12 DPI after Josiah infection, but not with AV. There was also an increase in the proportion of GrzB− and perforin-expressing CD8+ T
lymphocytes, starting at 6 DPI, in the AV-infected animals, whereas perforin expression of CD4+T cells from AV-infected NHPs transiently increased 8 DPI. Although non-significant, the
proportion of CD8+ CD95+ cells tended to increase more and more rapidly in the Josiah- than AV-infected NHPS. Finally, only Josiah-infected NHPs exhibited a significant increase in the proportion of CD8+CD279+and CD4+CD279+T cells between 6 and 10 DPI.
We assessed CD45RA, CD27, and CD28 levels to investigate the phenotypes of circulating effector/memory T cells induced during Lassa fever (Fig. S3a). The various CD8+and CD4+T-cell subpopulations did not change during the experiment in the control animals. There was an enrichment in naive/pre-effector (pE) 1 CD45RA+CD28+CD27+(RA+28+27+) CD8+T cells in AV-infected NHPs for all timepoints relative to the control animals, as well as a transient increase in the proportion of effector-memory (EM) 4 (RA−28+27−) CD8+ T cells. The proportion of EM4 and terminally differentiated effector-memory (EMRA) (RA+28−27−) CD8+T cells increased between 4 and 8 DPI in the Josiah-infected NHPs. In AV-infected animals, the proportion of pE2 (RA+28−27+), EM2 (RA−28−27+), EM3 (RA−28−27−), and EMRA CD4+T cells increased from 6 DPI. The Josiah-infected NHPs showed a transient increase in the proportion of EM4 and EMRA CD4+T cells from 4 and 6 DPI, respectively.
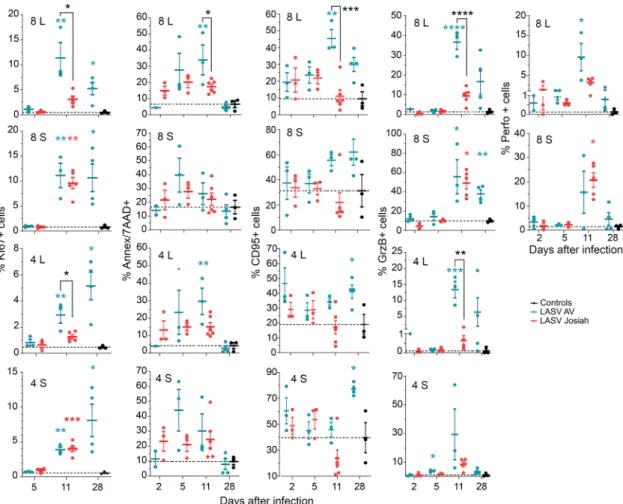
We assessed the phenotype of T cells in the MLNs and spleens 2, 5, and 11 DPI (Fig. 7). The percentage of KI67+CD8+and
Fig. 5 Analysis of B-cell responses after LASV challenge. a The number of B cells (CD20+) in the blood is presented according to the time after LASV infection. Results show the mean ± SEM of control (n = 3), AV (n = 4), and Josiah (n = 6) animals. b Detection of LASV-specific IgM and IgG in animals after LASV infection by ELISA. Individual data (points) and mean values ± SEM for each cohort (curves) are presented. LASV-AV (n = 4), LASV-Josiah (n = 6). **p < 0.01, ***p < 0.001, as determined by a Student’s t test. The percentage of naive/unconventional memory (N/UM) B cells (CD20+CD38mid
CD27−CD10−), of conventional memory (CM) B cells (CD20+CD38midCD27+CD10−), and of plasma B cells (CD20lowCD38brightCD27+) among B
cells (CD20+) is presented, as well as the percentage of KI67+cells among N/UM and CM B cells is presented for bloodc and spleen (S, upper graphs) and MLN (L, lower graphs). Individual values can be found in Supplementary data 1 for a, b and c.d The percentage of KI67+among transitional memory (TM) B cells (CD20+CD38midCD10+CD27−) is also presented for SLOs. Results show the mean ±SEM of control (n = 3), AV (n = 4 for PBMC and three
CD4+ T cells was significantly higher in the MLNs of AV-infected animals 11 and 28 DPI than those of mock- or Josiah-infected NHPs. In the spleen, the proportion of KI67+CD8+and CD4+T cells was significantly higher in all infected animals than in the control group from 11 DPI. The proportion of apoptotic CD8+and CD4+T cells was significantly higher in the MLNs of AV- than Josiah-infected NHPs 11 DPI. We observed an increase in the proportion of CD95+CD8+T cells at 11 and 28 DPI in the LNs and spleens of AV-infected animals. We also observed an increase in the proportion of CD95+ CD4+ T cells of AV-infected NHPs at 28 DPI. We detected a high percentage of GrzB+CD8+T cells in the spleens of all infected animals 11 DPI, while the percentage in MLNs was significantly higher in AV-infected animals. Such an observation was also made for GrzB+ CD4+T cells in spleens and lymph nodes of all infected NHPs at this timepoint. Finally, we observed an increase in the percentage of perforin+CD8+T cells in the MLNs and spleens of all infected primates 11 DPI, but this raise was more important in MLNs of AV animals.
In control animals, the naive/pE1, central memory (CM)/EM1 (RA−28+27+) and EM4 CD8+ T cells were the most highly represented in the spleen, MLNs, and ILNs (Fig. S3b). In AV-infected animals, there was a higher proportion of naive/pE1 and CM/EM1 T cells that further increased 11 DPI in the spleen. There were no significant differences in the CD8+ T-cell
phenotypes in the ILNs or MLNs between the AV- and mock-infected animals. In Josiah-mock-infected monkeys, there was a higher proportion of EM1, EM3, EM4, and EMRA CD8+T cells 11 DPI in the ILNs and MLNs than 5 DPI, which was not the case for
AV-infected animals. Concerning the CD4+T-cell repertory, the proportion of EMRA cells in the spleen was higher 5 DPI for AV-infected animals and 11 DPI for Josiah-AV-infected macaques than in that of control animals. EM1, EM4, and EMRA CD4+T cells only increased in the ILNs of Josiah-infected monkeys.
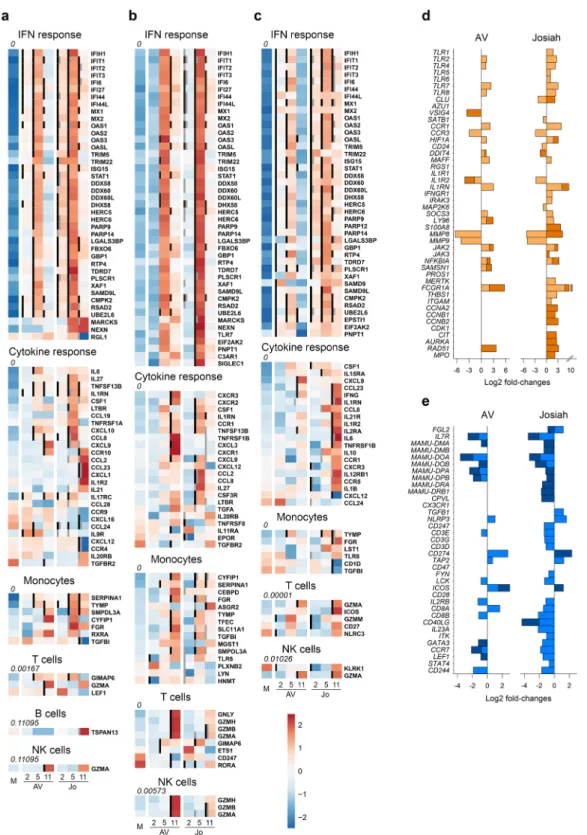
Transcriptomic changes during Lassa fever. We analyzed the transcriptomic profiles according to infection and outcome by RNA sequencing of PBMC samples (Fig. 8). We performed pairwise comparisons to identify differentially expressed (DE) genes between mock samples and AV- and Josiah-infected NHP samples (Fig. 8a and S4). Overall, LASV infection led to sig-nificant changes in transcriptomic profiles as early as 2 DPI. These changes in expression were more marked at 4 DPI and maximal at 10 DPI. Among the 100 most DE genes were inflammation/innate immunity-related genes (NLRC4, MNP1A, ZBED2, PRTN3, S100A8/9, MARCO, CCL23, CPA3, VGLL3, CHI3L1, PGLYRP1, LTF, RSAD2, CD1B, GRZMA, CXCL10, IFI6/ 27/44 L, IL27, MX1, IFIT3, ISG15, OAS1, SIGLEC1, APOBEC3A, CCL2/8, and XCR1) that were upregulated, particularly in Josiah-infected animals during the terminal stages. Genes involved in extracellular matrix and cell-adhesion were also modulated, particularly during fatal Lassa fever (NID1, TIMP3, ITGA11, TGM2, MMP8/9, OLFM4, PCDH20, and CADM3), as well as some others involved in coagulation (SERPIN, TFPI2) and apoptosis (CLU, BCL2L14). The transcriptomic profiles were also highly different between the AV and Josiah infections from 2 to 10 DPI (Fig. S5). We characterized the activation of innate immunity, the cytokine response, and monocyte, T-cell, B-cell,
Fig. 6 Analysis of T-cell responses in PBMC after LASV challenge. a The number of CD8+and CD4+T cells in the blood is presented according to the time after LASV infection.b The percentage of circulating CD8+(left) and CD4+(right) T cells expressing CD69, KI67, Annexin V and 7AAD (Ann/ 7AAD), perforin (Perfo), GrzB, CD95, or CD279 is shown according to the time after LASV infection. Results show the mean ± SEM of control (n = 3), AV (n = 4), and Josiah (n = 6) animals. Statistical analyses were performed and are presented as in Fig.1. Individual values can be found in Supplementary data 1.
and NK cell activation by analyzing the expression of genes representative of these pathways26–28 (Fig.8b). LASV infection
induced an increase in the expression of IFN-response genes, from 2 to 10 DPI, which was maximal at day 4, when the synthesis of all IFN-response genes was upregulated. Josiah infection resulted in greater induction than AV infection. We observed similar changes for genes associated with the cytokine/ chemokine response, with moderate overexpression peaking 4 DPI in AV-infected NHPs versus a dramatic increase in the synthesis of these genes 4 and 10 DPI after Josiah infection. The expression of genes related to monocyte activation was strongly upregulated after Josiah infection from 4 DPI. In contrast, the expression of T-cell activation related genes was downregulated in the same animals. B-cell-related genes were overexpressed 2 DPI and downregulated from 4 DPI in both AV- and Josiah-infected NHPs. Finally, NK cell signature was downregulated 2 and 4 DPI in Josiah-infected NHPs compared to AV and control animals. The transcription of some NK cell-related genes was induced 10 DPI in infected animals, but NK cell activation was more intense in Josiah animals compared with AV NHPs. We performed a similar analysis in the liver, spleen, and MLNs (Fig.9). Unlike the PBMC analysis, we list only the DE genes for each pathway. IFN-response genes were upregulated in all organs after LASV infec-tion from 2 DPI, but more intensely for Josiah-infected animals (Fig.9a–c), except for MLNs at day 2 after AV infection (Fig.9b). Although gene expression in the liver returned to basal levels 10 DPI in AV-infected NHPs, it remained high in the Josiah-infected animals (Fig. 9c). Certain genes related to the cytokine/
chemokine response were upregulated in spleen 4 and 10 days after LASV infection, but more particularly for Josiah (Fig.9a). In MLNs, these genes were upregulated 4 and 10 DPI in Josiah- and AV-infected NHPs, respectively. In liver, the cytokine/chemokine response was only observed on day 10 in Josiah-infected NHPs. Monocyte-related genes were more strongly activated 4 and 10 DPI in Josiah-infected than mock- or AV-infected NHPs, whereas these genes were upregulated in both AV- and Josiah-infected animals in the MLNs. Finally, certain T-cell and/or NK cell genes related to cytotoxicity were upregulated in AV-infected animals 10 DPI in the MLNs, and to a lesser extent in spleen. Upregulation of some T/NK cell genes was also observed in the liver of Josiah-infected NHPs 10 DPI. These transcriptomic changes had major consequences on the activation of cellular pathways in both PBMC (Fig. S6) and organs (Fig. S7). An activation of type I/II IFN-response and cell cycle pathways was observed in PBMC and SLO of LASV-infected animals. In liver, a robust activation of type I/II IFN-response pathways was also observed after LASV infection. An intense downregulation of several metabolic pathways was observed in liver of Josiah-infected NHP, whereas only moderated changes were induced after AV infection. The cascade of pathophysiological events and the dysregulated inflammatory responses observed during Lassa fever are reminiscent of septic shock syndrome. We thus analyzed the expression of genes known to be DE during severe sepsis29–35. The pattern of upregulated (Fig.9d) and downregulated (Fig.9e) genes during severe sepsis was similar to that of DE genes of PBMCs obtained 4 and 10 DPI from Josiah-infected NHPs,
Fig. 7 Analysis of T-cell responses in SLO. The percentage of CD8+and CD4+T cells in MLNs (L) and spleen (S) expressing KI67, Annexin V and 7AAD (Ann/7AAD), CD95, GrzB, or perforin (Perfo) is presented in control (black dots), AV-infected (blue dots), and Josiah-infected (red dots) animals. Results show the individual data and the mean ± SEM for each group (n = 3). *p < 0.05, **p < 0.01, ***p < 0.001, ***p < 0.0001, as determined by a one-way ANOVA or a Kruskal–Wallis multiple comparisons test. Significant differences are presented as in Fig.1.
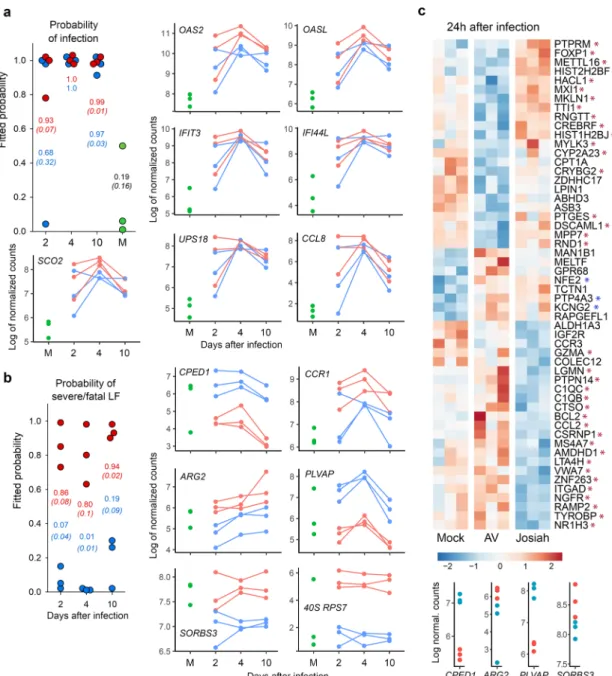
whereas this was not true during AV infection. Among the DE genes, we selected those with the most stable expression profiles during the course of the disease and those most correlated with LASV infection or outcome, i.e., the LASV strain, to identify the set of DE genes in PBMCs that could be used as markers of LASV infection or to predict the outcome of Lassa fever. We identified seven genes allowing discrimination between mock- and LASV-infected NHPs from 2 to 10 DPI with a high probability (Fig.10a)
and six genes able to predict the onset of Lassa fever as soon as 2 DPI (Fig. 10b). We performed RNA sequencing of PBMCs obtained 1 DPI to determine whether specific transcriptomic signatures are already present in the earliest samples and con-firmed this to be the case (Fig. 10c, top). Indeed, we identified
several genes for which the expression correlated with infectious status, such as NFE2, PTP4A3, KCNG2, and a substantial number of genes for which the expression is associated with Lassa fever
Fig. 8 Analysis of transcriptomic data of PBMCs. a Heatmap of the 100 most differentially expressed (DE) genes (absolute Log2 fold-change larger than 5). Gene expression was standardized using VST transformation, hence centered and scaled to make the gene expression comparable. Each column corresponds to the mean gene expression of the three animals of each group for a given timepoint.b Heatmap of gene expression of six gene sets. Significant genes are highlighted with bold labels and corresponding significant comparisons are displayed by gray (significant difference between Josiah and AV for a given day) and black vertical bars (significant difference with the mock condition). Gene expression was standardized using VST transformation, centered and scaled to make the gene expression comparable, hence averaged by condition and timepoint. An enrichment test was performed, using a one-tailed Fisher test.P values were adjusted on multiple comparisons using Benjamini–Hochberg correction and were presented under the gene set name.
outcome. Among the set of genes defined in Fig. 10b, four appeared to already be predictive 1 DPI (Fig.10c, bottom). Discussion
The cascade of pathogenic mechanisms leading to systemic shock and death during Lassa fever, as well as the immune responses
involved in the control of LASV infection, are poorly understood. Here, we describe a model of fatal and nonfatal Lassa fever in the relevant NHP model based on infection by LASV strains isolated from fatal human cases belonging to clade 4 or 59. The Josiah
isolate is the reference LASV strain and is known to induce a highly uniform lethal infection in this model16,36,37. In contrast,
Fig. 9 Analysis of transcriptomic data of organs and of genes related to sepsis in PBMCs. Heatmap of gene expression offive gene sets in spleen a MLN, b, and liver c presented as in Fig.8b, except that only the DE genes are listed. Gene expression was standardized using VST transformation, hence centered and scaled to make the gene expression comparable. Each column corresponds to the mean gene expression of the three animals of each group for a given timepoint. The Log2 fold-changes of genes found DE in this study and known to be upregulatedd or downregulated e in PBMCs during severe sepsis were calculated between PBMCs of LASV-infected and mock animals and represented by light and dark colors for 4 and 10 DPI, respectively.
we previously showed that NHPs can survive infection by the AV strain8. Consistently, Soromba-R LASV, another strain belonging
to clade 5, presented a reduced pathogenicity in macaques17. In
the current study, all AV-infected NHPs survived and experi-enced clinical signs ranging from almost asymptomatic infection to quite severe Lassa fever. The clinical and biological signs observed in NHPs are reminiscent of the disease induced in
humans, with tissue and hepatic damage, illustrated by elevated AST, ALT, and LDH levels10. Renal failure has been recently
associated with a fatal outcome, with increasing concentrations of creatinin and urea in the terminal stages of Lassa fever10. Albu-min levels decreased thoughout Lassa fever in all infected animals and may be due to anorexia but may also have resulted from capillary leakage, abnormal fluid accumulation, liver failure, or
Fig. 10 Identification of genes that can be used as early markers of infection and severity. a Individual probabilities of infection status estimated by a random forest: each dot represents an estimation of the probability for an animal to be infected or not, at 2, 4, and 10 DPI and at 28 DPI for mock animals: the higher the probability, the greater the risk of an animal being infected. Josiah-infected animals are represented by red dots, AV-infected animals by blue dots, and mock-infected animals by green dots. The mean probability ± SEM is represented in red for Josiah, blue for AV, and black for mock animals. Probabilities were computed by applying the random forest method to the gene expression ofOAS2, OASL, IFIT3, IFI44L-201, SCO2, USP18, and CCL8. The kinetics of Log2 normalized counts are also shown for each gene.b Individual probabilities to have a severe/fatal LASV infection were estimated and are represented as ina, except that mock animals were not included in this analysis. Probabilities were computed by applying the random forest method to the gene expression ofCPED1, CCR1, ARG2, PLVAP, SORBS3, and 40 S RPS7. c Heatmaps of DE genes in PBMCs at 1 DPI. The genes that were statistically associated with infection status are indicated by a blue asterisk, whereas those associated with disease severity/lethal outcome are indicated by a red asterisk. Gene expression was standardized using VST transformation, hence centered and scaled to make the gene expression comparable. Each column displays gene expression of a given animal. The expression ofCPED1, ARG2, PLVAP, and SORBS3 1 DPI in PBMCs of Josiah- and AV-infected NHPs is represented at the bottom by red and blue dots, respectively. The DE of the other genes selected ina and b was not significant at 1 DPI and are therefore not represented. Transcriptomic changes measured 1 DPI could not be compared with other samples as the sequencing of these mRNA was not performed together with the others.
renal loss38. An electrolytic imbalance, illustrated by a drop in Na
+ and Cl−concentrations, was also associated with a fatal
out-come. In contrast, the clinical scores remained low during infection with the AV strain and only limited alterations of bio-logical parameters were recorded, suggesting that LASV was rapidly controlled. Thefirst cycles of LASV replication appear to occur locally, close to the site of infection. Indeed, infectious viral particles were present in the dermis two days after SC inoculation, and the amount detected suggests active replication instead of residual inoculum. Differences in viral replication and dis-semination were already evident as soon as 2 DPI, with higher viral loads in Josiah-infected NHP skin and detection of low amounts of LASV RNA in the spleen and thymus. Whether the higher replication of Josiah compared with AV was owing to increased virulence or to different host responses remains unclear. These results demonstrate, for the first time, that local replication of LASV occurs before infection of SLO and confirm that these latter represent thefirst organs to be targeted by LASV. Primary lymphoid organs such as thymus and BM can also be early infected by LASV. Although viremia was detected from 3 DPI in all infected animals, striking differences in viral replication and dissemination were evident very early during the course of infection between the Josiah and AV strains. Indeed, viremia was higher in Josiah- than AV-infected NHPs. Moreover, we observed greater spreading as soon as 5 DPI, with higher viral loads in the organs, with infectious viral particles detected only in lymphoid organs in AV-infected animals, whereas other organs were affected in Josiah-infected NHPs. We observed a similar pattern 11 DPI, with very high LASV titers detected in all organs in Josiah-infected NHPs. Moreover, we previously observed elevated LASV titers in oral and nasal swabs 9 DPI, confirming that the respiratory tract is a site of intense viral replication37. In contrast,
infectious LASV was found to be mainly restricted to the lym-phoid organs in all AV-infected animals, with only significantly lower amounts found in a few other organs for some. These observations were histologically confirmed, with Josiah LASV antigens present in all organs as soon as 5 DPI and massively by 11 DPI, whereas AV antigens were found only in lymphoid organs 5 DPI. The adrenals, liver, lungs, and kidneys were the organs of intense Josiah LASV replication during the terminal stages, consistent with the multiorgan failure associated with hepatic and renal dysfunction and acute respiratory distress observed for fatal Lassa fever. These results show that LASV replication is rapidly controlled and its dissemination restricted to lymphoid organs in nonfatal LF. In contrast, the lack of control leads to relentless viral replication and systemic spreading in severe/fatal LASV. The tropism of LASV for BM could play a role in the transient lymphopenia observed in infected animals, but further investigations are needed to determine if this phenom-enon results from hematopoiesis defects or from peripheral deletion39,40.
We explored the immune responses induced during Lassa fever to investigate the observed difference in viral control. Generation of memory and plasma B cells was observed in both blood and SLOs in infected NHPs, simultaneously with LASV-specific IgM and IgG, with earlier and more robust responses after Josiah infection. Genes related to the B-cell response were upregulated as soon as 2 DPI in infected animals, but the profiles were different between AV- and Josiah-infected NHPs. The expression of these genes was downregulated at 4 and 10 DPI. Together, with the lack of detection of neutralizing antibodies, these results confirm that no significant difference in the humoral responses was observed according to Lassa fever outcome and that these responses are not sufficient to control LASV infection, as previously reported8. In AV-infected animals, a robust CD4+
and CD8+ T-cell response, involving induction and proliferation
of cytotoxic T cells, was induced in blood and SLOs by the second week after infection. The transient release of sCD137, IFNγ, IL-5, perforin, and GrzB in the plasma of AV-infected animals is also indicative of T-cell activation41,42, as was the activation of
path-ways related to antigen processing and presentation in the SLOs of AV-infected NHPs. Differentiation of memory CD4+ and CD8+T cells also occurred in these animals. Overall, these results are consistent with an important role of CD4+and CD8+T cells in the control of LASV infection, as previously suggested8,43.
Importantly, both CD4+ and CD8+ T cells with a cytotoxic phenotype were strongly induced ~1 week after infection, sug-gesting that both types of T cells play a role in the lysis of infected cells44. The elevated amount of GrzB released is consistent with
cytotoxic CD4+ T-cell activation, as they appear to be more prone to secrete GrzB than CD8+ T cells42. However, the quantification of cytokines produced by T cells after stimulation with LASV antigen-derived peptides would be necessary to ana-lyze specific T-cell responses. Proliferating and cytotoxic CD4+
and CD8+T cells were present in the spleen of Josiah-infected NHPs 11 DPI, but not in the blood or MLNs. These discrepancies could result from the functional differences between the two SLOs. Indeed, blood-borne antigens directly enter the spleen, whereas APCs bring antigens to the LNs through the lymphatics and the elevated viremia present during Josiah infection may explain the activation of splenic T cells45. The release of IFNγ,
sCD137, and IL-2 suggests T-cell activation in these animals, although IL-2 could also come from DCs activated by pathogen-associated molecular patterns (PAMPs) such as viral RNA46.
Changes in memory T-cell subpopulations were also observed in the blood and SLOs of Josiah-infected animals, but their overall T-cell responses appear to be defective. Indeed, high proportions of apoptotic and CD279+CD4+and CD8+T cells and CD95+ CD8+ T cells were detected in the blood. These observations suggest that massive T-cell death and exhaustion were induced during Josiah infection47. Consistently, the induction of CD279+
T cells has been associated with severe Ebola virus disease48. The
transcriptomic results in PBMCs and SLOs are also consistent with adaptive T-cell responses of lower intensity in the Josiah-infected NHPs. Finally, pathways linked to mitosis and cell cycle were activated in SLOs of infected NHPs, but more intensively after AV infection, probably reflecting a more robust adaptive immunity in these animals.
NK cells are probably involved in the innate response against LASV, as suggested by their proliferation and acquisition of cytotoxic markers as well as their transcriptomic signatures in blood and SLOs of infected animals. The enrichment in CD16+ CD56−, NKp80+, GrzB+, and CD107a+cells in MLN and spleen for the latter is consistent with the induction of cytotoxic NK cells in SLOs49,50. The NKp80- NK cells that circulated in
LASV-infected NHPs could result from relocalization of NKp80+cells into tissues or to downregulation of NKp80 expression after exposure to monokines51. The downregulation of CXCR3
expression in NK cells in SLOs is probably owing to ligand-induced internalization. Indeed, CXCL9, CXCL10, and CXCL11 are the ligand for CXCR3 and attract NK cells into inflamed tissues52. The synthesis of CXCL9 and CXCL11 mRNA observed
in blood and SLO of LASV-infected animals is consistent with this hypothesis. Finally, NK cells could be the source of the IFNγ released in plasma in infected animals. Although further inves-tigations are needed to understand the role played by NK cells, a similar response observed in both Josiah- and AV-infected ani-mals argues against a primary role of NK cells in Lassa fever outcome.
A balanced and self-limiting inflammatory response was induced during AV LASV infection. IFN-response gene synthesis was only induced 4 to 5 DPI in the PBMCs and organs while
cytokine/chemokine and monocyte-associated genes were only moderately overexpressed. These observations were mirrored by the moderate and transient release of inflammatory/anti-inflam-matory cytokines and chemokines into the plasma. This balanced inflammatory response may have played an important role in the induction of efficient T-cell immunity, as these cytokines are known to serve as costimulatory signals for T-cell activation53. In
sharp contrast to the response in AV-infected NHPs, an over-whelming, dysregulated, and potentially deleterious inflammatory response appeared to be induced during Josiah infection. The expression of IFN-response genes was upregulated as soon as 2 DPI in the PBMCs and organs up to death, and the levels were very high from 4 to 5 DPI. This transcriptomic response can be, at least within PBMCs, attributed to monocytes, given the intense overexpression of monocyte-related genes observed at the same time. Consistently, a large proportion of circulating monocytes was activated in the blood of Josiah-infected animals during the disease, whereas this was more balanced after AV infection. Similar results in the transcriptomic response of PBMC have been previously reported in a fatal model of Lassa fever in macaques after aerosol infection, with early induction of IFN-responsive genes and TLR signaling pathways54, and also in the Lassa
fever-like model of intravenous LCMV infection of macaques20. Genes
related to cytokine/chemokine responses were robustly expressed during Josiah infection in both PBMCs and organs. In the liver, these transcriptomic changes were maximal during the terminal stages, which is consistent with the liver alterations observed at the same time. The liver metabolism was highly suppressed during Josiah infection, probably contributing to liver failure and pathogenesis. The metabolic pathways were only moderately affected after AV infection, confirming that liver function was preserved during nonfatal Lassa fever. Very high concentrations of inflammatory/anti-inflammatory cytokines and chemokines were also detected in the circulation, with levels steadily increasing until death. These mediators may be released by activated monocyte/macrophages, which would be consistent with the activated phenotype of circulating monocytes observed in Josiah-infected NHPs as well as the gene signature of activated macrophages in their SLOs. This unbalanced and excessive inflammatory response may be involved in the defective T-cell activation observed in the SLOs. Indeed, the homing and motility of T cells within the SLOs and their contact with APCs are dic-tated by the complex and well-regulated expression of homeo-static chemokines by stromal cells of the SLOs45,55–57. Dysregulated chemokine synthesis may have altered the traffic of naive T cells within the SLOs, preventing the induction of effective immunity. It has been previously shown that arenavirus tropism, including that of LASV, for fibroblastic reticular cells may have a deleterious effect on the architecture of the SLOs and consequently on the induction of the immune response58–60. Consistent with this finding, a loss in lymphoid follicle archi-tecture was evident in LASV-infected NHPs. The large number of CD10− granulocytes, a phenotype characteristic of immature myeloid cells, that circulated in the final days before death in Josiah-infected NHPs may have also been involved in the defec-tive T-cell response61. Indeed, these cells circulate during severe
sepsis and cancer and are related to myeloid-derived suppressor cells. They may exhibit T-cell suppressive properties and their presence is associated with a poor prognosis in sepsis. Further-more, infection of DCs has been observed within the SLOs of Josiah-infected NHPs 7 DPI16. As LASV-infected DCs fail to
induce T-cell responses62,63, this tropism could also have a role in
the lack of T-cell activation in Josiah-infected NHPs. Finally, the large proportion of apoptotic T cells within the PBMCs and SLOs probably also contributed to immunosuppression. However, further studies would be needed to decipher the mechanisms
involved in the defective T-cell immunity following Josiah LASV infection. Overall, the observations made during Josiah infection are reminiscent of septic shock syndrome. Indeed, the cytokine/ chemokine storm, combining inflammatory and anti-inflammatory compounds, detected in the plasma at the late stage is similar to that associated with severe sepsis and septic shock64. Very high levels of IL-10 were released in the circulation
of Josiah-infected animals. This mediator is probably not pro-duced by PBMC, with regards to their low IL-10 mRNA levels, but rather in tissues/organs. Consistently, the synthesis of IL-10 mRNA was significantly increased as soon as 4 DPI in the liver of Josiah-infected monkeys. The massive production of mRNAs coding for these mediators was also detected in PBMCs and organs from 4 to 5 DPI until death and pathways related to TLR-and RIG-like receptors (RLR), Janus kinases, mitogen-activated protein kinases, signal transducers and activators of transcription (STAT), and NF-κB were activated as observed during severe sepsis65. Moreover, the most altered pathways in PBMC, SLOs, and liver were those related to type I and type I IFN responses, with dramatic activation in infected animals, and more particu-larly in Josiah-infected NHPs. These observations are consistent with the soluble mediators detected in plasma and with a septic-like syndrome. Most clinical and biological signs observed during Josiah infection also reflect those of severe sepsis: lymphopenia and T-cell apoptosis, thrombocytopenia, liver failure with hepatic necrosis, renal failure, vascular permeability, edema, and acute respiratory distress syndrome (ARDS)65–69. The dramatic thick-ening of the alveolar walls and interstitial pneumonitis observed in the lungs of Josiah-infected animals are consistent with ARDS. The dramatic Josiah LASV replication in the lungs could have favored an exacerbated local inflammatory response, contributing to the pathology observed in these tissues. Furthermore, large sets of genes related to the inflammatory response and T-cell immunity, known to be up and downregulated, respectively, in correlation with the severity of sepsis, were similarly modulated in Josiah-infected animals29–35, further suggesting that highly
similar pathophysiological mechanisms are recruited during sepsis and Lassa fever.
The outcome of Lassa fever appears to be determined very early. Indeed, as soon as 1 DPI, we were able to identify DE genes in PBMCs associated with LASV infection and Lassa fever out-come. At a time when LASV replication is still restricted to the local inoculation site, a systemic PBMC response can already be observed, as previously reported19. Moreover, upregulation of IFN-response-related genes was also evident 2 DPI in the spleen and liver of all LASV-infected NHPs relative to control animals and in the spleen, LN, and liver of Josiah-infected animals compared to the other NHPs. This observation confirms that a systemic response was induced very early after LASV infection, at a time when the infection was clinically silent. From 2 to 10 DPI, certain IFN-response genes were upregulated in LASV-infected NHPs relative to control animals and could be used as high probability markers of infection, as proposed by other authors19,70. Similarly, another set of genes was DE between
AV-and Josiah-infected NHPs throughout the course of infection, allowing prediction of the outcome of Lassa fever from the early incubation period to terminal stages, as proposed for other acute viral infections such as dengue71. The analysis of the expression
of these genes by RT-PCR could be used for diagnostic purposes, as previously proposed for other genes54, assuming that they will likely not be specific for Lassa fever but rather represent an acute viral infection signature. Nevertheless, during an outbreak, such an approach would allow determining whether a subject has been infected very early after a high-risk contact and provide an idea of the severity of the coming disease. Whether the same sets of genes are modulated during human Lassa fever is yet to be determined,
but similar early transcriptomic profiles are probably induced in the PBMCs of patients. The relative specificity of these gene sets for Lassa fever could also be challenged against other infectious diseases. The prognostic of Lassa fever severity could be useful in epidemic setting when intensive care can be provided to a limited number of patients. Our results suggest that the orientation toward an efficient or defective immune response after LASV infection is decided in thefirst hours after infection. They allow us to propose the following hypothesis to explain the pathophy-siogenesis of Lassa fever. Thefirst cycles of viral replication occur at the site of inoculation. Then LASV reaches the SLOs, which probably serve as a viral reservoir before systemic infection. In nonfatal Lassa fever, a balanced inflammatory response is induced early after infection and an efficient T-cell response is generated. Viral replication is restricted to the SLOs and no systemic dis-semination of LASV occurs, probably owing to an efficient innate and/or T-cell response. This lack of systemic spreading avoids the appearance of severe clinical signs and only asthenia, anorexia, and fever are observed. From 12 DPI, viremia decreases con-comitantly with the appearance of LASV-specific IgG and a robust CD4+and CD8+T-cell response. This balanced humoral and cellular response probably allows for complete control of LASV and recovery. In fatal Lassa fever, LASV is not restricted to the SLOs and systemic viral spreading occurs, with intense viral replication in virtually all organs and tissues, despite a more intense induction of the IFN-response in the early stages, possibly owing to higher viral replication. This massive replication gen-erates substantial amounts of PAMPs, as double-stranded RNA intermediates or single-stranded RNA, which intensively activate cells through TLRs and RLRs, inducing a cytokine/chemokine storm, a defective T-cell response, and a pathological cascade similar to that induced during septic shock syndrome. Multiorgan failure then occurs, followed by death in a hypovolemic, hypoxic, and hypotensive context. Although the early events that dictate the evolution towards LASV control or severe HF and death remain unclear, this study brings new insights into the patho-genesis of Lassa fever and identifies transcriptomic signatures that could serve as an early marker of LASV infection and of Lassa fever prognosis.
Methods
Cell cultures. Vero E6 cells were grown in Glutamax Dulbecco Modified Eagle’s Medium (DMEM, Life Technologies) supplemented with 5% fetal bovine serum (FBS) and 0.5% penicillin–streptomycin (P/S).
Viruses. LASV-AV (GenBank FR832711.1 and FR832710.1) and LASV-Josiah (GenBank HQ688674.1 and HQ688672.1) strains were kindly provided by Dr Stephan Becker (Philipps-Universität Marburg, Marburg, Germany). AV and Josiah strains were passaged four andfive times before generating a stock, respectively. Stocks were produced on Vero E6 cells at a multiplicity of infection (MOI) of 0.01 in DMEM supplemented with 2% FBS and 0.5% P/S. Culture supernatants were harvested, titrated on Vero E6 cells, checked for the absence of Mycoplasma spp., aliquoted, and frozen at−80 °C.
Infection of animals. All infectious work with LASV and sample inactivation was performed in a maximum containment laboratory (Laboratoire P4 Jean Mérieux, Lyon, France). All cynomolgus monkeys (Macaca fascicularis) (12 females, 16 males, age range 2–3 years, weight range 2–5 kg) were purchased from SILABE (Simian Laboratory Europe, Niederhausbergen, France). One group of four and one group of six monkeys were infected with a subcutaneous injection (at the back of the thigh) of 0.5 mL PBS containing 103FFU of LASV-AV or LASV-Josiah
strain, respectively. Another control group of three monkeys was injected sub-cutaneously with 0.5 mL PBS. Animals were followed for clinical signs of the disease and euthanized according to a scoring based on body temperature, body weight, feeding, hydration, behavior, and clinical signs. The experimentation endpoint was placed at 28 days post-challenge and all animals that had survived to this point were killed according to validated experimental procedures. Blood draws were performed daily from the day of infection to the fourth DPI, every 2 days from the fourth day to the 12th DPI, and every 3–4 days between the 12th day and the end of the experiment. BM was harvested on the second, fourth, seventh, and
tenth day, as well as during necropsies. In parallel with the longitudinal follow-up of animals, groups of three monkeys infected with 103FFU of LASV-AV were
sequentially killed 2, 5, and 11 DPI. Other groups of three monkeys were also infected with 103FFU of LASV-Josiah and sequentially killed 2 and 5 DPI. Blood
and BM samples were harvested using the same protocol as described above. Full necropsies were performed on each animal and organs were harvested for virologic and pathological analyses. All procedures were approved by the Comité Régional d’Ethique pour l’Expérimentation Animale Rhône Alpes (file number
2015062410456662, CECAPP, UMS3444/US8, Lyon, France).
Hematology and biochemistry analyses. Hematology was completed on a MS9 (Melet Schloesing Laboratories, Osny, France) and the following parameters were evaluated in blood samples harvested in ethylenediamine tetraacetic acid (EDTA) tubes: red blood cell count, hemoglobin concentration, hematocrit, mean corpus-cular volume, mean corpuscorpus-cular hemoglobin, mean corpuscorpus-cular hemoglobin concentration, platelets count, neutrophil count, lymphocyte count, monocyte count, eosinophil count, and basophil count. Part of the biochemistry analyses was completed on a Horiba Pentra C200 (Horiba, Kyoto, Japan) and the following parameters were evaluated in blood samples harvested in heparin tubes: ALT, AST, creatinine kinase, CRP, total bilirubin, direct bilirubin, gamma glutamyltransferase, LDH, albumin, total protein, iron, uric acid, and calcium. The other part of the biochemistry analyses was completed on an i-STAT (Abbott, Princeton, USA), with an evaluation of the following parameters: sodium, potassium, chloride, total carbon dioxide, glucose, anionic gap, creatinine, and urea.
LASV RNA detection. Viral RNA was extracted from plasma, cerebrospinalfluid, and urine using QIAamp Viral RNA Minikits (Qiagen, Hilden, Germany), according to the manufacturer’s instructions. Organs were treated with RNA later (Qiagen) prior to freezing. After weighing and grinding the various tissues, total RNA was extracted using ViralRNeasy Minikits (Qiagen), according to the man-ufacturer’s instructions. Quantification of viral RNA was performed using the EuroBioGreen Lo-ROX qPCR mix (Eurobio, Les Ulis, France), with primers spe-cific for LASV NP sequence: 5′- CTTTCACCAGGGGTGTCT-3′ and 5′-GTCACC TCAGACAATGGATGG-3′ for LASV-Josiah and 5′-CTCTCACCCGGAGTAT CT-3′ and 5′-CCTCAATCAATGGATGGC-3′ for LASV-AV. RT-PCR was per-formed on a Light Cycler 480 II (Roche, Boulogne-Billancourt, France). LASV titration. Vero E6 cells were infected with sequential dilutions of bodyfluids and resuspended tissue and incubated at 37 °C in 5% CO2for 7 days with
car-boxymethylcellulose (CMC) (1.6%) (BDH Laboratory Supplies, Poole, UK) in DMEM supplemented with 2% FBS. Infectious foci were detected by incubation with monoclonal antibodies (mAbs) directed against LASV antigens (mAbs L52-54-6A, L53-237-5, and YQB06-AE05, generously provided by P. Jahrling, USAMRIID, Fort Detrick, MD), followed by PA-conjugated goat polyclonal anti-mouse IgG (Sigma-Aldrich).
Quantification of cytokines in plasma. Thirty-seven analytes were measured in plasma samples using the following multiplex magnetic bead assays: NHP cyto-kine/Chemokine Magnetic Bead Panels® I (GM-CSF, TGFα, GCSF, IFNγ, 2, IL-10, IL-15, sCD40L, IL-17, IL-1ra, IL-13, IL-1β, IL-4, IL-5, IL-6, IL-8, MIP-1α, MCP-1, TNFα, MIP-1β, IL12/23p40, VEGF, and 18) and II (FGF-2, Eotaxin, IL-16, fractalkine, sCD137, granzyme A and B, IL-1α, 23, IP-10, sFasL, TNF-β, IL-28A, and perforin) (Merck). Plates were prepared according to the manufacturers’ recommendations and analyzed on a Magpix® instrument (Merck). IFN-α2 levels were detected in the plasma of animals using matched pair antibodies and standard protein (Life technologies), according to the manufacturer’s instructions. For the detection of LASV-specific IgG, polysorp plates (Nunc) were coated overnight with lysates of LASV− or mock-infected Vero E6 cells as positive and negative antigens, respectively. Plasma samples were then incubated for 2 h on both antigens at dilutions of 1:250, 1:1000, 1:4000, and 1:16,000. Plates were further incubated with polyclonal peroxidase-conjugated antibodies directed against NHP IgGγ-chain (Kirkegaard and Perry Laboratories). Tetramethylbenzidine (TMB) (Eurobio) and H3PO4solutions were used for detection and the optical densities (OD) measured.
For the detection of LASV-specific IgM antibody titers, Maxisorp plates (Nunc) were coated overnight with monkey anti-μ antibodies at a concentration of 5 µg/ mL and then saturated for 2 h with a 2.5% PBS-SAB solution before adding diluted plasma samples at dilutions of 1:100, 1:400, and 1:1600. Negative and positive LASV antigens were then added to the plates for 1 h before incubation with a mouse anti-LASV antibody cocktail. Plates were then incubated with anti-mouse peroxidase-conjugated antibodies before revelation with TMB and H3PO4and
measuring the OD.
Neutralization assays. For plaque reduction neutralization assays, plasma samples were diluted and mixed with 150 FFU of LASV strain Josiah. After 1 h, the mix-tures were added to Vero E6 cells and incubated for 1 h before the addition of CMC diluted in DMEM. After seven days, the number of foci was calculated by focus-forming immunodetection using anti-LASV antibodies.