The Outlook for Agriculture and
Rural Development in the Americas:
A Perspective on Latin America and the Caribbean
2019-2020
Annexes
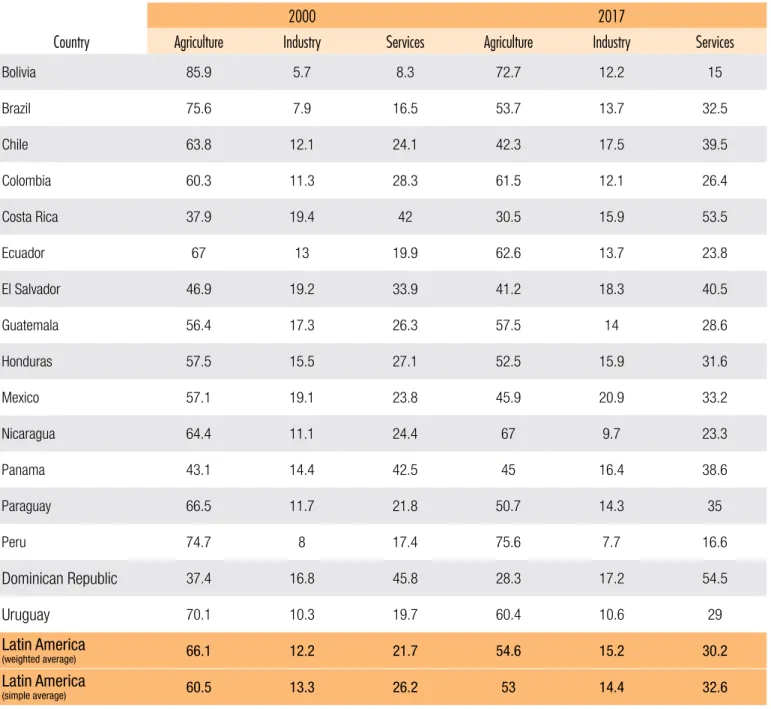
Table 5.1: Rural area employment, by sector (%).
2000 2017
Country Agriculture Industry Services Agriculture Industry Services
Bolivia 85.9 5.7 8.3 72.7 12.2 15 Brazil 75.6 7.9 16.5 53.7 13.7 32.5 Chile 63.8 12.1 24.1 42.3 17.5 39.5 Colombia 60.3 11.3 28.3 61.5 12.1 26.4 Costa Rica 37.9 19.4 42 30.5 15.9 53.5 Ecuador 67 13 19.9 62.6 13.7 23.8 El Salvador 46.9 19.2 33.9 41.2 18.3 40.5 Guatemala 56.4 17.3 26.3 57.5 14 28.6 Honduras 57.5 15.5 27.1 52.5 15.9 31.6 Mexico 57.1 19.1 23.8 45.9 20.9 33.2 Nicaragua 64.4 11.1 24.4 67 9.7 23.3 Panama 43.1 14.4 42.5 45 16.4 38.6 Paraguay 66.5 11.7 21.8 50.7 14.3 35 Peru 74.7 8 17.4 75.6 7.7 16.6 Dominican Republic 37.4 16.8 45.8 28.3 17.2 54.5 Uruguay 70.1 10.3 19.7 60.4 10.6 29 Latin America (weighted average) 66.1 12.2 21.7 54.6 15.2 30.2 Latin America (simple average) 60.5 13.3 26.2 53 14.4 32.6
Source: Prepared by author, based on CEPALSTAT data.
5.1.
Employment and poverty indexes in LAC
5.2.
Urban-rural socioeconomic indicators
(see Section 3.1)
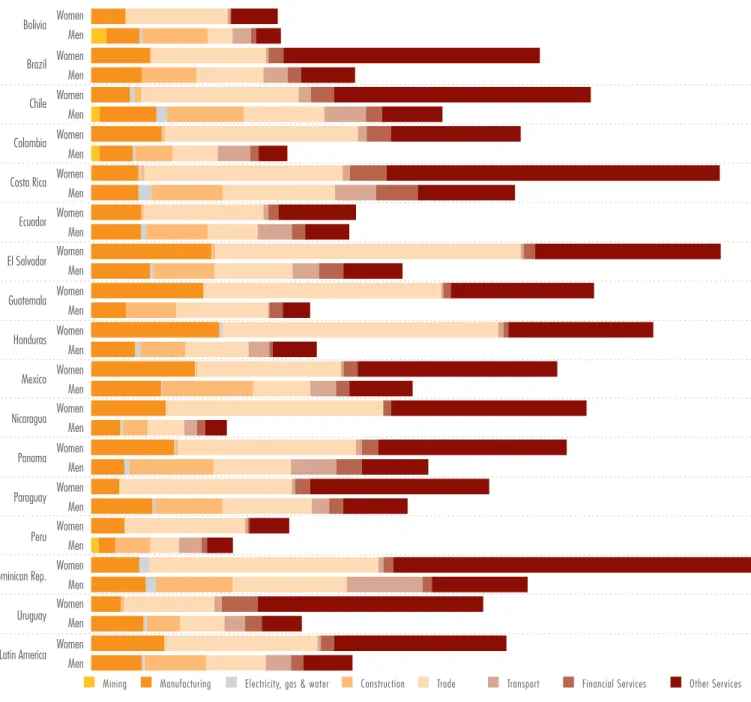
Figure 5.1: Latin America, 2017, 16 countries:
Structure of the rural population employed in non-agricultural activities, by sex
Mining Manufacturing Electricity, gas & water Construction Trade Transport Financial Services Other Services
Bolivia Brazil Chile Colombia Costa Rica Ecuador El Salvador Guatemala Honduras Mexico Nicaragua Panama Paraguay Peru Dominican Rep. Uruguay Latin America Women Men Women Men Women Men Women Men Women Men Women Men Women Men Women Men Women Men Women Men Women Men Women Men Women Men Women Men Women Men Women Men Women Men
Source: Prepared by the author, using CEPALSTAT data, 8 August 2019.
Note: The information used for Guatemala and Nicaragua was from 2014. The information used for Mexico and Honduras was from 2016. A weighted average was used for Latin America. Figures below 1 percent were removed from the graph for easier visualization.
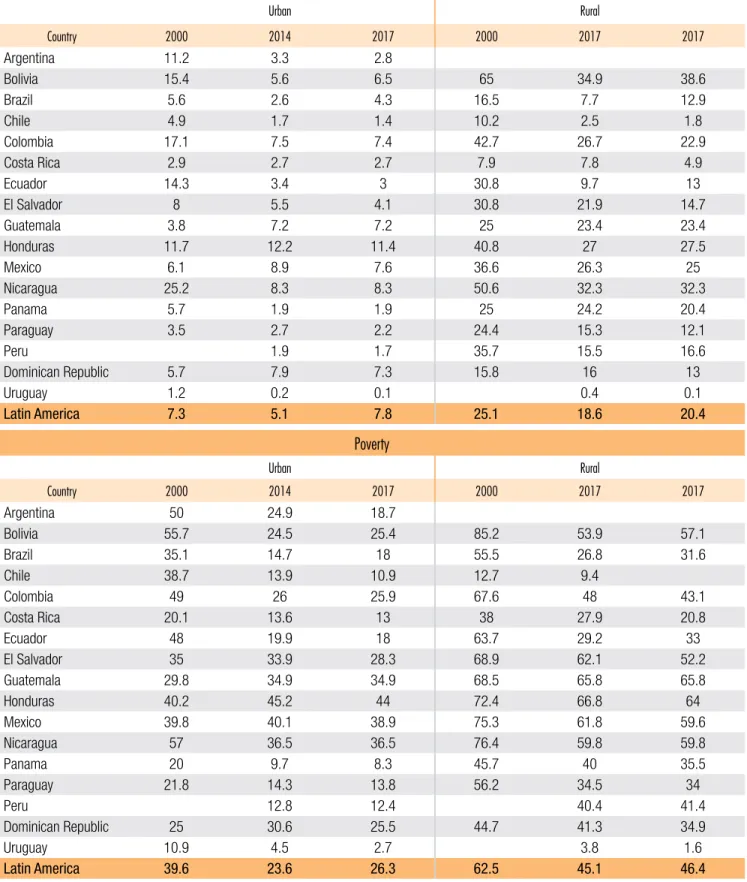
Table 5.2: Poverty and extreme poverty rates in LAC (%)
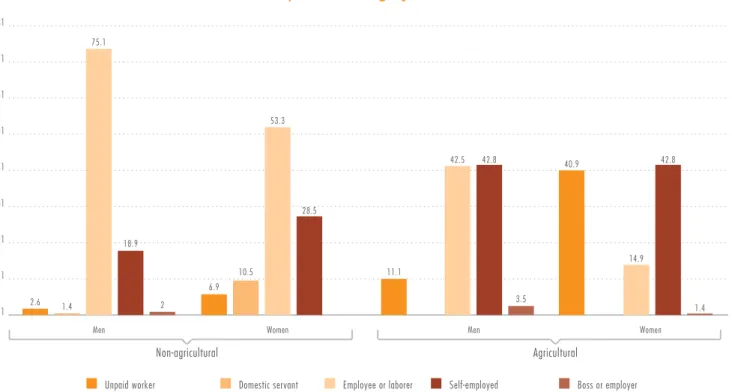
Extreme Poverty Urban Rural Country 2000 2014 2017 2000 2017 2017 Argentina 11.2 3.3 2.8 Bolivia 15.4 5.6 6.5 65 34.9 38.6 Brazil 5.6 2.6 4.3 16.5 7.7 12.9 Chile 4.9 1.7 1.4 10.2 2.5 1.8 Colombia 17.1 7.5 7.4 42.7 26.7 22.9 Costa Rica 2.9 2.7 2.7 7.9 7.8 4.9 Ecuador 14.3 3.4 3 30.8 9.7 13 El Salvador 8 5.5 4.1 30.8 21.9 14.7 Guatemala 3.8 7.2 7.2 25 23.4 23.4 Honduras 11.7 12.2 11.4 40.8 27 27.5 Mexico 6.1 8.9 7.6 36.6 26.3 25 Nicaragua 25.2 8.3 8.3 50.6 32.3 32.3 Panama 5.7 1.9 1.9 25 24.2 20.4 Paraguay 3.5 2.7 2.2 24.4 15.3 12.1 Peru 1.9 1.7 35.7 15.5 16.6 Dominican Republic 5.7 7.9 7.3 15.8 16 13 Uruguay 1.2 0.2 0.1 0.4 0.1 Latin America 7.3 5.1 7.8 25.1 18.6 20.4 Poverty Urban Rural Country 2000 2014 2017 2000 2017 2017 Argentina 50 24.9 18.7 Bolivia 55.7 24.5 25.4 85.2 53.9 57.1 Brazil 35.1 14.7 18 55.5 26.8 31.6 Chile 38.7 13.9 10.9 12.7 9.4 Colombia 49 26 25.9 67.6 48 43.1 Costa Rica 20.1 13.6 13 38 27.9 20.8 Ecuador 48 19.9 18 63.7 29.2 33 El Salvador 35 33.9 28.3 68.9 62.1 52.2 Guatemala 29.8 34.9 34.9 68.5 65.8 65.8 Honduras 40.2 45.2 44 72.4 66.8 64 Mexico 39.8 40.1 38.9 75.3 61.8 59.6 Nicaragua 57 36.5 36.5 76.4 59.8 59.8 Panama 20 9.7 8.3 45.7 40 35.5 Paraguay 21.8 14.3 13.8 56.2 34.5 34 Peru 12.8 12.4 40.4 41.4 Dominican Republic 25 30.6 25.5 44.7 41.3 34.9 Uruguay 10.9 4.5 2.7 3.8 1.6 Latin America 39.6 23.6 26.3 62.5 45.1 46.4Figure 5.2: Latin America, 2010, 12 countries: Labor activity of the employed rural population, by sector,
occupational category and sex
81 71 61 51 41 31 21 11 1
Unpaid worker Domestic servant Employee or laborer Self-employed Boss or employer
Men 2.6 1.4 75.1 18.9 2 6.9 10.5 53.3 28.5 11.1 42.5 42.8 3.5 40.9 14.9 42.8 1.4
Women Men Women
Non-agricultural Agricultural
Source: Using special tabulations from the FAO/ RLC Office, based on Household Surveys in the respective countries in 2010, with the exception of Brazil and Chile, which were surveyed in 2009.
Figure 5.3: Child labor, percentage of children 10 - 14 years of age, 2015
30.0 35.0 20.0 15.0 10.0 5.0 0.0 Rural Urban
Brazil Chile Colombia Costa Rica Ecuador El Salvador Guatemala Honduras Mexico Nicaragua Panama Paraguay Peru Dominican Rep. Uruguay
Figure 5.4: Infant mortality rate (every 1000 births), 2000-2005
Bolivia Brazil Chile Colombia Costa Rica Ecuador Guatemala Honduras Mexico Nicaragua Panama Paraguay Venezuela
90 80 70 60 50 40 30 20 10 0
Rural indigenous Urbana non-indigenous
Source: Prepared using data from Jimenez et al. 2007. La reducción de la mortalidad infantil en América Latina y el Caribe: Avance dispar que requiere respuestas variadas. Desafíos 6:4-9, December. CEPAL.
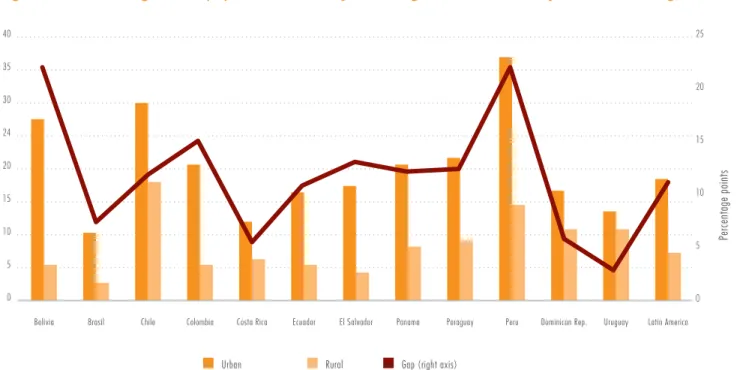
Figure 5.5: Percentage of the population 15 - 24 years of age with 13 or more years of schooling, 2017
40 35 30 24 20 15 10 5 0 25 20 15 10 5 0 Percentage points
Bolivia Brasil Chile Colombia Costa Rica Ecuador El Salvador Panama Paraguay Peru Dominican Rep. Uruguay Latin America
Urban Rural Gap (right axis)
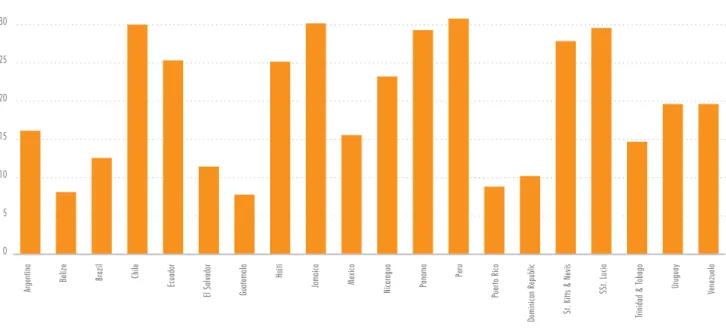
Figure 5.6: Percentage of rural women that are owners of agricultural land, 1998-2012
35 30 25 20 15 10 5 0 Argentina Belize Brazil Chile Ecuador El Salvador Guatemala HaitiJamaica Mexico Nicaragua Panama Per
u
Puer
to Rico
Dominican Republic St. Kitts & Nevis
SSt. Lucia Trinidad & T obago Ur uguay Venezuela
Source: Based on FAO data. 2007. Atlas de las mujeres rurales de América Latina y el Caribe: Al tiempo de la vida y los hechos.
Figure 5.7: Non-conventional renewable energy production in Latin America and the Caribbean (GWh),
2008-2016
2009
2008 2010 2011 2012 2013 2014 2015 2016
Wind Solar Bioenergy
140 000 120 000 100 000 80 000 60 000 40 000 20 000 0
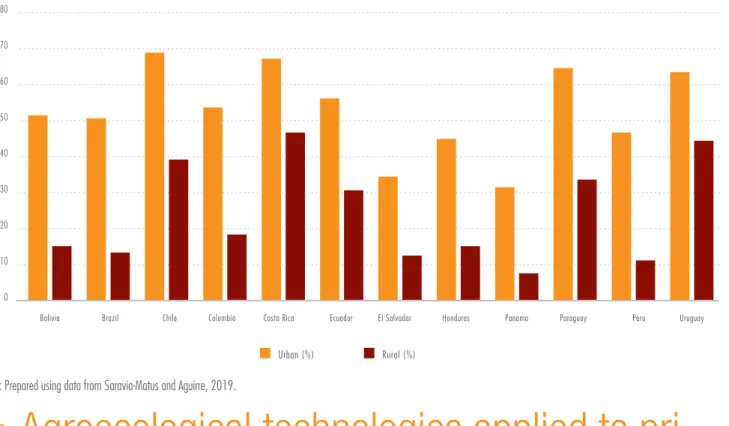
Figure 5.8: Percentage internet use, 2015
80 70 60 50 40 30 20 10 0 Urban (%) Rural (%)Bolivia Brazil Chile Colombia Costa Rica Ecuador El Salvador Honduras Panama Paraguay Peru Uruguay
Source: Prepared using data from Saravia-Matus and Aguirre, 2019.
5.3.
Agroecological technologies applied to
pri-mary production (see section 3.2.1)
1. COLLABORATIVE WORK: Agroecology relies on collective processes. Peer to peer learning, horizontal extension (producer / producer), associative projects.
2. TRADITIONAL KNOWLEDGE: Taking advantage of the valuable cognitive experience of farmers, which must be mobilized and combined with new knowledge.
3. SHORT CIRCUITS: The sale of products at local fairs and other short circuits allows families to generate income, some of which can be reinvested to make new investments. These short circuits also generate new social bonds and transform food systems (see section 3.2.7 on p.62).
4. ASSOCIATED CROPS: Crop rotation favors the increase of carbon and nitrogen in the soil, as well as weed control and erosion control.
5. CLIMATE ADAPTATION: The incorporation of organic matter contributes to the storage of greenhouse gases in the soil, improving its ability to retain water.
6. SOIL BIODIVERSITY: Living soil organisms improve soil structure and water retention, facilitate rooting and erosion control. They also play an active role in decomposition, organic matter and in the generation of nutrients.
7. BIODIVERSITY: The protection of wildlife and natural vegetation plays a critical role in maintaining environmental balances.
8. NITROGEN FIXING: This element plays a central role in plant nutrition and can be produced by certain types of plants (especially legumes), from the fixation of nitrogen gas.
9.AGRICULTURE / LIVESTOCK INTEGRATION: The use of waste from one or another subsystem generates synergies and increases the value of a resource that is often not used.
10. ENERGY: Use of biomass as an energy source, including waste, firewood, methane. Other energy sources are also important (hydro, solar, wind, among others).
11. BIOLOGICAL CONTROL: Use of insects and other living organisms to control pests and diseases, as a means of creating a natural balance, rather than resorting to eradication.
12. AGROFORESTERY: The promotion of tree planting in livestock and crop systems fosters biodiversity, erosion control, firewood generation and wind control, among other benefits.
13. POLLINATION: Pollinating insects, especially bees, play a key role in the reproduction of plant species.
14. WATER MANAGEMENT: Agroecology makes rational and optimal use of this resource, in keeping with an integrated vision of ecosystems. It promotes water storage in the soil through practices that limit runoff, erosion and evapotranspiration.
15. TRADITIONAL SEEDS, QUALITY SEEDS: the valuing of traditional seeds and the creation of new varieties enriches biodiversity and shapes natural ecosystems. The use of healthy seeds reduces the use of phytosanitary products. Source: FAO 2018c.
5.4.
Public purchases (see section 3.2.7)
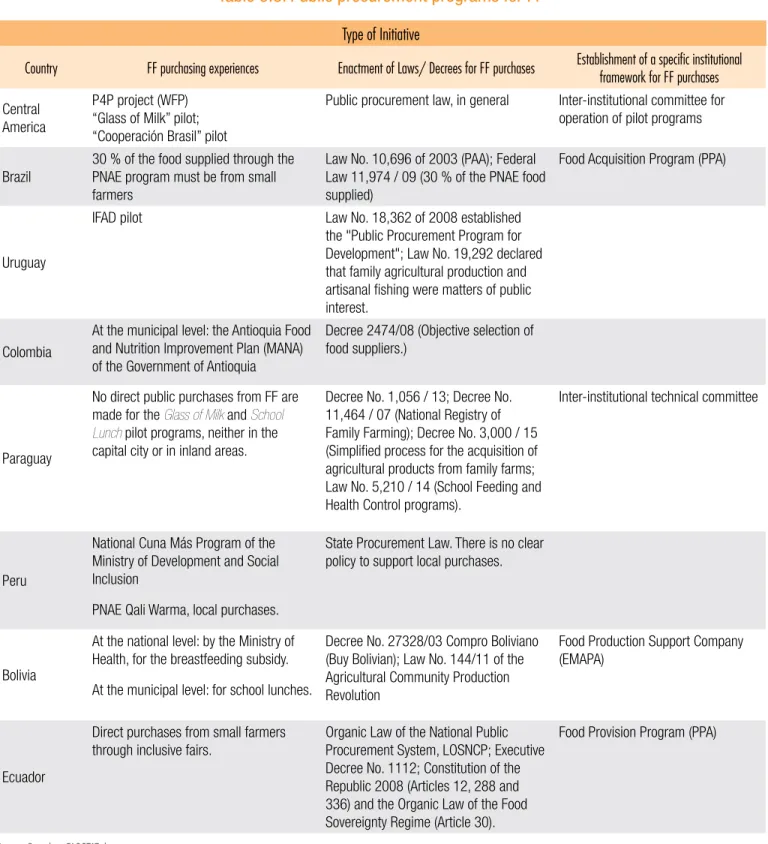
Table 5.3. Public procurement programs for FF
Type of Initiative
Country FF purchasing experiences Enactment of Laws/ Decrees for FF purchases Establishment of a specific institutional framework for FF purchases Central
America
P4P project (WFP) “Glass of Milk” pilot; “Cooperación Brasil” pilot
Public procurement law, in general Inter-institutional committee for operation of pilot programs
Brazil
30 % of the food supplied through the PNAE program must be from small farmers
Law No. 10,696 of 2003 (PAA); Federal Law 11,974 / 09 (30 % of the PNAE food supplied)
Food Acquisition Program (PPA)
Uruguay
IFAD pilot Law No. 18,362 of 2008 established
the "Public Procurement Program for Development"; Law No. 19,292 declared that family agricultural production and artisanal fishing were matters of public interest.
Colombia
At the municipal level: the Antioquia Food and Nutrition Improvement Plan (MANA) of the Government of Antioquia
Decree 2474/08 (Objective selection of food suppliers.)
Paraguay
No direct public purchases from FF are made for the Glass of Milk and School
Lunch pilot programs, neither in the
capital city or in inland areas.
Decree No. 1,056 / 13; Decree No. 11,464 / 07 (National Registry of Family Farming); Decree No. 3,000 / 15 (Simplified process for the acquisition of agricultural products from family farms; Law No. 5,210 / 14 (School Feeding and Health Control programs).
Inter-institutional technical committee
Peru
National Cuna Más Program of the Ministry of Development and Social Inclusion
PNAE Qali Warma, local purchases.
State Procurement Law. There is no clear policy to support local purchases.
Bolivia
At the national level: by the Ministry of Health, for the breastfeeding subsidy. At the municipal level: for school lunches.
Decree No. 27328/03 Compro Boliviano (Buy Bolivian); Law No. 144/11 of the Agricultural Community Production Revolution
Food Production Support Company (EMAPA)
Ecuador
Direct purchases from small farmers through inclusive fairs.
Organic Law of the National Public Procurement System, LOSNCP; Executive Decree No. 1112; Constitution of the Republic 2008 (Articles 12, 288 and 336) and the Organic Law of the Food Sovereignty Regime (Article 30).
Food Provision Program (PPA)
5.5.
The dynamics of LAC’s trade in products
(see Section 3.2.5)
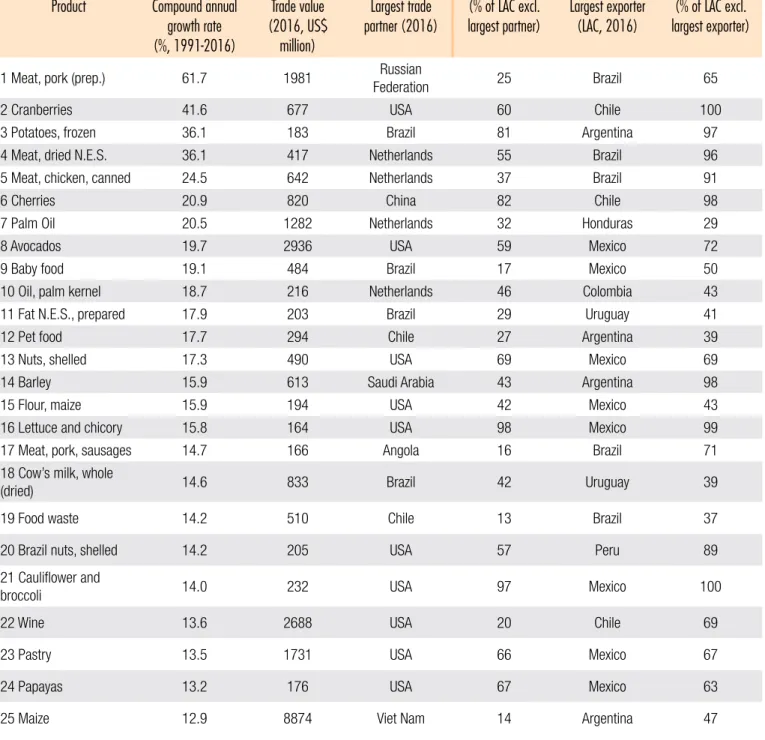
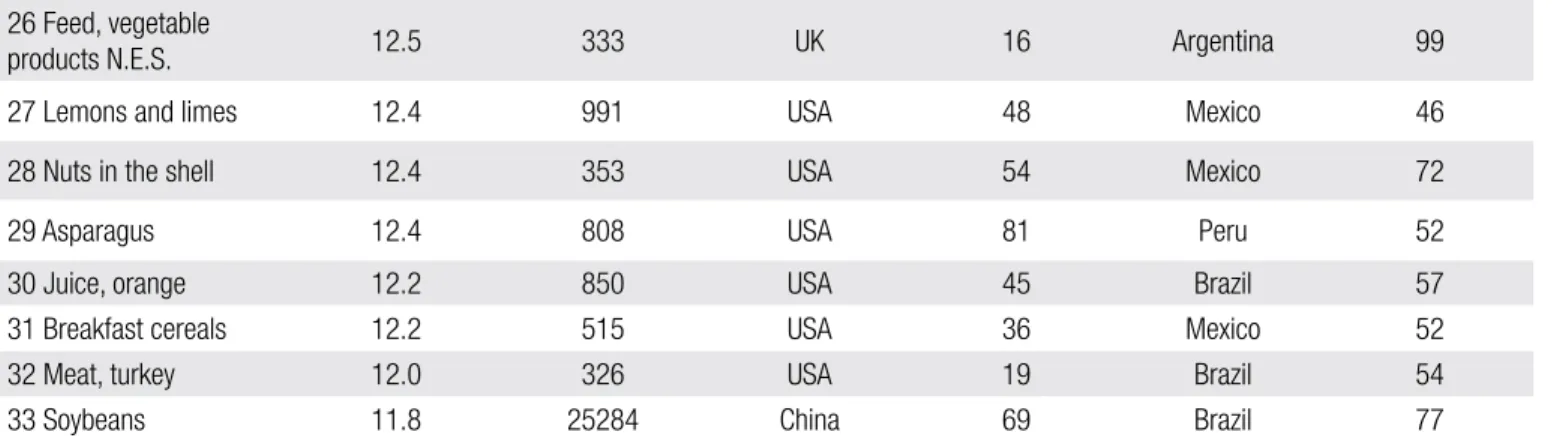
Table 5.4. The 32 crops and livestock products whose export growth outpaced soy
(1991-2016, annual growth rates)
Product Compound annual growth rate (%, 1991-2016) Trade value (2016, US$ million) Largest trade
partner (2016) largest partner)(% of LAC excl. Largest exporter (LAC, 2016) largest exporter)(% of LAC excl.
1 Meat, pork (prep.) 61.7 1981 FederationRussian 25 Brazil 65
2 Cranberries 41.6 677 USA 60 Chile 100
3 Potatoes, frozen 36.1 183 Brazil 81 Argentina 97
4 Meat, dried N.E.S. 36.1 417 Netherlands 55 Brazil 96
5 Meat, chicken, canned 24.5 642 Netherlands 37 Brazil 91
6 Cherries 20.9 820 China 82 Chile 98
7 Palm Oil 20.5 1282 Netherlands 32 Honduras 29
8 Avocados 19.7 2936 USA 59 Mexico 72
9 Baby food 19.1 484 Brazil 17 Mexico 50
10 Oil, palm kernel 18.7 216 Netherlands 46 Colombia 43
11 Fat N.E.S., prepared 17.9 203 Brazil 29 Uruguay 41
12 Pet food 17.7 294 Chile 27 Argentina 39
13 Nuts, shelled 17.3 490 USA 69 Mexico 69
14 Barley 15.9 613 Saudi Arabia 43 Argentina 98
15 Flour, maize 15.9 194 USA 42 Mexico 43
16 Lettuce and chicory 15.8 164 USA 98 Mexico 99
17 Meat, pork, sausages 14.7 166 Angola 16 Brazil 71
18 Cow’s milk, whole
(dried) 14.6 833 Brazil 42 Uruguay 39
19 Food waste 14.2 510 Chile 13 Brazil 37
20 Brazil nuts, shelled 14.2 205 USA 57 Peru 89
21 Cauliflower and
broccoli 14.0 232 USA 97 Mexico 100
22 Wine 13.6 2688 USA 20 Chile 69
23 Pastry 13.5 1731 USA 66 Mexico 67
24 Papayas 13.2 176 USA 67 Mexico 63
26 Feed, vegetable
products N.E.S. 12.5 333 UK 16 Argentina 99
27 Lemons and limes 12.4 991 USA 48 Mexico 46
28 Nuts in the shell 12.4 353 USA 54 Mexico 72
29 Asparagus 12.4 808 USA 81 Peru 52
30 Juice, orange 12.2 850 USA 45 Brazil 57
31 Breakfast cereals 12.2 515 USA 36 Mexico 52
32 Meat, turkey 12.0 326 USA 19 Brazil 54
33 Soybeans 11.8 25284 China 69 Brazil 77
Source: Based on FAOSTAT data.
Note: Ordered by decreasing export value CAGR (1991-2016). Products with a current export value of less than US$ 150 million are not included.
5.6.
Social and production inclusion
(see section 3.2.4)
Figure 5.9. Linkages between social welfare, household consumption, production activities and the local
economy
Income/own production: • Savings • Investment • ConsumptionThe impact of social welfare & agricultural interventions is determined by:
• Gender
• Agroclimatic conditions
• Economic context (prices, infrastructure, markets)
• Social context (community, culture)
• Services
Rural household resources:
• Physical: land, machinery, livestock
• Human: labour, nutrition, education, health
• Social: networks, labour sharing
• Financial: formal and informal credit, savings
• Natural: soil, water, air
Interaction with the local economy & community:
• Markets for goods, inputs, factors of production, labour, financial services
• Social networks
• Health and education services
Social welfare and agricultural interventions address threats and constraints that affect consumption and production
Social welfare has an impact on household income, consumption and production decisions and their implementation, as well as on market demand and constraints.
Agricultural interventions are needed to address structural constraints. These may include land reform, extension services, irrigation, microfinance, infrastructure, inputs, etc.
Households make consumption
and production decisions based on the level and quality of their resources and the constraints they face.
Consumption activities
Table 5.5: Differentiated objectives and pathways for social and production inclusion in family farming
Subsistence family farming In-transition family farming Consolidated family farming
Social welfare policies for family farming households
Non-contribution-based social welfare: • Protect the consumption of basic
goods
• Promote the SANN
• Promote human capital development • Mitigate the effects of disasters and
catastrophes
• Promote entrepreneurship and profitable and ambitious strategies
Combination of contribution-based and non-contribution-based social welfare: • Protect the consumer
• Promote medium-term economic planning
• Promote strategic investments with production inclusion mechanisms Social security and insurance: Reinforce efforts to prepare for climate, economic and social contingencies
Social security (They are now in a position to make their own contributions to contain their risks) Make the application of standards in relation to decent employment more effective, considering that this segment uses more labor and more seasonal workers.
Production policies for family farming
Creation of capital (capital formation) • Capacity-building
• Production improvements and own consumption
• Access to production assets and inputs • Regularization of assets and records
for recognition by users
Management and organizational strengthening (in terms of production, associations, and community groups) • Promotion of the formation of
associations and organizations • Capacity-building and business
management (with women playing a key role)
• Market access • Training
• Access to production assets • Differentiated financial mechanisms
Production/ trade linkages • Access to financial investment
mechanisms
• Capacity-building (investment and management)
• Production diversification • Access to new markets
• Production and trade partnerships • Generation of employment
5.7.
Towards a sustainable bioeconomy: lessons
learned from case studies (see chapter 4 )
5
Food Security
1. The impact of bioeconomy initiatives on food security is not automatically determined based solely on the use of food or non-food raw materials. This should be considered in addressing problems such as the debate on foods versus the production of fuels, which has arisen with respect to biofuels.
2 The production of bioproducts should contribute to rather than impede food production. This can be achieved by intensifying land use, using different types of terrain (including marginal land) to produce food and non-foods products, and by shifting to integrated production systems that combine the production of food and non-food products, such as integrated food and energy systems. In so doing, two key aspects should be addressed, namely:
a) The notion of what constitutes marginal land is complex (For example, should land that is used only occasionally be considered marginal?) and dynamic, as it can change over time. Thus, the decision to classify land as marginal and to define its use, should arise out of an inclusive process, involving all principal stakeholders. In determining its use, one should carefully consider actions that will be taken when the land is no longer marginal and when other options (e.g. for food production) may be available.
b) Special attention should be paid to possible competing uses (e.g. soil management, animal feed, bioenergy and bioproducts) of food production residue. Indeed, the growing demand for various bioproducts may increase competition for biomass and natural resources among various sectors of the bioeconomy, including the food sector. Actual and potential uses of residue should always be included in any feasibility analysis of bioeconomy initiatives based on the use of residue, since it can be the source of important goods and services for communities.
3. Accessing food often poses a challenge. Improved access can be achieved by increasing land tenancy security—a precondition for bioeconomy development which is often overlooked—and by adopting technologies that make optimal use of all components of biomass, thereby creating opportunities to obtain greater revenue from food and non-food products.
4. The optimal use of food is another dimension of food security to which the development of the bioeconomy can contribute, through: (i) better access to sustainable bioenergy for cooking; (ii) increased production of bionutrients; (iii) improved knowledge about healthy microbiomes.
5. Traditional and innovative processes and technologies used in the bioeconomy can facilitate the efficient and effective use of biomass, by utilizing all components of a given raw material, which in many cases was originally a food product. Local knowledge, including from indigenous communities, should be respected and valued, since it can contribute significantly to the development of the bioeconomy, particularly to the production of biocosmetics and biopharmaceutical products.
Natural resource management
1. The sustainable management of natural resources undoubtedly affects the sustainable development of the bioeconomy. It is often considered to be a matter that should be addressed in order to guarantee sustainable production and processing of biomass, and thus, good practices related to the sustainable management of land, water, forests and biodiversity are often part of bioeconomy operations. However, direct and indirect changes in land use are usually not considered when the local development of the bioeconomy calls for a modification in the production of biomass.
2. The sustainable management of natural resources and inputs related to bioproducts can benefit the environment
5Summary of lessons learned from the FAO project “Toward Sustainable Bioeconomy Guidelines”, with the support of the Federal Ministry of Food and Agriculture of Germany (BMEL), based on
and supports commercial arguments in favor of bioeconomy initiatives.
3. Small-scale biomass producers, including indigenous people that are the custodians, users and beneficiaries of natural resources, must be duly considered and given the power to make decisions regarding the development of the bioeconomy.
4. Sustainable management of natural resources is a pre-condition to ensuring that the bioeconomy can assist in tackling climate change-related challenges.
Climate change
1. Bioproducts are not climate-smart per se. A shift towards low-emission biomass production and the climate-smart management of natural resources needed to bring about this shift, as well as the use of clean energy throughout the bioeconomy value chain, are the major factors that will determine the extent to which the bioeconomy will contribute to mitigating the effects of climate change. Other factors are reduced deforestation, rehabilitation of degraded lands, carbon capture and use and the elimination of practices involving the burning of residue.
2. Although it is not stated openly, the bioeconomy usually improves adaptation by:
a) sustainably managing natural resources, thereby boosting the resilience of the local environment; and
b) increasing the standard of living by generating additional opportunities for income and employment through the production and trading of bioproducts.
Responsible production and consumption
The lessons learned in this area primarily point to the importance of establishing linkages between producers and consumers during different phases of bioeconomy activities, in order to ensure that a balance is created between their respective rights, responsibilities and benefits in terms of the bioeconomy, which can be achieved in different ways:
1. By adopting a value web approach rather than a value chain approach, since the former considers two ways of addressing
the growing demand for biomass and the competition that arises as a result of the development of the bioeconomy: greater integration between all components of the value web and the promotion of the cascading use of biomass. It also calls for the establishment of partnerships that promote and link production and responsible consumption throughout the entire bioeconomy value web to ensure efficiency and inclusion. Moreover, these partnerships will be a means of developing bioproduct markets through purchase agreements. This includes contract farming and partnerships between providers and investors in technological intellectual property, business to business partnerships and partnerships between public entities and manufacturers of bioproducts (e.g. public procurement programs).
2. By creating regional bioeconomy clusters that promote the forging of partnerships at different levels.
3. Certification is very limited in terms of scope, affordability and feasibility. By itself, it cannot guarantee the sustainability of bioeconomy value chains to any great extent. Certification systems should be combined with other types of support (e.g. p0licies, regulations, institutions and communication activities) to create an enabling environment that can support expansion of bioeconomy certification initiatives.
Economic growth
Value Added
1. The use of multi-purpose raw materials may contribute to adding value to biomass, since it enables the manufacture of various bioproducts. It also allows for the combined production of new and traditional products, reducing the risks associated with new technologies.
2. Production of various bioproducts may occur in a sequential manner (cascade approach) or simultaneously, such as in some biorefinery operations. Decisions to determine the cascading sequence of biomass uses should not be made solely on the basis of adding economic value. Other criteria (such as carbon storage, local uses such as dendroenergy for cooking, and processing costs) can be important for various stakeholders. Thus, all decisions regarding sequencing in biomass processing should be the result of an inclusive local process involving multiple stakeholders.
Employment
1. New bioeconomy activities offer numerous employment opportunities, particularly for rural women and youth. Nonetheless, training is often an essential requirement to generate employment through bioeconomy initiatives that introduce new technologies, particularly in the biomass processing phase.
2. In great measure, urban populations are responsible for driving the demand for bioproducts. Economic resilience can be bolstered by strengthening the linkages between the rural and urban environments and improving territorial cohesion by way of sound local value chains.
3. There are potential risks associated with employment in the new bioeconomy.
a) Competition may arise between traditional jobs (for example, production of traditional food products) and the new types of jobs (such as in the bioproduct value chains). New technologies may also reduce employment opportunities, whereas more conventional technologies that are more labor-intensive may be less profitable.
b) Attention may be focused on increasing the number of job opportunities, while paying scant regard to guaranteeing the quality of these new jobs.
Circular economy
1. Microbiological and biotechnological processes are key elements in the application of circular principles in the bioeconomy. They involve the use and ever-increasing production of bioproducts linked to carbon dioxide, through carbon capture and use. The application of circular principles often fosters the increased sustainability of bioeconomy initiatives. Thus, the challenges to be faced are related to the possible competition between the various uses of residue and the costs and logistics that this implies. The quality of bioproducts influences the extent to which they are biodegradable and compostable. These characteristics should not be taken for granted, since they can significantly affect the successful application of circular principles in the bioeconomy.
Good governance
Governance in the production and use of biomass refers to decision-making processes that should be established, that is the roles, rights and responsibilities of various actors, as well as the requisite types of policies, regulations, institutions and information and communication channels.
A review of case studies has revealed that the following factors have proven successful in the governance of the bioeconomy.
1. Inclusive decision-making in all relevant spheres is critical to the design and implementation of the bioeconomy.
2. A territorial/ landscape approach can contribute to the efficient production and use of biomass and the related inputs within a territory.
3. Regional bioeconomy clusters can assist in the application of circular bioeconomy practices.
4. Contract farming benefits biomass producers, since it can provide them with a guaranteed market and in some instances, with technical assistance. It also assists biomass manufacturers and retailers, as it affords them a continuous and regular supply of material. As mentioned before, governments usually become involved to ensure that these contracts are fair for both parties.
5. A supra-ministerial organization close to the highest level of Government can coordinate national bioeconomy efforts.
6. Public mechanisms (e.g. public procurement programs, coherent policies regarding incentives and taxes or public awareness campaigns) should promote consumer acceptance.
7. Collaboration mechanisms between stakeholders, including public-private partnerships and bioeconomy platforms should contribute to the transparent sharing of information and knowledge, while playing a pivotal role in decision-making. Defined, profitable and inclusive targets to monitor and assess progress and sustainability should be flexible enough to be adjusted in keeping with the objectives of a country’s bioeconomy strategy.
PO Box: Casilla 179-D, Santiago de Chile Postcode: 7630412 E-mail: dpisantiago@un.org Website: www.cepal.org E-mail: FAO-RLC@fao.org Website: www.fao.org/americas Fax: (506) 2216-0233 E-mail:iicahq@iica.int Website: www.iica.int