HAL Id: hal-01153275
https://hal.archives-ouvertes.fr/hal-01153275
Submitted on 19 May 2015HAL is a multi-disciplinary open access
archive for the deposit and dissemination of sci-entific research documents, whether they are pub-lished or not. The documents may come from teaching and research institutions in France or abroad, or from public or private research centers.
L’archive ouverte pluridisciplinaire HAL, est destinée au dépôt et à la diffusion de documents scientifiques de niveau recherche, publiés ou non, émanant des établissements d’enseignement et de recherche français ou étrangers, des laboratoires publics ou privés.
STAGE IN FUSE WIRE
Alain Coulbois, Pascal André, William Bussiere, Jean-Louis Gelet, David
Rochette
To cite this version:
Alain Coulbois, Pascal André, William Bussiere, Jean-Louis Gelet, David Rochette. SPECTRO-SCOPIC STUDY OF THE TRANSITION STAGE IN FUSE WIRE. XXth International Conference on Gas Discharges and their Applications, GREMI, Jul 2014, Orléans, France. pp.227. �hal-01153275�
SPECTROSCOPIC STUDY OF THE TRANSITION STAGE IN FUSE WIRE
*
COULBOIS A.
1, ANDRE P.
1, BUSSIERE W.
2, GELET J.L.
3, ROCHETTE D.
1 1Clermont Université, Université Blaise Pascal, Laboratoire Arc Electrique et Plasmas
Thermiques, BP 10448, F-63000 CLERMONT-FERRAND, France
2
Clermont Université, Université d’Auvergne, Laboratoire Arc Electrique et Plasmas
Thermiques, BP 10448, F-63000 CLERMONT-FERRAND, France
3
MERSEN France, 15 Rue Jacques Vaucanson, F-69720 St-Bonnet-de-Mure
*
Alain.COULBOIS@univ-bpclermont.fr
ABSTRACT
Precedent simulation work determined that Laplace forces could have an effect on the prearc-arc transition in fuses [1-2]. An experimental study on exploding wire is done to understand transition differences between low and high current variations. The paper is focused on the low current variations.
1. INTRODUCTION
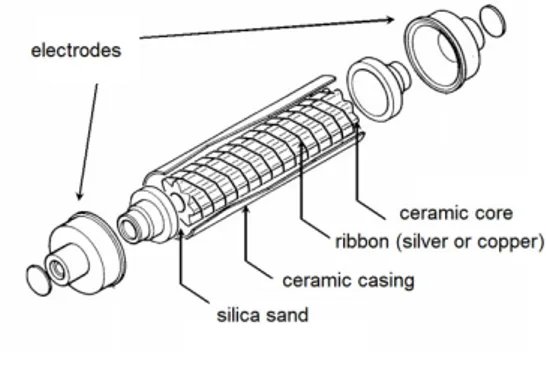
Fuses typically comprise five elements (figure 1) [3]: one or several ribbons which can be wrapped around ceramic core or just be aligned between the two fuse electrodes, which are encapsulated in a cartridge (ceramic or fiberglass). The cartridge is filled with silica sand that ensures isolation and inductive energy absorption during breaking.
Fig 1
High breaking capacity fuses [3]
Fuse elements consist of high purity silver or copper (99.99%) with different shapes of reduced sections depending on the type of overloading the fuse has to cut. For example, the more the voltage is important and the longer will be the reduced section.
These strings of different reduced sections allow the fuse to be adapted for several sorts of overloading although each fuse has a proper
domain of overload. Lately, evolution of the grid involved uses of more converters DC-AC or AC-DC which must be protected. Frequencies can be superior to 50 Hz and implies higher di/dt for the same peak current.
This study tries to understand impact of great
di/dt during breaking and more precisely during the prearcing stage. To compare experiments and real situation in breaking, one uses current densities given in table 1 and variation of current densities dj/dt in table 2.
Nominal Minimum overload
High overload 500A/mm² 2500A/mm² 50000A/mm²
Table 1 Current densities in fuses
Standard dj/dt High dj/dt 0-100 A/µs.mm² >1000A/µs.mm²
Table 2
Current densitiy variations in fuses
In part 2 some precisions will be given concerning prearcing stage and some previous results will be recalled to understand the problematic. Part 3 gives some first experiment results which will be discussed in part 4.
2. PREARCING STAGE
With nominal current densities Joule heating in reduced section is low and temperature remains stable because of thermal conduction that allows to evacuate heat. When current exceeds 2500A/mm² Joule heating is no longer balanced by thermal conduction, the temperature rises leading to a large electrical resistivity (figure 4) amplifying Joule heating effect. This cycle leads to the melting of reduced section.
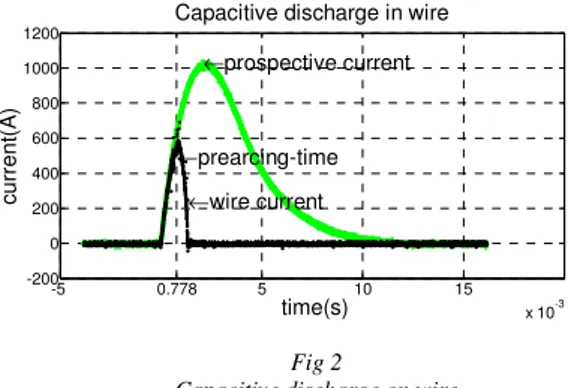
The time between apparition of overload and the apparition of electrical arc is called prearcing time. It’s the time for which curves of overload current without fuse (prospective current) and overload current with fuse separates (figure 2).
-5 0.778 5 10 15 x 10-3 -200 0 200 400 600 800 1000 1200
Capacitive discharge in wire
time(s) c ur rent (A ) ←prearcing-time ←prospective current ←wire current Fig 2
Capacitive discharge on wire
In previous study carried out with industrial fuse elements [4] the transition was studied by comparison between experiments and thermoelectric simulation in the framework on one fuse reduced section. Simulation based on finite elements considered end of prearcing stage when at least one element had received enough energy to vaporize. Whatever experimental context, experiments always showed prearcing time shorter than those simulated [4].
Sometimes energy absorbed by fuse before arcing stage was equivalent to fusion stage and sometimes just a bit more. Presently phenomenon of mechanical disruption in the fuse is unknown. Comparison between simulation and experiments shows that some phenomenon accelerates contacts opening. One hypothesis was to consider Laplace forces applying on reduced section with constriction effect.
A simulation of Laplace forces was done [1] and showed importance of geometric dimension in localization of highest force densities. In case of circular reduced section, simulation indicates coincidence of higher heat constraint and higher forces constraint, which may explain why arcing stage happened so early even if impact of forces on liquid silver is not well known.
Fig 3 Experiment diagram
The previous work focuses to study transition stage on simpler geometry to make diagnostic without geometric influence. The work is now done on wire element and is detailed in section 3.
3. EXPERIMENT
Testing circuit is given in figure 3. A thin wire of high purity (99.99%) copper or silver is mounted between two electrodes spaced by 4 mm. The wire diameter is of 50µm and primary vacuum is made around it. Electrical characteristics are recorded by Tektronix 7104 oscilloscope, using 0.1Ω shunt for current measurement and Tektronix P5200 probe for voltage measurement.
Fig 4,
Evolutions of the electrical conductivity – experimental values as reference data, and calculations for the plasma phase – for the temperature range up to 5000K (SF6 plasma, [10]; Ag plasma, [9]).
500 525 550 1 10 100 1000 t 1 t2 t3 in te n s it y ( a .u .) wavelength (nm) 7.58x10⁻³ 7.60x10⁻³ 0 10 20 t 3 t 1 c u rr e n t (A ), s u m ( V ), v o lt a g e ( V ) time (s) t 2 5.0 7.5 10.0 te m p e ra tu re ( k K ) 5.815x10⁻³ 5.820x10⁻³ 0 10 20 30 t3 t 2 c u rr e n t (A ), s u m ( V ), v o lt a g e ( V ) time (s) t 1 5 10 15 te m p e ra tu re ( k K ) 510 515 520 525 0 100 t 1 t 2 t3 in te n s it y ( a .u .) wavelength (nm) (a) (b) Fig 5,
Current, sum, voltage and observed intensity around 515 nm for (a) , and (b).
An optical fibre is mounted at one end in front of the wire and at the other end to the entrance slit of the spectroscope. Spectroscopic acquisition begins when voltage reaches a threshold fixed experimentally. Acquisition with spectrometer was done with long frame time (21.4µs) and short frame time (0.9µs) for copper and silver. A SUM (Shift Under the Mask) signal from spectrometer is emitted for each frame and recorded by oscilloscope which allows to have same time base with voltage and current acquisition. Arcing stage is commonly considered to begin when a high rise of voltage happens, typically the cathode-anode voltage fall. In our experiments with copper this voltage rise is repeatable and is typically around 16V which is similar to cathode and anode fall commonly known [5].
Tests have been made under low current densities and low dj/dt. In the case of short frame time, spectroscopic recording shows some emission from metallic vapors at the starting of arcing stage (figure 5b) while 21.4µs frame time allows to show this same emission typically 20 or 30µs before arcing stage (figure 5a). If atoms velocity in arc plasma is considered to follow Maxwell-Boltzmann’s distribution, an evaluation of vapor’s temperature can be made. In this case the ratio of two line’s intensity is used [6] (figure 5).
In Figure 4 we show evolution of the electrical conductivity versus temperature for copper and silver mainly. In the low temperature domain
values refer to measurements from Matula [7] up to T=1358K for copper and up to T=1235K for silver [7] (for extrapolation up to 2433K for silver, see [4]). For the low temperature domain values deduced from the Wiedemann Franz law [8] (σ =λ LT, with λ the thermal conductivity, and L =2.48×10⁻⁸ V²/K², the Lorenz coefficient) are very similar to these experimental values, also with extrapolation. Electrical conductivity values are of the order of 106 S/m around 2000K. In electrical arc studies the researchers need data in temperature range higher than 5000K. The electrical conductivity for lower temperature is never presented in logaritm scale (see [9] for silver plasma and [10] for SF6 plasma for more details). Taking these results in logaritm scale, for pure silver plasma, electrical conductivity decreases down to less than 1 S/m around 3000K wich is extremely far from 106 S/m observed with extrapolations.Conductivity from tests is evaluated assuming constant section during prearcing stage, homogeneous temperature along the wire, adiabatic transformation and constant length during the entire test. First hypotheses are quite approximative but allow to obtain tendance curve during prearcing stage, evaluating temperature thanks to energy, which is calculated with current and voltage integral, and thanks to JANAF and Bahrin I thermochimical tables [11-12]. Secondly displacement of current channel has been observed with four Hall-effect sensors located around the wire (not shown in figure 3). Their signals remain equal during transition which lead us to think that arc channel stays right between the two electrodes and keep constant
length for the current, di/dt and dj/dt ranges investigated.
4. DISCUSSION
Prearc-arc transition is a complex phenomenon. Many works dedicated to exploding wires have been published with higher current densities and using essentially capacitive discharges [13]. In these experiments authors have concluded that wire first melts inside and secondly burns. Apparition of metallic vapor before arcing stage in our experiment lets us to assume that wire is surrounded by vapor before breaking. These vapors could become an arc-channel after the mechanical disruption of the wire, actually their temperature is quite high but their density should be measured to better understand their role in conductivity. Simulation shows that considering homogeneous temperature along the wire is not correct although it permits to make first approximations. Future working will be devoted in temperature, electron density and electric field measurements during respectively solid state and plasma state.
REFERENCES
[1] Private communication between LAEPT and
MERSEN, July 2013
[2] Patent WO 2012/123589 A1
[3] O. Bouilliez, J.C.Perez Quesada, Conception
et utilisation de fusibles limiteurs MT, Cahier Technique Schneider n°128 p3.
[4] D Rochette, R Touzani, W Bussière,
Numerical study of the short pre-arcing time in high breaking capacity fuses via an enthalpy formulation, J. Phys.D.: Appl. Phys. 40 pp 4544-4551 2007
[5]I.G.KESAEV, Laws governing the cathode
drop and the threshold currents in an arc discharge on pure metals sov.phys-tech.phys,vol9 n°8 (1965) p 1146-1154
[6] W Bussière, Influence of sand granulometry
on electrical characteristics, temperature and electron density during high-voltage fuse arc extinction, J. Phys. D.: Appl. Phys. 34 pp 925-935, 2001
[7] RA Matula, Electrical resistivity of copper,
gold, palladium, and silver, J. Phys. Chem. Ref. Data, Vol. 8, N°4 pp 1147-1298 1979
[8] JL Bretonnet, Conductivité électrique des
métaux liquides, Techniques de l’Ingénieur, Form. M-69 pp1-8
[9] P André, W Bussière, D Rochette, Transport
coefficients of Ag-SiO2 plasmas, Plasma Chem. Plasma Process. 27 pp 381-403 2007
[10] B. Chervy, A Gleizes, Electrical conductivity in SF6 thermal plasma at low temperature (1000-1500K), J. Phys.D.: Appl. Phys. 31 pp 2557-2565 1998
[11] Bahrin I, In collaboration with G.Platzki, vol1.Ag-Kr aand vol.2.La-Zr, VCH Wein-heim,
Thermochemical Data of Pure Substances, 3rd ed, Federal Republic of Germany, New York, 1995.
[12] JANAF Thermochemical tables. J.Phys. chem. ref. Data, vol.14,Suppl.1,1985
[13] S.A.Pikuz,T.A.Shelkovenko, D.B.Sinars, J.B.Greenly, Y.S.Dimant,and D.A.Hammer.
Multiphase Foamlike Structure of Exploding Wire Cores Phys.Review.Letters