Publisher’s version / Version de l'éditeur:
Vous avez des questions? Nous pouvons vous aider. Pour communiquer directement avec un auteur, consultez la première page de la revue dans laquelle son article a été publié afin de trouver ses coordonnées. Si vous n’arrivez pas à les repérer, communiquez avec nous à PublicationsArchive-ArchivesPublications@nrc-cnrc.gc.ca.
Questions? Contact the NRC Publications Archive team at
PublicationsArchive-ArchivesPublications@nrc-cnrc.gc.ca. If you wish to email the authors directly, please see the first page of the publication for their contact information.
https://publications-cnrc.canada.ca/fra/droits
L’accès à ce site Web et l’utilisation de son contenu sont assujettis aux conditions présentées dans le site LISEZ CES CONDITIONS ATTENTIVEMENT AVANT D’UTILISER CE SITE WEB.
Euronoise 2009 [Proceedings], pp. 1-10, 2009-10-26
READ THESE TERMS AND CONDITIONS CAREFULLY BEFORE USING THIS WEBSITE. https://nrc-publications.canada.ca/eng/copyright
NRC Publications Archive Record / Notice des Archives des publications du CNRC : https://nrc-publications.canada.ca/eng/view/object/?id=d28b4cd4-3e7d-47ad-aede-41d5f0685ef2 https://publications-cnrc.canada.ca/fra/voir/objet/?id=d28b4cd4-3e7d-47ad-aede-41d5f0685ef2
NRC Publications Archive
Archives des publications du CNRC
This publication could be one of several versions: author’s original, accepted manuscript or the publisher’s version. / La version de cette publication peut être l’une des suivantes : la version prépublication de l’auteur, la version acceptée du manuscrit ou la version de l’éditeur.
Access and use of this website and the material on it are subject to the Terms and Conditions set forth at
Prediction of flanking sound transmission in lightweight building
structures with SEA - conclusions on EN 12354 method
Pre dic t ion of fla nk ing sound t ra nsm ission in
light w e ight building st ruc t ure s w it h SEA -
c onclusions on EN 1 2 3 5 4 m e t hod
N R C C - 5 1 3 6 3
S c h o e n w a l d , S .
O c t o b e r 2 0 0 9
A version of this document is published in / Une version de ce document se trouve dans:
Euronoise 2009, Edinburgh, August 26-28, 2009, pp. 1-10
http://irc.nrc-cnrc.gc.ca
The material in this document is covered by the provisions of the Copyright Act, by Canadian laws, policies, regulations and international agreements. Such provisions serve to identify the information source and, in specific instances, to prohibit reproduction of materials without written permission. For more information visit http://laws.justice.gc.ca/en/showtdm/cs/C-42
Les renseignements dans ce document sont protégés par la Loi sur le droit d'auteur, par les lois, les politiques et les règlements du Canada et des accords internationaux. Ces dispositions permettent d'identifier la source de l'information et, dans certains cas, d'interdire la copie de documents sans permission écrite. Pour obtenir de plus amples renseignements : http://lois.justice.gc.ca/fr/showtdm/cs/C-42
Prediction of flanking sound transmission in lightweight
building structures with SEA – Implications for the EN 12354
method
Stefan Schoenwalda
Institute of Research in Construction National Research Council Canada Ottawa ON K1A 0R6 Canada
ABSTRACT
EN 12354 gives a model for the prediction of sound transmission between adjacent dwellings that can be applied in the stage of design of the building. The model takes also into account first order flanking paths and was originally developed for homogeneous monolithic structures (e.g. concrete or masonry). However, more and more lightweight building elements (e.g. joist floors and gypsum board walls) are used in Europe and hence it is desirable to include this type of construction and ensure the approach and assumptions of En 12354 are consistent with the vibration response of lightweight building structures. Thus in a recent research project a statistical energy analysis (SEA) framework is applied to predict flanking sound transmission through gypsum board walls. In this paper the SEA model and the acquisition of some necessary input data are briefly reviewed. Further the validity as well as the limits of the SEA model are discussed and finally conclusions are drawn for a standardization of the model in the context of EN 12354.
1. INTRODUCTION
Noise annoyance in buildings due to sound transmission from adjoining dwellings or sources outside, e.g. traffic or aircraft, is a social and health issue. Thus, all national building codes in Europe define legal requirements are given for the sound isolation and currently in some countries there are attempts to increase them. Although the requirements of the national building codes are formulated using different metrics (e.g. R’W, Dn,T, or even Iluc of NEN 1070) these requirements are based on the performance of the whole building structure rather than on the performance of only the partition element that separates two adjacent rooms.
A standardized method for predicting the apparent sound transmission between two adjoining rooms in a building is given in EN 12354 and can be applied at the design stage of a building. It takes into account the direct transmission through the separating element between the considered rooms as well as additional first order flanking paths involving building elements coupled to this partition. The standardized expressions for the flanking paths are identical to equations derived in a statistical energy analysis (SEA) framework if some simplifying assumptions are made1.
SEA is a well established framework for the prediction of power flow in complex structures that have to fulfill basic SEA conditions – i.e. uniform structural distribution of modal energy in the subsystems in all considered frequency bands. Weakly damped homogenous monolithic building structures – like the concrete and masonry constructions that are traditionally in Europe used are the ones for which the prediction model was developed originally - certainly fulfill the basic SEA conditions.
However, in Europe in the past decades more and more buildings are made from slender lightweight structures, like framed gypsum board walls and joist floor systems, because of
a
economical reasons and to increase the sustainability and flexibility of new buildings. In a recent research project a simple prediction model for flanking sound transmission in this type of structures is developed in a SEA framework and up to five flanking transmission paths are taken into account for a single junction of two elements2.
In this paper the SEA model and the assumptions that are made will be briefly reviewed for a junction of gypsum board walls. Further the fulfillment of basic SEA conditions as well as important factors that have to be taken into account in a standardized model for lightweight structures will be discussed in the context of EN 12354 and ISO 10848 that gives a method for the measurement of the necessary input data. At the end conclusions are provided for the development of a standardize prediction method that is valid for lightweight inhomogeneous and highly damped building structures.
2. FLANKING SOUND TRANSMISSION THROUGH LIGHTWEIGHT BUILDING STRUCUTRES IN TERMS OF SEA
A complete derivation of the flanking expressions of the SEA model is out of the scope of this paper and is done elsewhere2. However, the basic assumptions are outlined briefly in the following and only the expressions used in this paper are presented.
A. SEA system, subsystems and considered power flow
When sound transmission through a structure is considered in SEA, it is split up into a number of subsystems, like rooms, plates and beams, which represent a group of resonant modes. The resonant energy of the subsystems has to be uniformly distributed within the frequency bands considered and hence the modal properties of the subsystems have to fulfil a number of basic SEA conditions that will be discussed later. The exchange of resonant energy between the subsystems and the losses in the subsystems are described by SEA loss factors that are either predicted or measured; power flow through the system is predicted.
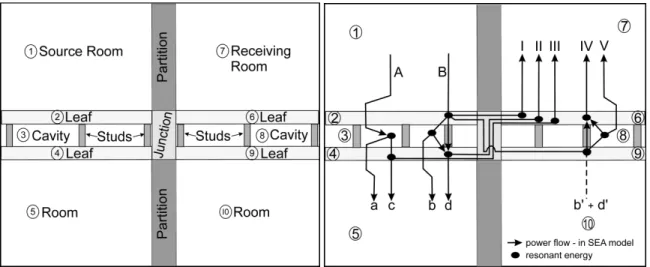
Figure 1 on the left shows the SEA system for flanking transmission through gypsum board walls and the subsystems. Flanking transmission occurs between room 1 and room 7 through two gypsum board walls that are coupled at one junction. The leaves of the flanking walls are considered as single subsystems that only support bending modes. The cavities are resonant subsystems like the rooms and the studs are considered as structural coupling elements between the leaves that do not conserve resonant energy. The “partitions” between the rooms on the left and on the right side are not defined further and the junction is considered as “black-box” that couples the leaves of the two flanking walls only structurally.
In the frequency range of interest non-resonant and resonant energy components are induced in leaf 2 and leaf 4 because the flanking wall is excited by airborne sound in room 1 and the coincidence frequency of the gypsum board leaves is high. Therefore, four different direct sound transmission paths through the flanking wall must be considered below coincidence as indicated in Figure 2. Along path a sound is transmitted non-resonantly through both leaves. Along path b and path c sound transmission is resonant through one and non-resonant through the other leaf. Finally, along path d sound is transmitted resonantly through both leaves that are coupled by the cavity and also structurally by the studs.
Since at the junction only structural power flow is allowed, only the resonant energy component in the leaves on the source side couples across the junction with the leaves of the wall on the receiving side. Power flow between leaf 2 and leaf 6, between leaf 2 and leaf 9 and between leaf 4 and leaf 6 is considered in the complete model and additional sound is transmitted either resonantly or non-resonantly from leaf 9 to room 7. Thus below coincidence five flanking paths (path I to path V) and above coincidence three purely resonant flanking paths (path I, path II and path IV) transmit flanking through the two building elements that are coupled at a single junction.
Figure 1: SEA system for flanking sound transmission through gypsum board walls – left: subsystems and denotations, right: power flow in SEA system
B. Equations and input data for dominating transmission path I
In an earlier paper it has been shown that the flanking sound reduction index R1267 of path I
(denoted simply as R17,I in the following) involving only leaf 2 and leaf 6 is the dominating wall-wall path for the junction considered in this paper and gives a good estimate of the total transmitted sound power3. Further it is assumed that power flow along every path is independent from the others and occurs only in the direction from the subsystem of high energy to coupled subsystems with lower energy. The SEA path-by-path analysis4 can be applied and transmission along path I can be considered separately. The equations of the flanking sound reduction index R17,I are derived in terms of SEA loss factors for both directions and the SEA loss factors are evaluated in terms of acoustical quantities. Since reciprocity holds, direction averaging is applied to reduce the number of unknowns and finally the average flanking sound reduction index
R
17,I is given in terms of acoustic quantities by Equation 1 that is similar to the equation given in EN 12354 for homogeneous weakly damped building structures.6 2 2 6 2 6 2 , 2 2 2 6 , 62 , 26 , 78 13 , 17
5
lg
5
lg
2
2
S
S
S
m
f
m
f
D
D
R
R
R
s c c v v I′
+
′
+
+
+
+
=
η
η
. (1)Equation 1 expresses the flanking sound reduction index in terms of the resonant component of the sound reduction index R13 of leaf 2 and R78 of leaf 6, their loss factor η, their mass per unit area m’, their coincidence frequency fc and their surface area S. Further
R
17,I is normalized to the surface area SS of the partition between the source and receiving room. The second term on the right hand side includes the velocity level differences between leaves 2 and 6 when either leaf 2 (Dv,26) or leaf 6 (Dv,62) is excited structurally. Hence both are for resonant motion only.In this paper, necessary input data for equation 1 are either measured using the test specimen (resonant velocity level differences Dv,ij, total loss factor η as discussed later) or predicted (resonant sound reduction index Rij using the theory of Leppington5 as outlined elsewhere2).
3. MEASUREMENT SETUP
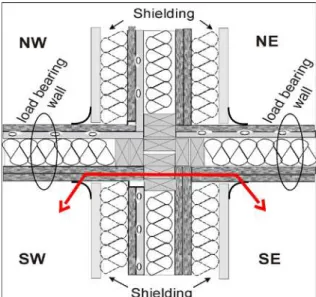
In this paper measurements are carried out for the wall-wall flanking path between the room SW (south-west) and room SE (south-east) on the ground floor of the two-story IRC/NRC flanking test facility in Ottawa to gather necessary input data for the prediction model. The orientation of the four rooms on the ground floor and there designations are given in Figure 2. Also a second well established measurement method is applied to measure the flanking sound reduction index of the considered wall-wall junction to gauge the accuracy of the SEA model. Further the velocity distribution of the leaves of the gypsum board walls and decay with distance to the junction is investigated at the junction specimen.
A. Test specimen
This paper examines flanking transmission through the load bearing walls separating the north and south rooms of Figure 2. All separating walls were single wood stud walls having studs (38x89 mm) spaced 406 mm on center. On one side of the frame, two layers of 16 mm gypsum board were directly attached to the studs. On the other side, one layer of 16 mm gypsum board was attached via resilient metal channels to the studs. The resilient metal channels were installed perpendicular to the studs with a spacing of 610 mm. The cavity was filled with 90 mm of mineral wool.
To isolate flanking transmission paths, the direct transmission path must be suppressed. Thus, the non-load bearing walls separating rooms on the East and West sides of the facility were shielded on both sides with 16 mm gypsum board on a layer of 90 mm encapsulated mineral wool. The shielding was not attached mechanically to the walls and joints between the boards were taped with aluminum tape. The ceilings of the rooms comprised of two layers of 16 mm gypsum board attached to resilient channels and thus sound transmission involving these surfaces were suppressed sufficiently.
Figure 2: Junction, orientation of rooms in this paper (southeast (SE), southwest (SW), northwest (NW); northeast (NE)) and considered transmission path
B. Surface velocity measurements
Velocity level difference estimates were obtained using scanning laser vibrometer system (Polytec, PSV-300) and a 300 mm, or less, measurement grid. Setup of the vibrometer is very time consuming so the velocity was measured on one surface for all excitation positions and afterwards it was moved to the next room. Therefore, it was necessary to normalize velocities to the excitation power of the (airborne or structure borne) source and the velocity level differences were calculated afterwards. For structure borne excitation, every leaf was excited
with an electro-dynamic shaker at a minimum of six different positions or alternatively with a sound system with 4 loudspeakers in each room.
C. Flanking transmission from airborne measurements
The flanking sound reduction index
R
17,I for the wall-wall paths between rooms SE and SW was characterized using the so-called indirect method of ISO 10848, a well established method to measure flanking transmission. The data was collected by an automated measurement system – a computer controlled the microphone positioning robot and four loudspeakers in each room. Sound pressure levels were an average of 6-positions and were measured simultaneously in every room. The reverberation time was measured at the same positions. The presentedR
17,I is direction averaged and restricted to the frequency range of 125 to 3150 Hz because of sound transmission through the shielded separating partition at low frequencies and due to background noise at high frequencies. Shielding was applied to the surfaces of the walls in stages and the apparent sound reduction index measured for all possible shielding conditions. From the measurements was possible to obtain an estimate of the sum of flanking paths not involving specimen under test (i.e., the sum of the paths involving the ceilings and shielded separating walls).3. MEASUREMENT AND PREDICTION RESULTS A. Surface velocity distribution
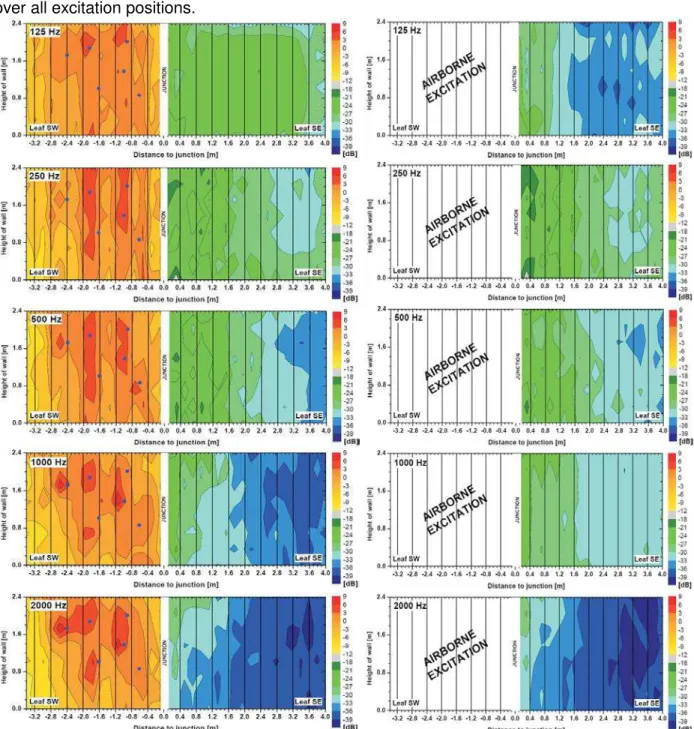
A more detailed analysis of the structural power flow across a junction and the distribution of vibration energy in the gypsum board leaves will be presented in a companion paper6. In this paper only the spatial distribution of the velocity on the leaves of the two coupled walls is investigated briefly when one is excited either structurally or by airborne sound. For structure borne excitation with a shaker the velocities are measured on the excited leaf as well as on the receiving leaf. Since the motion of both leaves is purely resonant the results can be used as input data for the SEA model without manipulation. For airborne excitation the spatial distribution of the velocity is measured on the receiving leaf because on the source side below coincidence frequency (fc = 2350 Hz for the considered leaves) there is also a non-resonant velocity component that is forced by the airborne sound waves. The velocity distributions are similar for excitation in room SE and room SW. Only one case is presented exemplarily in figure 3 for the octave bands from 125 Hz to 2000 Hz.
On the left the velocity is shown for structural excitation at six randomly chosen points indicated by the blue dots and the data was processed as follows. First the difference of the space averaged velocity level on the source leaf and the measured level at every point of the grid was calculated. Afterwards the level differences were averaged for all six excitation points to reduce the amount of data. For airborne excitation shown on the right in Figure 3 the velocities were only measured on the receiving leaf. The measured values were normalized to the ratio of the space average velocity for structural and for airborne excitation on the receiving leaf. The quantity obtained is of the same magnitude as for structural excitation enabling direct comparison of the plots on the right and left.
The velocity patterns on the receiving leaf are similar for the both airborne and structural excitation and the decay of the velocity level with distance to the junction increases with frequency. The biggest difference between both on this leaf is present in the 125 Hz octave band where the velocity level decay with distance to the junction is bigger for airborne excitation than for structure-borne excitation. With the used shaker system it was not possible to inject sufficient power in the low frequency bands and hence the velocities measured farther away from the junction in the 125 Hz octave band are affected by background noise. On the source side the velocity level decay with distance to a point source also increases with frequency,
however in the graphs in figure 3 the gradient is small since the presented data is averaged over all excitation positions.
Figure 3: Distribution of velocity levels on gypsum board leaves when leaf SE is excited (vertical lines: studs)left: structurally with shaker (positions blue dots) right: with airborne noise
Considering the change of the velocity patterns with frequency the plots clearly show that in the 125 Hz, 250 Hz and 500 Hz octave bands the velocity is more or less constant over the whole height of the wall on both sides of the junction and propagation attenuation occurs mainly in direction perpendicular to the studs. Thus, the leaves and the studs can be considered as line connected in this frequency range. In the 1000 Hz and 2000 Hz octave band on the source side at the shaker positions the gradient of velocity is almost as big in direction parallel as perpendicular to the studs, direct fields are visible and the leaves and the studs are considered as point connected. Further on the receiving leaf close to the junction the velocity levels are not equal along the whole junction length and the largest velocities are measured at the upper edge of the closest bays.
Since the gypsum board of the leaves is discontinuous at the junction sound power has to be transmitted by the framing across the junction and the measured velocity distribution on the receiving side indicates that the junction type is changing with frequency. In the lower octave bands the equal velocity levels close to the junction indicate that energy is transmitted over the whole junction length like at a classical line junction like e.g. between steel plates that are welded at on edge together. In the higher frequency the large levels at the upper edge of the first bays of the receiving leaf indicate that probably most of the energy is transmitted by the wood head plates that are continuous across the junction and power is injected in the receive leaf even further away from the junction at the top of the bays. The junction regime in this case is closer to a point connection between the leaves at the top than a line connection over the whole junction length. This assumption will be confirmed in the companion paper when the structural power flow in the leaves close to the junction is estimated from velocity scans6. Thus a more detailed study or prediction model certainly propagation of structure-borne sound the framing members have to be investigated.
The total decay on the receiving wall with distance to the junction is more than 10 dB in all plots except for the structure-borne excitation in the 125 Hz octave band. For the 250 Hz and 500 Hz octave bands this decay has exceeded 10 dB at the sixth stud from the junction (a distance of 2.4 m) and for the higher frequencies levels drop off more rapidly, experiencing 10 dB at the forth stud (a distance of 1.6 m).
B. Flanking sound reduction index
In the previous section it was shown that one basic SEA condition, i.e. the presence of a sound field with uniformly distributed energy in the subsystems is certainly not fulfilled for lightweight framed building structures. For airborne excitation the response of the source leaf is rather uniform since the wall in the source room is excited over its whole surface, but the velocity has a strong gradient for structural excitation by a shaker on the source leaf or for transmission across the junction on the receiving leaf respectively. Hence, generally propagation attenuation in the leaves or the walls respectively has to be taken into account in any prediction model for lightweight structures.
In this paper measured data is used as input data for the resonant velocity level differences in Equation 1. It was shown in Figure 3 that the average response of the source leaf is rather uniform if sufficient excitation points are used. Further the response of the receiving leaf is similar for both airborne and structure-borne excitation. Thus the resonant velocity level differences measured with structural excitation have approximately the same propagation attenuation like the sound transmission case that is predicted. However, so far measured data is only valid as input data for the particular situation where it is measured.
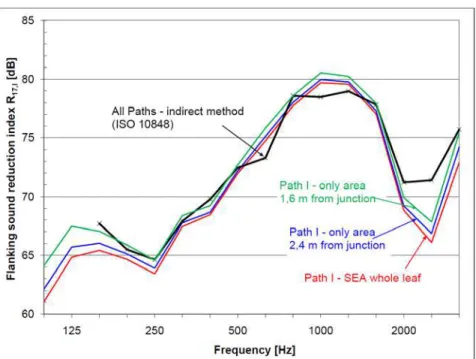
The flanking sound reduction index R17 of the considered wall-wall junction measured according to the indirect method of ISO 10848 is presented in Figure 4. Further the flanking sound reduction index
R
17,I of the dominant path I of the SEA model is predicted using Equation 1. The red line shows predictedR
17,I when the whole area of both leaves is considered and the input data are the space average velocity level differences of all points of the measurement grid. As already presented earlier elsewhere2 measurement according ISO 10848 that contains all paths of the SEA model and the prediction of path I agree well. The difference between measured (all paths) and predicted (path I) exceeds 2 dB only close to the coincidence frequency in the 2500 Hz band due to the rather large uncertainty in the predicted resonant sound reduction index of the leaves used in Equation 1.Figure 4: Flanking sound reduction index
17
R for wall-wall path measured with indirect method of
ISO 10848 and predicted according Equation 1 as function of considered area on receiving leaf
In the following only the portion of the measurement grid on the receiving leaf that is close to the junction is used for the velocity level differences and also the size of the surface area of the receiving leaf in Equation 1 is reduced since velocity plots in Figure 3 showed a strong decay with distance to the junction. Two areas are considered – less than 2.4 m and 1.6 m away from the junction –because the velocity level decay at these distances exceeds 10 dB in different frequency bands as discussed earlier. Predicted results using these input data are also presented in Figure 4 (blue and green line) and
R
17,I is only slightly – less than 1 dB – larger in most of the frequency range than the prediction when the whole receiving leaf is considered. Only in the low frequency range, where the decay across the leaf was less than 10 dB for structural excitation, increases the difference between the predictions. However, it is still only 3 dB for the smallest and the biggest area. In this frequency range prediction with the smallest area matches best with the measurement according ISO 10848; but remember a mismatch of the velocity gradient was found for both excitation cases in the 125 Hz octave band in Figure 3.Generally, the results indicate that most of the sound power is radiated into the receiving room by the area close to junction where the velocity levels are large and if propagation attenuation is great the sound power radiated from areas further away does not contribute to the total transmitted sound power.
4. CONCLUSIONS
In this paper flanking sound transmission through a junction of wood framed gypsum board walls was investigated. A simple prediction model was briefly reviewed that has been developed in a statistical energy analysis (SEA) framework and takes into account five flanking paths for a single junction. Only the dominant path (path I) was used for investigation in this paper since it was shown that it gives a good estimate of the total flanking sound transmission for the wall-wall junction. The equation for the flanking sound reduction index of path I was similar to the ones given in the standardized prediction model of EN 12354 for “heavy” homogeneous weakly damped building structures.
In the experimental part of this paper, first the velocity distribution on the leaves was investigated for both airborne and structural excitation. The velocity patterns are similar for both if a fairly large number of excitation points are used for structural excitation. Further the velocity has a significant gradient with distance to the junction or to the excitation points. Propagation attenuation is different in direction parallel and perpendicular to the studs when the gypsum board is line connected to the studs in the low and the middle frequency range. Thus, propagation attenuation has to be taken into account in prediction models as it is done with Nightingale’s five factor method7. Further energy is transmitted structurally over the whole length of the junction in the low frequencies whereas in the point connected regime (high frequencies) most energy seems to be transmitted in a limited area at the top by the continuous head plate of the wall framing as it will be further confirmed in a companion paper6.
Normalization of measured data and transfer to a different geometrically situation during prediction is done in EN 12354 and ISO 10848 for homogeneous weakly damped structures by considering the loss factor, junction length and dimensions of the building elements. However, this approach is not sensible for lightweight framed structures. In the line connected regime the loss factor does not adequately describe the propagation attenuation in the leaves. Furthermore, in the point connected regime the transmitted energy at the junction might not be proportional to the actual junction length. For walls the error due to extrapolation of results to other situations is likely small since the height of the test specimen is similar to real buildings. However, for floor junctions with a greater variation of junction length the error can be significant. Thus normalization of measured data and extrapolation to other junction lengths is only valid when the transmitted energy is proportional to junction length.
Additionally, the actual length or size of the coupled elements does not affect the measured flanking sound reduction index if the velocity level decay due to propagation attenuation on the receiving leaf is more than 10 dB over the length of the element. Most sound power is radiated into the receiving room by the area of the leaf close to junction. Excitation in this area contributes to the structural energy that is transmitted across the junction since energy that is injected farther away is already strongly attenuated when it reaches the junction. Thus the flanking sound reduction index of coupled elements with velocity decay greater than 10 dB with distance to the junction approach all a minimal common value since only a relatively small area close to the junction governs power injection and radiation. If the actual size of the elements is small and the velocity level decay less than 10 dB the flanking sound reduction index increases. Thus if tests are carried out at specimens of sufficient size – that actually depends of course on the propagation attenuation of the considered structure – a conservative estimate of the flanking sound reduction index could be obtained for prediction purposes.
Currently NRC-IRC develops with the support of industry partners an electronic best practice guide for sound transmission in wood frame buildings that are typical in North-America8. Data will be based on this conservative estimate in this guide. Planners and contractors can get with this simple tool an estimate for the direct, flanking and apparent sound transmission so far unfortunately only for a limited number of junctions and building elements. Further the change of the apparent sound insulation of the base assembly along the different transmission paths due to different mountings of the gypsum board leaves of the walls or due to adding toppings and coverings to the floors will be implemented in this guide.
REFERENCES
1. T.R.T. Nightingale and I. Bosmans, “Expressions for first-oreder flanking paths in homogeneous isotropic and lightly damped buildings”, Acta Acustica united with Acustica, 89, 110-122 (2003)
2. S. Schoenwald, “Flanking sound transmission through lightweight framed double leaf walls – Prediction using statistical energy analysis”, Ph.D.-Thesis, Bouwstenen 127, ISBN 978-90-6814-611-0, Eindhoven University Press, Eindhoven, The Netherlands (2008)
3. S. Schoenwald, T. R. T. Nightingale, E Gerretsen and H. Martin, “Application of direct method of ISO 10848 to flanking transmission through double leaf gypsum board walls,” Proceedings of
Internoise 2006, Honolulu, Hawaii (2006)
4. R.J.M. Craik, “Sound transmission through buildings using SEA”, Gower Publishing Limited, Aldershot, 1996
5. F. G. Leppington, E. G. Broadbent, K. H. Heron and S. M. Mead, “Resonant and non-resonant acoustic properties of elastic panels. ii. The transmission problem”, Proceedings of the Royal
Society of London, A 412, 309-337, (1987)
6. S. Schoenwald, B. Zeitler and T. R. T. Nightingale, “Investigation of flanking sound transmission in lightweight building structures using a scanning laser vibrometer,” Proceedings of Euronoise 2009, Edinburgh, Scotland (2009)
7. T.R.T. Nightingale, R.E Halliwell, J.D. Quirt, “On the importance of the direct field in structure borne transmission in framed construction”, Proceedings of Forum Acusticum 2005, Budapest, Hungary (2005)
8. Quirt, J.D., “Controlling air-borne and structure-borne sound in buildings,” Proceedings of