Publisher’s version / Version de l'éditeur:
Vous avez des questions? Nous pouvons vous aider. Pour communiquer directement avec un auteur, consultez la première page de la revue dans laquelle son article a été publié afin de trouver ses coordonnées. Si vous n’arrivez pas à les repérer, communiquez avec nous à PublicationsArchive-ArchivesPublications@nrc-cnrc.gc.ca.
Questions? Contact the NRC Publications Archive team at
PublicationsArchive-ArchivesPublications@nrc-cnrc.gc.ca. If you wish to email the authors directly, please see the first page of the publication for their contact information.
https://publications-cnrc.canada.ca/fra/droits
L’accès à ce site Web et l’utilisation de son contenu sont assujettis aux conditions présentées dans le site
LISEZ CES CONDITIONS ATTENTIVEMENT AVANT D’UTILISER CE SITE WEB.
12th Fire and Materials Conference 2011 [Proceedings], pp. 1-12, 2011-01-31
READ THESE TERMS AND CONDITIONS CAREFULLY BEFORE USING THIS WEBSITE.
https://nrc-publications.canada.ca/eng/copyright
NRC Publications Archive Record / Notice des Archives des publications du CNRC :
https://nrc-publications.canada.ca/eng/view/object/?id=c2f9f5bc-e7a2-499b-a703-1839f8624122 https://publications-cnrc.canada.ca/fra/voir/objet/?id=c2f9f5bc-e7a2-499b-a703-1839f8624122
NRC Publications Archive
Archives des publications du CNRC
This publication could be one of several versions: author’s original, accepted manuscript or the publisher’s version. / La version de cette publication peut être l’une des suivantes : la version prépublication de l’auteur, la version acceptée du manuscrit ou la version de l’éditeur.
Access and use of this website and the material on it are subject to the Terms and Conditions set forth at
Combustion characteristics of residential bed assemblies of various
sizes and configurations tested in a room environment
http://www.nrc-cnrc.gc.ca/irc
Com bust ion c ha ra c t e rist ic s of re side nt ia l be d a sse m blie s of va rious
size s a nd c onfigura t ions t e st e d in a room e nvironm e nt
N R C C - 5 3 5 5 8
B w a l y a , A . C . ; G i b b s , E . ; L o u g h e e d , G . D . ;
K a s h e f , A .
J a n u a r y 2 0 1 1
A version of this document is published in / Une version de ce document se trouve dans:
12th Fire and Materials Conference 2011, San Francisco, USA, January 31-Feb.
2, , 2011, pp. 1-12
The material in this document is covered by the provisions of the Copyright Act, by Canadian laws, policies, regulations and international agreements. Such provisions serve to identify the information source and, in specific instances, to prohibit reproduction of materials without written permission. For more information visit http://laws.justice.gc.ca/en/showtdm/cs/C-42
Les renseignements dans ce document sont protégés par la Loi sur le droit d'auteur, par les lois, les politiques et les règlements du Canada et des accords internationaux. Ces dispositions permettent d'identifier la source de l'information et, dans certains cas, d'interdire la copie de documents sans permission écrite. Pour obtenir de plus amples renseignements : http://lois.justice.gc.ca/fr/showtdm/cs/C-42
COMBUSTION CHARACTERISTICS OF RESIDENTIAL
BED ASSEMBLIES OF VARIOUS SIZES AND
CONFIGURATIONS TESTED IN A ROOM
ENVIRONMENT
Alex Bwalya, Eric Gibbs, Gary Lougheed and Ahmed Kashef
National Research Council Canada, Institute for Research in Construction, Fire Research Program Ottawa, Ontario K1A 0R6, Canada
ABSTRACT
This paper presents the results of a series of fire experiments that were conducted with residential bed assemblies in a room environment. The results provided valuable insight into the combustion behavior of bed assemblies, which in residential fires originating in bedrooms constitute the primary first-ignited items of importance. Building on a previous series of experiments with single mattresses, in which peak heat releases rates of approximately 3,800 kW were measured, this paper presents the results from subsequent experiments in which six bed assemblies were tested to study the effect of variables such as bed size (twin, double, queen, bunk bed), type of foundation (posture box and mates’ bed) and the use of a flame-resistant mattress design. The experiments revealed interesting results and showed that variations in the configuration of a bed
assembly, component materials, and the amount of polyurethane foam (PUF) contained in the assembly affected the rate of fire growth and intensity of the resulting fires, as well as the time to reach flashover conditions in the test room. Large amounts of PUF in a bed assembly resulted in under ventilated fires with as much as 30% of the combustion occurring outside of the fire room at the time of reaching the peak HRR. The HRRs of bed assemblies of various sizes and configurations ranged from 1,800 kW for a twin bed with a flame-resistant mattress and foundation, to 6,250 kW for a bunk bed assembly. Flashover times ranged from 180 s to approximately 350 s from ignition. Although the flame-resistant bed assembly reached a peak HRR approaching the flashover thresholds of the room, the hazard was significantly reduced since the peak occurred later and the total heat released was lower. The maximum temperature and heat flux recorded in the
experiments was 1,071oC and 221 kW/m2, respectively. These results were obtained during an experiment
with a queen-size bed assembly, which had a peak HRR of approximately 3,800 kW. It was also found that bed assemblies had lower peak HRRs than their corresponding mattresses possibly due to differences in fire growth rates and melt-pool formations when a foundation and bedclothes were added to form a bed assembly. Evaluation of flashover in the experiments was carried out and is discussed with typical evaluation criteria (based on temperature, heat flux and flames issuing out of the opening) as well as commonly used
correlations for predicting flashover. For the test configuration, the correlations predicted the HRR for flashover to range from approximately 1,600 to 2,100 kW.
INTRODUCTION
This paper presents the results of fire experiments conducted in a room environment with six residential bed assemblies of different sizes, including a mattress-foundation set design with improved resistant to ignition by an open flame. The experiments were carried out as part of a larger study called the
“Characterization of Fires in Multi-Suite Residential Dwellings” (CFMRD) project, which had the objective of characterizing fires in residential dwellings and ultimately developing design fires and methods for use in fire safety engineering analysis and design. The experimental scope of Phase 1 of the study involved 36 fire experiments (including the six tests discussed here) that were conducted with various residential furnishings
in a well-instrumented 16 m2 room (with dimensions 3.8 m wide x 4.2 m long x 2.4 m high) in order to
characterize the burning characteristics of individual and smaller groups of furnishings prior to conducting fully-furnished post-flashover room experiments in Phase 2 of the project. The furnishings tested included mattresses, bed clothes, bed assemblies, upholstered seating furniture, clothing arrangements, books, plastic audio/video media and storage cases, toys and a computer workstation setup. The smoke from the room was collected using a hood system in order to measure the heat release rate (HRR). The focus of this paper is on the effect bed size, configuration and other parameters on fire behaviour. A detailed report covering all the 36 experiments in Phase 1 of the study has been published elsewhere [1].
The experimental study of the fire behaviour of bed assemblies was of particular interest since a fire load survey [2] conducted during the CFMRD study revealed that bed rooms had significantly larger total fuel loads than other rooms in a dwelling, such as living rooms and kitchens. In addition, fire statistics [3] associate a large number of home fire fatalities with bedroom fires.
For the purpose of the CFMRD project, residential furnishings were divided into two broad groups: primary combustible furnishings (PCFs) and secondary combustible furnishings (SCFs). PCFs include items such as upholstered seating furniture and bed assemblies, which have long been recognized as the major combustibles that constitute the frequently-first-ignited items in many residential fires. SCFs consist of all other types of combustible contents, such as hard furniture, surface finishes (including flooring), clothing, paper and plastic articles that would be subsequently ignited at flashover and add fuel to a fire initiated by igniting a PCF. When PCFs are the first-ignited item, they are known to give rise to rapidly developing fires due to the flammability of the polyurethane foam (PUF) that is the dominant combustible constituent most often used in their manufacture. As a result, a considerable amount of research has been conducted over the last three decades to characterize their fire behavior, develop predictive methods and to reduce their flammability. Peak HRRs of PCFs are known to vary widely and values greater than 3,000 kW have been reported in the literature [4, 5]. Among the PCFs, bed assemblies have perhaps the greatest multiplicity of configurations since there are many components that can be assembled around a mattress. In addition to the variations in the mattress design, other variables include foundations and bed clothes. Available options for bed clothes include various types of mattress pads (including ones with substantial PUF content), blankets, bed sheets and comforters, sleep pillows and decorator pillows, all of which have an influence on fire development.
Much data pertaining to experiments conducted with PCFs can be found in the literature. However, some of the data has limitations such as: the experiments were conducted in open calorimeters, which may not be appropriate for use in computer modelling of room fires since it excludes room effects; the data is outdated in the face of new materials and construction styles ushered in by technological changes and fashion trends; or some pertinent details of the specimens, such as mass and material properties, are absent from the literature.
TEST SPECIMENS
Table 1 lists the six bed assemblies that were tested. All of the assemblies, except for the one used in Test 42, were made with the same type of innerspring mattress, which was purchased in three different sizes: twin, double and queen. The mattresses (except for the one used in Test 42) were manufactured with non-fire retarded polyurethane foam (approximately 60% of the total mass), independent coil springs, polyester fibre batts and a synthetic cover fabric (35% polyamide and 47% polyester). This type of mattress was chosen based on the results of a series of experiments[6] with five different twin-size mattresses, which were selected to represent a broad range of solid foam and innerspring types that were available in the Canadian marketplace. Test 42 was conducted with a mattress and foundation set, which was compliant with the test standard for the flammability (open flame) of mattress sets (16CFR Part 1633) [7]. This mattress was an innerspring type and its construction was identical to the mattresses used in the other tests. However, the bed clothes used in Test 42 did not meet any flammability requirements.
The bed assemblies were made up as shown in the photographs in Figures 1 to 3. All of the bed assemblies used a posture box or box spring foundation placed on a 0.23 m high steel bed frame except in Test 27 (assembled with a mate’s bed foundation) and Test 32 (bunk bed assembled with out foundations; mattresses were placed directly on to the steel frame supports). In all cases, the bed clothes consisted of: 1) skirt (only for tests using a posture box foundation); 2) a quilted mattress protector; 3) a fitted sheet; 4) a flat sheet; 5) a comforter; 6) bed and decorator pillows (quantities are indicated in Table 1). The bunk bed (Figure 3) that was tested was of the so called “twin-over-double” configuration, i.e. the lower section was a double bed assembly and the upper section was a twin bed assembly, without posture boxes.
Table 1. List of tests and bed assemblies that were tested.
Test ID Size No. of Pillows Foundation / configuration Mass of Mattress (kg) Mass of foundation (kg) Total Mass (kg)1
23-SI-76 Twin 1xSP, 1xDP Posture box 18.8 16.3 40.4
27-SI-11 Twin 1xSP, 1xDP Mate’s 19.0 62.7 86.5
29-SI-12 Double 2xSP, 2xDP Posture box 27.2 19.7 53.8
31-SI-13 Queen 4xSP, 2xDP Posture box 31.6 25.0 66.2
32-SI-14 Bunk 3xSP, 3xDP None 44.5 None 56.7
42-SI-85 Twin 1xSP, 1xDP Box spring 23.8 13.5 42.5
Note: 1 Includes non-combustible mattress and foundation components, but excludes any supporting steel bed frame.
SP: Sleep pillow; DP: Decorator pillow; Bunk: stacked beds fitted one on top of the other; Mate’s: Wooden foundation with drawers.
Figure 1. Twin bed assembly (used for
Tests 23, 29, 31 and 42) Figure 2. Mate’s bed assembly
(Test 27)
Figure 3. Bunk bed assembly (Test 32)
The composition of the bed clothes was as follows:
• Bed and decorator pillows: 100% polyester cover, 100% polyester fill; • Comforter: 50% polyester / 50% cotton cover, 100% polyester fill; • Sheet set: 60% polyester / 40% cotton;
• Mattress pad: 60% polyester / 40% cotton cover, 100% polyester fill.
TEST FACILITY AND INSTRUMENTATION
Figure 4 shows a photograph of the CFMRD test room and heat release rate calorimeter, which was located inside a large fire-testing hall. A detailed description of the design of the test facility is given in a separate publication [8]. The HRR calorimeter consisted of a 6 m x 6 m square sheet-metal hood with a vertical exhaust duct having a diameter of 1.32 m. The test room was erected on a concrete slab using non-combustible materials except for the roof, which was constructed with plywood sheathing. Lightweight steel framing, using 0.152 m steel studs spaced at 0.406 m o.c, were used for the wall and ceiling assemblies. The interior walls and floor were lined with a single layer of cement board having a thickness of 0.0127 m and the
ceiling was formed with two layers of 0.0159 m thick Type-X gypsum board applied to steel furring strips, which were attached to the ceiling joists. The exterior walls were constructed with a single layer of 0.0127 m cement board.
Figure 4. CFMRD test room and heat release rate calorimeter test facility.
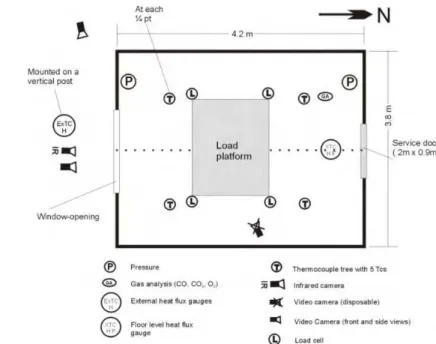
Figure 5. Floor plan of the test room showing the location of various types of instrumentation.
The interior dimensions of the test room, which were derived from survey results [9], were 3.80 m wide x
4.20 m deep by 2.38 m high, giving a floor area of 16 m2. The room was constructed so that the entire width
of the 1.5 m x 1.5 m window opening was directly under the hood, as shown in Figure 4. The theoretical ventilation-limited heat release rate for the selected window opening is approximately 4,100 kW (assuming 98% combustion efficiency) [10] and the HRR that has a potential to cause flashover is estimated to be in the range of 1,600 kW to 2,100 kW based on commonly used correlations [11-13].
Figure 5 is a plan view of the instrumentation in the CFMRD test room. Many types of instrumentation were installed in the test room, but only those relating to the results discussed in this report are described. The test room was instrumented with load cells, Gardon heat flux gauges, Type-K thermocouples (TCs) and
bi-directional velocity probes in order to take the following measurements: mass loss, total heat flux on gauges installed flush with the internal surfaces (walls and ceiling), temperatures at numerous locations and gas velocities in the window opening. Table 2 gives the coordinates of the heat flux gauges on various surfaces. Four TC trees were installed at the center of each of the floor area’s quadrants and each TC tree had five TCs suspended from the ceiling at the following heights above the floor: 0.40 m, 0.90 m, 1.40 m, 1.90 m and 2.38 m. The TC located at the 2.38 m height on the tree was attached to the ceiling.
Measurements of the mass flow rate, gas temperature and concentrations of oxygen (O2), carbon dioxide
(CO2) and carbon monoxide (CO) were taken in the vertical section of the hood exhaust duct to facilitate
calculation of the HRR by using the oxygen consumption method [14]. A pulsed white light smoke meter was installed in the exhaust duct for measuring smoke optical density.
Table 2. Co-ordinates of heat flux gauge installations on the ceiling and walls of the test room.
Ceiling South wall North wall West wall East wall
Location no. 1 (1.05, 2.85, 2.34)1 (0.00, 2.85, 1.8) (4.20, 0.95, 1.8) (3.15, 3.80, 1.8) (1.05, 0.00, 1.8)
Location no. 2 (3.15,0.95,2,34) - - - -
1
X, Y, Z co-ordinates in m (Directions: X – width; Y – length; Z – height; Origin: south-east corner)
EXPERIMENTAL PROCEDURE
The test specimens were placed on a centrally located load platform and ignited with a vertical 9 kW propane T-burner, which was applied for duration of 50 s. The T-burner was positioned at a distance of 0.47 m from the head side end of the bed as shown in Figures 6 and 7. The strength, duration and orientation of the T-burner was taken from the test standard for the flammability (open flame) of mattress sets
(16CFR Part 1633) [7], but the additional 19 kW horizontal burner specified in the test standard was deemed to be unnecessary for these experiments [1]. The data acquisition system was started 60 s before ignition in order to collect background reference data and the acquisition rate was set to 2 s. The tests were terminated after flaming had ceased.
Figure 6. Test setup showing the positioning of the T- burner system.
Figure 7. Ignition of the test specimen with the T-burner system (horizontal T-burner was not used).
RESULTS AND DISCUSSION
Effect of Bed Assembly Size and Other Parameters
Table 3 summarizes the results of experiments with various sizes of bed assemblies, including a bunk bed. The HRR and room temperature profiles are shown in Figures 8 and 9, respectively. There was a
considerably greater increase in all the measured results moving from the twin size bed assembly (Test 23) to the double bed assembly (Test 29). As well, there was greater flame extension and luminosity of the flames issuing out of the window opening in Test 29 (Figure 10) compared with Test 23 (Figure 11). All of the specimens have Gaussian-like HRR profiles, due to the accelerated rate of fire growth towards the peak HRR followed by a rapid decrease in the HRR after most of the PUF is consumed. Analysis of the results shows that the HRR began to decline after 30% to 50% of the mass of the specimen had been consumed.
Table 3. Summary of Experimental Results for Bed Assemblies of Various Sizes.
Test ID HRRmax THR ODMmax HC
mf
Q
′′
Q
mwc′′
T
∞ (kW) (MJ) (OD/m) (MJ/kg) (oC) (kW/m2) (kW/m2) (oC) 23-SI-76 (Twin) 3,358 (342)1 595 (32.5)2 1.3 18.3 891 (41)3 [942 SW]4 39 95 (37)3 [140 W wall]4 18 29-SI-12 (Double) 3,971 (257) 809 (40.7) 2.6 20.6 1,026 (21) [1,057 NE] N/A 161 (19) [189 W wall] 18 31-SI-13 (Queen) 4,000 (416) 956 (47.9) 2.7 20.0 1,052 (16) [1,071 NE] 128 166 (11) [183 W wall] 20 32-SI-14 (Bunk) 6,258 (258) 957 (38.7) 2.4 21.4 1,003 (39) [1,061 NE] 89 155 (24) [179 W wall] 241 Time to reach the peak HRR (s); 2 Mass loss (kg); 3 Standard deviation (SD); 4 Maximum room temperature / heat flux (oC / kW/m2) and its location.
THR: Total heat released; HC: Heat of combustion; ODM: optical density per meter; Compass directions - S: South East; N: North; W: West; E: East.
mf
Q′′ Maximum heat flux at floor level Qmwc′′
Mean heat flux measured at walls and ceiling surfaces
Maximum average
temperature
T
∞ Ambient temperatureFigure 8. HRR vs. time for various sizes of bed assemblies.
Figure 9. Average maximum room temperature vs. time graphs for various sizes of bed assemblies.
Time (s) 0 180 360 540 720 900 1080 Heat Re le ase Ra te ( k W ) 0 1000 2000 3000 4000 5000 6000 23-SI-76 (Twin) 29-SI-12 (Double) 31-SI-13 (Queen) 32-SI-14 (Bunk) Time (s) 0 180 360 540 720 900 1080 Te mperat ure ( o C) 0 200 400 600 800 1000 1200 23-SI-76 (Twin) 29-SI-12 (Double) 31-SI-13 (Queen) 32-SI-14 (Bunk)
Figure 10. Test 29 – Post-flashover fire with external
Comparing the peak HRRs, Test 23 was well-ventilated (below the theoretical ventilation limit of
~4,100 kW) whereas Test 29 approached the limit and hence the increase in flame extension and brightness. One of the most striking results is the extent by which the thermal radiation measured by the heat flux gauges increased. Whereas, the peak temperature rose by a modest 12%, the radiation intensity, being proportional to the fourth power of absolute temperature, increased by about 60% indicating a considerably greater increase in the potential thermal assault on the room boundaries in Test 29.
To help understand the temperature variations and stratification in the test room, Figures 12 and 13 summarize the temperature measurements from all four TC Trees in the room. In the graphs, Max-Min temperature differences in all four quadrants of the room are plotted against time. While the temperature variation in the hot gas layer was small (standard deviation less than 50 K at 1.9m height; given in Table 3), the temperatures recorded by TCs in the lower-half of the room were affected by their proximity to the window opening. The Max-Min temperature difference was largest in the southern half of the room to due to the inflow of ambient air through the window opening and the fact that the floor was non-combustible. Figures 14 and 15 show the complete temperature profiles for the TC trees in the south- and north-east quadrants, respectively, for Test 23. The graphs for Test 29 and subsequent tests discussed here had similar features.
Figure 12. Test 23 Max-Min temperature profiles Figure 13. Test 29 Max-Min temperature profiles
Figure 14. Test 23 – Temperature profiles measured by the SE TC Tree
Figure 15. Test 23 – Temperature profiles measured by the NE TC Tree.
In Test 32, the surface area and amount of PUF was increased to investigate the burning behavior of a bunk bed, which is commonly found in residential secondary bedrooms. This resulted in a considerable increase (~ 50%) in the peak HRR over Tests 29 and 31. This was clearly an under-ventilated fire with considerable smoke and external burning outside the fire compartment. The measured HRR of 6,250 kW was significantly greater than the theoretical ventilation limit of approximately 4,100 kW since only about 26% of the
combustible mass was consumed by this time compared to about 50% for the other specimens. Hence, there was still a large amount of PUF remaining to be consumed and given the large surface area and behaviour of melting plastic materials, pyrolysis continued unabated and the unconsumed fuel gases were simply
Time (S) 0 180 360 540 720 900 1080 1260 1440 1620 1800 Δ T (Max - Min) 0 100 200 300 400 500 600 700 SW (Peak temp 942 o C @ 1.9 m ) NW (Peak temp 890 o C @ 2.4 m) NE (Peak temp 941 o C @ 1.9 m ) SE (Peak temp 889 o C @ 1.9 m) Time (S) 0 180 360 540 720 900 1080 1260 1440 1620 1800 ΔT (M a x - M in) 0 100 200 300 400 500 600 700 SW (Peak temp 1012 o C @ 1.9 m ) NW (Peak temp 1016 o C @ 1.4 m) NE (Peak temp 1057 o C @ 1.9 m ) SE (Peak temp 1023 o C @ 1.9 m) Time (s) 0 180 360 540 720 900 1080 1260 1440 1620 1800 T emperat u re (º C ) 0 200 400 600 800 1000 2.4 m 1.9 m 1.4 m 0.9 m 0.4 m Time (s) 0 180 360 540 720 900 1080 1260 1440 1620 1800 T emp er at u re (º C ) 0 200 400 600 800 1000 2.4 m 1.9 m 1.4 m 0.9 m 0.4 m
transported outside the room where they underwent combustion resulting in considerably greater flame extension out of the window opening and higher peak HRR than in the other tests.
The room temperature values (and consequently heat flux) were less than those in Tests 29 and 31, which is likely due to the adverse effects of severe oxygen deficiency (and fuel-rich conditions) on combustion
efficiency. Figures
16
and17
show the Max-Min temperature profiles for Tests 31 and 32, respectively. Itcan be seen that the features of the profiles in the north half of the room are similar, but in the south half lower temperatures in lower half of the severely under ventilated fire in Test 32 caused larger Max-Min temperature differences. Analysis of temperature profiles measured by the TC Trees in the south-west quadrant for Tests 29 and 32 showed that temperatures in Test 32 were not increasing during the period that
the HRR exceeded 4,000 kW. Measurements of the O2 concentrations in the test room, at a height of 1.5 m,
indicated a severe lack of O2 in Test 32 during this period.
Figure 16. Test 31 Min-Max temperature profiles Figure 17. Test 32 Min-Max temperature profiles.
Effect of Foundation and Flame-Resistant Mattress Design
Table 15 summarizes the results of the following tests with twin-size bed assemblies: mattress with posture box foundation (Test 23); mattress with mate’s bed foundation (Test 27); and 16CFR1633-compliant (open-flame-resistant) mattress and foundation employing barrier fabric technology (Test 42). An identical set of bed clothes was used in all three experiments. The graphs of HRR and average temperature versus time are shown in Figures 18 and 19, respectively.
Table 4. Results of tests with bed assemblies using two different foundat s and an open-flame resistant mattress
and foundation set.
ion
Test ID HRRmax THR ODMmax HC
mf
Q
′′
Q
mwc′′
T
∞ (kW) (MJ) (OD/m) (MJ/kg) (oC) (kW/m2) (kW/m2) (oC) 23-SI-76 3,358 (342)1 595 (32.5)2 1.3 18.3 891 (41)3 [942 SW]4 39 95 (37)3 [140 W wall]4 18.0 27-SI-11 2,052 (398) 1,309 (N/A) 0.2 N/A 621 (67) [708 SW] 16 59 (18) [83 W wall] 14.5 42-SI-85 1,812 (574) 615 (22.1) 0.4 24.6 452 (45) [493 SW] 20 26 (8) [36 W wall] -20.01 Time to reach the peak HRR (s); 2 Mass loss (kg); 3 Standard deviation (SD); 4 Maximum room temperature / heat flux (oC / kW/m2) and its location.
THR: Total heat released; HC: Heat of combustion; ODM: optical density per meter; Compass directions - S: South East; N: North; W: West; E: East.
mf
Q′′ Maximum heat flux at
floor level. Qmwc′′ ∞
Maximum average
temperature.
T
Ambient temperature. Mean heat flux measured atwalls and ceiling surfaces.
Time (S) 0 180 360 540 720 900 1080 1260 1440 1620 1800 ΔT ( M ax - M in) 0 100 200 300 400 500 600 700 SW (Peak temp 1052 oC @ 1.9 m ) NW (Peak temp 1032 o C @ 1.9 m) NE (Peak temp 1071 o C @ 1.9 m ) SE (Peak temp 1056 o C @ 1.9 m) Time (S) 0 180 360 540 720 900 1080 1260 1440 1620 1800 ΔT ( M ax - M in) 0 100 200 300 400 500 600 700 SW (Peak temp 993 oC @ 1.9 m ) NW (Peak temp 976 o C @ 1.9 m) NE (Peak temp 1061 o C @ 1.9 m ) SE (Peak temp 980 o C @ 1.9 m)
Figure 18. HRR vs. time for Tests 23, 27 and 42.
Figure 19. Temperature vs. time for Tests 23, 27 and 42. Time (s) 0 180 360 540 720 900 1080 1260 1440 1620 1800 Heat Re le ase Ra te ( k W ) 0 500 1000 1500 2000 2500 3000 3500 27-SI-11 (Mates') 23-SI-76 (Twin) 42-SI-85 (Twin - 16CFR1633) Time (s) 0 180 360 540 720 900 1080 1260 1440 1620 1800 Te mperat ure ( o C) 0 200 400 600 800 1000 27-SI-11 (Mates') 23-SI-76 (Twin) 42-SI-85 (Twin - 16CFR1633)
The results show that the choice of foundation and use of open-flame-resistant bed components have a significant effect on fire behavior. With Test 23 as the baseline case:
• Mate’s bed (Test 27): Resulted in a much reduced and slightly delayed peak HRR (39% less than Test 23). Although the peak HRR reached 2,052 kW, the test appears to have been a borderline flashover case, with flames lightly emerging from the window opening shortly before the peak HRR was attained. The smoke density was considerably lower than in Test 23 due to the greater mass of wood and lower burning rate (Figure 20). The reduction in burning rate is due to the restriction of the burning area and air entrainment provided by the mate’s bed foundation. Melting PUF dripped into a confined space with limited air supply, and, therefore, burning was restricted to the top exposed surface (Figure 20) until the side of the mate’s bed foundation burnt through. However, by this time much of the PUF in the mattress was consumed and the decay phase followed, albeit at a slow pace due to presence of wood-based (particleboard) components.
Figure 20.Test 27 – Fire progression at ~ 300s. Figure 21. Test 42 – Fire progression at ~ 300s.
• 16CFR1633-compliant bed assembly (Test 42): Demonstrated the benefits of barrier fabric technology although the fire propagated because the bed clothes used provided a strong ignition source. The peak HRR occurred much later and its magnitude was lower than any of the experiments with bed assemblies. The photograph in Figure 21 shows the features of fire about 300s after ignition. Even though the total heat released was comparable to Test 23, it occurred over a considerably longer period of time, the decay immediately followed the peak HRR and hence lower temperatures resulted. Combustion appeared to be regulated by the rate of diffusion of flammable pyrolysis products through the barrier material and layers
of charred bed clothes. Although the peak HRR was greater than the flashover threshold (1,573 kW)
calculated using Thomas’ correlation, the temperatures were well below 600 oC, which suggests that
flashover was unlikely to have occurred. However, the peak heat flux (Table 15) at floor level reached a
value of 20 kW/m2 at 556 s, indicating that flashover was imminent based on this criterion. The fire
performance of such a mattress and foundation set could be enhanced by using bed clothes with reduced flammability, in which case peak HRRs of well under 1,000 kW can be achieved as demonstrated by the work conducted at NIST [14].
Figure 22. Test 23 Min-Max temperature profiles Figure 23. Test 27 Min-Max temperature profiles
Evaluation of Flashover Conditions
Table 5
gives the results of the assessment of flashover conditions that was carried out using threecriteria: 1) attainment of an average temperature of 600 oC in the hot layer (taken from TC Tree
measurements at a height 1.9 m); 2) attainment of heat flux reading of 20 kW/m2 at floor level; 3) visual
observations of flames issuing out of the compartment. The use of combustibles such as crumpled newspaper as flashover indicators was not employed in these experiments because the view of the floor was obscured since the window sill was about 0.9 m above the floor of the observation floor.
Three correlations were used to estimate the HRR required to cause flashover in the test room and the values obtained were: Thomas [16] – 1,600 kW; Babrauskas [17]– 2, 100 kW; MQH [18]– 1,700 kW.
The results in
Table 5
show that four of the six experiments reached and exceeded at least two of the threeflashover criteria at the indicated times. In two experiments (Tests 27 and 42), the temperature criterion was not meet although the peak HRR in these tests was greater than the lowest threshold value of about 1,600 kW. Since there were no other combustibles in the test room it is difficult to make a definite judgement.
Nevertheless, the levels of HRRs attained in these two experiments were sufficiently high to ignite adjacent combustibles, if present, or even cause flashover in smaller rooms.
The heat flux criterion (20 kW/m2 at floor level) gave longer times to flashover and does not appear to be
realistic in this case. This is indicates that its north-side location was probably not ideal for this purpose given that the results that south-side hot layer (near the window opening) had a faster rate of temperature rise then the north-side. However, the times to flashover estimated using the temperature and flame-out criteria are in good agreement although the measured HRR are substantially different given that the rate of burning was increasing rapidly after the HRR exceeded 1,000 kW. In addition, the flame-out criterion is somewhat
subjective in the absence of visual observations confirming ignition of adjacent combustibles (only possible if the room was furnished) at the same instant. Therefore, in this case the flame-out is best used to confirm the results based on the temperature criteria.
Time (S) 0 180 360 540 720 900 1080 1260 1440 1620 1800 Δ T (Max - M in ) 0 100 200 300 400 500 600 700 SW (Peak temp 942 o C @ 1.9 m ) NW (Peak temp 890 oC @ 2.4 m) NE (Peak temp 941 o C @ 1.9 m ) SE (Peak temp 889 oC @ 1.9 m) Time (S) 0 180 360 540 720 900 1080 1260 1440 1620 1800 ΔT (M a x - M in ) 0 100 200 300 400 500 600 700 SW (Peak temp 708 o C @ 2.4 m ) NW (Peak temp 570 o C @ 2.4 m) NE (Peak temp 614 o C @ 2.4 m ) SE (Peak temp 642 o C @ 2.4 m)
Table 5. Flashover analysis
Test ID Type of Bed FOC1 – 600oC
(at 1.9 m height)
FOC – 20 kW/m2 FOC – Flame-out
(Visual observation) tfo (s) HRRfo (kW) tfo (s) HRRfo (kW) tfo (s) HRRfo (kW) 23-SI-76 Twin 252 2,208 284 3,234 240 1,339
27-SI-11 Mate’s (TmaxNR 580 oC
@480s) - NR NR 425 1,517 29-SI-12 Double 211 1,762 NA NA 200 1,446 31-SI-13 Queen 326 2,107 340 2,589 315 1,895 32-SI-14 Bunk 204 2,525 276 5,824 180 1,443 42-SI-85 Twin – 16CFR1633 NR (Tmax 414 oC @ 584s) - NR - NR -
NR: Not reached; NA: Not available due to instrument malfunction or other omission; FOC: Flash over criterion: 600 oC - Average of TCs at 1.9 m; 20 kW/m2 – heat flux at floor level; Flame-out: By visual observations from the test videos
CONCLUSION
The experiments reported in this paper provided valuable insight into the effect of various types of typical configurations of bed assemblies on fire behaviour in a room environment. Four of the bed assemblies gave rise to post-flashover fires with HRRs exceeding 3,000 kW and flashover times ranged from approximately 200 s to 330 s. The heat release rate generally increases with the size for bed assemblies of similar
configuration. Double and queen size bed assemblies had significantly greater HRRs than a twin size assembly, but the difference between a double and a queen size bed assembly was marginal. In a test with a bunk bed assembly, it was found that excessive amounts of PUF resulted in lower temperatures in the test room since the fire environment became severely under-ventilated.
A test with a mate’s bed demonstrated that this type of foundation have significant effect on fire behaviour. It was found that the peak HRR was 39% lower than a bed assembly using a posture box foundation since the wooden (particleboard) base restricted the burning area and air entrainment. Although the total amount of heat released was much greater than a bed assembly with a posture box, the latter poses a more critical fire hazard given that it caused flashover to occur earlier.
A bed assembly using a mattress and foundation that was compliant with the 16CFR1633 open flame test standard was found to significantly reduce and delay the peak HRR. Although a peak HRR of 1,573 kW was
measured, the temperatures in the room were well below 600 oC indicating that flashover did not occur. If this
mattress and foundation were to be tested with bed clothes having improved combustion behavior, it is expect that the peak HRR of the bed assembly would be further reduced.
Future Work:
Some of the bed assemblies discussed in this paper will be used as first-ignited items in fully-furnished tests in simulated residential bedroom settings during Phase 2 of the project.
ACKNOWLEDGEMENTS
The authors gratefully acknowledge the financial and technical support of the following
organizations participating in the CFMRD project: Canadian Automatic Sprinkler Association, Canadian Concrete Masonry Producers Association, Canadian Furniture Manufacturers Association, Canadian Wood Council, City of Calgary, FPInnovations - Forintek Division, Gypsum Association, Masonry Worx, Ontario Ministry of Municipal Affairs and Housing, Régie du Bâtiment du Québec, Ontario Ministry of Community
Safety and Correctional Services (Office of the Fire Marshal), NRC-IRC Canadian Codes Centre and Health Canada.
The authors also acknowledge the contributions Sasa Muradori and Josip Cingel of the NRC-IRC Fire Research Program, who assisted with conducting the experiments.
REFERENCES
1. Bwalya, Alex, Lougheed, Gary, and Kashef, Ahmed, 2010, "Characterization of Fires in Multi-Suite Residential Dwellings: Phase 1 - Room Fire Experiments with Individual Furnishings", Institute for Research in Construction, National Research Council Canada, Research Report, IRC-RR-302, Ottawa, Canada.
2. Alex Bwalya, Gary Lougheed Ahmed Kashef and Hamed Saber, January, 2010, "Survey Results of Combustible Contents and Floor Areas in Canadian Multi-Family Dwellings", Fire Technology, Vol.46, No.1, p.1-20.
3. Marty Ahrens, January, 2009, "HOME STRUCTURE FIRES", NFPA Research Report. 4. Babrauskas, Vytenis, Lawson, Randall J., Walton , W. D., and Twilley, William H., 1982,
"Upholstered Furniture Heat Release Rates Measured With a Furniture Calorimeter", NBSIR 82-2604, US Dept of Commerce, National Bureau of Standards, USA.,
5. Hirschler, M. M., 2005. Full-Scale Fire Testing of Consumer Products. 10th European Meeting on Fire Retardancy and Protection of Materials (10th European Conference on Fire Retardant Polymers) (September).
6. Bwalya, A. C., Gibbs, E., Lougheed, G. D., Kashef, A., and Saber, H. H., 2009. Combustion of non-open-flame resistant Canadian mattresses in a room environment. Fire and Materials 2009: 12th International Conference , Ottawa, Canada. (January 26).
7. United States Consumer Product Safety Commission, 2008, "16 CFR 1633: Standard for the
Flammability (Open Flame) of Mattress Sets", United States Consumer Product Safety Commission, Laboratory Test Manual, USA.
8. Bwalya, Alex, Gibbs, Eric, Lougheed, Gary, Kashef, Ahmed, and Saber, Hamed, 2008, "Design of a Single-Room Heat Release Rate Calorimeter for the Characterization of Fires in Multi-Suite
Residential Dwellings Project", Institute for Research in Construction, National Research Council Canada, Research Report, IRC-RR-267, Ottawa, Canada.
9. Bwalya, Alex, Lougheed, Gary, Kashef, Ahmed, Saber, and Hamed, 2008, "Survey Results of Combustible Contents and Floor Areas in Canadian Multi-Family Dwellings", Institute for Research in Construction, National Research Council Canada, Research Report, IRC-RR-253, November, Ottawa, Canada.
10. Karlsson, Bjorn and Quintiere, James G., 2000,Enclosure Fire Dynamics, USA. : CRC Press, p. 11. Thomas, P.H. Testing Products and Materials for their Contribution to Flashover in Rooms. FIRE
AND MATERIAL. 1981, Vol. 5, pp. 103 - 111.
12. Babrauskas, V., 1980, "Estimating Room Flashover Potential ", Fire Technology, Vol.16, No.2 , p.94-103.
13. McCaffrey, Quintiere and Harkleroad. Estimating Room Temperatures and the Likelihood of Falshover Using Fire Test Data Correlations. Fire Technology. Vol 17, Issue 2, 1981.
14. Janssen, M., 1991, "Measuring Rate of Heat Release by Oxygen Consumption ", Fire Technology , August, p.234-249.
15. Ohlemiller, Thomas J., 2003, "Flammability Tests of Full-Scale Mattresses: Gas Burners versus Burning Bedclothes", Building and Fire Research Laboratory, National Institute of Standards and Technology, Gaithersburg, NISTIR 7006, July, National Institute of Standards and Technology, Gaithersburg, MD 20899-8664.
16. Damant, G., Nurbakhsh, s., and Mikami, J., 1992. Full-Scale Heat Release Rate Tests on Bedding Systems. Seventeenth International Conference on Fire Satety - Proceedings of the international conference on fire safety , Vol. 17, pp. 38-, Product Safety Corporation.