Publisher’s version / Version de l'éditeur: SAMPLE 2011, 2011-05-23
READ THESE TERMS AND CONDITIONS CAREFULLY BEFORE USING THIS WEBSITE.
https://nrc-publications.canada.ca/eng/copyright
Vous avez des questions? Nous pouvons vous aider. Pour communiquer directement avec un auteur, consultez la
première page de la revue dans laquelle son article a été publié afin de trouver ses coordonnées. Si vous n’arrivez pas à les repérer, communiquez avec nous à PublicationsArchive-ArchivesPublications@nrc-cnrc.gc.ca.
Questions? Contact the NRC Publications Archive team at
PublicationsArchive-ArchivesPublications@nrc-cnrc.gc.ca. If you wish to email the authors directly, please see the first page of the publication for their contact information.
NRC Publications Archive
Archives des publications du CNRC
This publication could be one of several versions: author’s original, accepted manuscript or the publisher’s version. / La version de cette publication peut être l’une des suivantes : la version prépublication de l’auteur, la version acceptée du manuscrit ou la version de l’éditeur.
Access and use of this website and the material on it are subject to the Terms and Conditions set forth at
PREDICTING THERMAL DEFORMATIONS DURING THE ROLL
FORMING OF THERMOPLASTIC MATRIX COMPOSITES
Lynam, C. D.; Milani, A. S.; Trudel-Boucher, D.; Borazghi, H.
https://publications-cnrc.canada.ca/fra/droits
L’accès à ce site Web et l’utilisation de son contenu sont assujettis aux conditions présentées dans le site LISEZ CES CONDITIONS ATTENTIVEMENT AVANT D’UTILISER CE SITE WEB.
NRC Publications Record / Notice d'Archives des publications de CNRC:
https://nrc-publications.canada.ca/eng/view/object/?id=b571ae0e-a93b-4ff6-aa40-b9bec3afecc0 https://publications-cnrc.canada.ca/fra/voir/objet/?id=b571ae0e-a93b-4ff6-aa40-b9bec3afecc0
PREDICTING THERMAL DEFORMATIONS DURING THE ROLL
FORMING OF THERMOPLASTIC MATRIX COMPOSITES
C.D. Lynama, A.S. Milania, D.T. Boucherb, H. Borazghic
a: School of Engineering, University of British Columbia, Okanagan Campus, BC, Canada b: Industrial Materials Institute, National Research Council, Boucherville, QC, Canada
c: AS Composite Inc, Pointe-Clare, QC, Canada
ABSTRACT
Thermal variations during the manufacturing of fibre-reinforced polymer composites can cause dimensional distortions in the final parts. Such deformations are mainly due to different thermal properties of composite constituents, as well as the interaction between mould and part during forming. During the process development of a new part, the amount of thermal deformation can be difficult to predict as it depends on several factors including the composite constituent’s material properties, the process thermal cycle and rate, the composite layup and part geometry, as well as the tooling material’s thermal properties. Currently in industry, trial and error iterations of tooling geometries and process cycles are commonly used until a correct part shape is produced. In order to reduce the time and cost associated with these iterations, this article investigates the possibility of computer modeling for predicting dimensional distortions of a Twintex thermoplastic matrix composite laminate during a custom-designed, multi-stage roll forming process.
1. INTRODUCTION
Thermoplastic matrix composites are being used in an increasing number of applications in leading industries such as aerospace, automotive and construction. Developments in fabricating the pre-consolidated composite architectures as well as new, rapid forming processes have allowed thermoplastic matrix composites to be a competitive alternative to thermoset composites. Commercial materials such as Twintex® are designed to overcome the relatively high viscosity of a thermoplastic polymer at processing temperatures. In the pre-consolidated composite, continuous glass fibers are commingled with continuous polypropylene (PP) fibers in bundles, which are then woven in to a cloth. By commingling the polypropylene and glass fibers in each yarn, diffusion distances of the matrix during processing are reduced and lower cycle times and pressure can be used. New composite manufacturing processes have also been developed which take advantage of these types of materials. Among others, roll forming is a continuous, manufacturing process which has been occasionally implemented in industrial settings [1]. In roll forming, unconsolidated sheets of a thermoplastic composite (here Twintex) are continuously passed through an oven and a series of compaction rollers, as shown schematically in Figure 1. The oven heats the material above the melting temperature of polypropylene, then several pairs of rollers compact the sheets and distribute the melted
polypropylene throughout the clo of the matrix, it consolidates in material and roll forming ma advantages over traditional therm process automation, lower cost, h ability of the material to be recy when forming thermoplastic com compounds.
Figure 1 –
Thermal deformations c matrix composites where the fina of roll forming, different that the in the form of ‘spring-in’ where than the angle of the tool. The assemblies and/or when strict dim the anisotropic thermal proper manufacturing process [3]. Th compensations on the mold (too range from 1 – 2.5o. Several itera produced within acceptable toler to the process development pha feasible. The ultimate goal of the a custom-designed multi-stage ro of tooling are needed.
1.1 Spring-in Background
As addressed above, the composite materials is their aniso subjected to during manufacturin [3]. They derived the following laminated channel sections as the
cloth. As the material cools bellow the crystalliza in to its final hard form. This thermoplastic m
anufacturing processes combination can dem rmoset matrix composites. These include higher t, higher impact toughness, simpler manufacturing
cycled [1, 2]. There are also reduced health and omposite materials, since there are no releases of
– Schematic of a roll forming arrangement.
can occur during the manufacturing process o inal part shape is different than the original tool s he shape of the final rollers set). Typically, these re the included angle between two surfaces on th hese deformations can be significant for large dimensional tolerances are required. Spring-in is perties of the composite and the thermal cy The current practice in industry is to use “ ool) shapes based on previous experience. Typica erations of tooling geometries are needed before a lerances. In turn, these tooling iterations can add a
hase of a new product and/or prevent it from b he present work is to create a predictive model of
roll forming process such that few, if any, trial an
e primary mechanism that leads to the spring-in isotropy of thermal properties and the thermal cyc ring. This mechanism was first described by O’N ng equation to predict the distortions produced in
hey cool:
ization temperature matrix composite monstrate several production rates, ng process, and the nd safety concerns of volatile organic
s of thermoplastic shape (in the case e deformations are the part is smaller ge components, in is primarily due to cycle during the “rule of thumb” ical compensations a final part can be d a significant cost being financially of the spring-in for and error iterations
in of thermoplastic cycles that they are ’Neil et al. in 1988 in the molding of
(1)
where 0 is the initial part angle, p and t are the in-plane and through-thickness coefficients of
(linear) thermal expansion, respectively, T is the difference between the crystallization temperature and room temperature, and is the spring-in angle. The equation has been developed by solving the governing equations of elasticity for an orthotropic, linear thermoelastic solid in conjunction with appropriate boundary conditions for a curved section that is free to deform (zero stress solution). It gives the change in the angle between any two cross sectional normals (centre line of the laminate) and is the primary driving force for spring-in.
In 1991, Barnes et al. [4] noted that with the development of manufacturing processes with higher forming and cooling rates, such as stamping, the induced dimensional distortions do not necessarily follow the simple form described by O’Neill et al. [3]. They investigated the effects of different cooling rates and asymmetric thermal distributions on the final spring-in deformations and identified the presence of residual stresses. Most significantly, Barnes et al. [4] discussed a number of secondary mechanisms that can lead to the final part shape being different than what is predicted by Equation 1. These secondary mechanisms include: asymmetric thermal gradients through the thickness, local matrix rich regions and stress relaxation of constrained components.
Equation 1 is very similar to that of the Radford model [5], which is commonly used in predicting spring-in angles for thermoset matrix composites. The Radford model assumes that spring-in is only due to the anisotropic thermal properties and the matrix cure shrinkage. In the case of thermoplastic matrix composites, since there is no cure, crystallization shrinkage would take the place of cure shrinkage. However, since spring-in development will not occur until the crystallization point, crystallization shrinkage is often neglected from spring-in angle predictions [6].
Recent efforts for thermoplastic spring-in predictions have been to build computational finite element models which can incorporate more of the secondary mechanisms. The advantage of finite element based models over closed-form analytical solutions is that they can more conveniently capture the effect of anisotropic thermal properties, asymmetric thermal gradients, temperature dependant thermal expansion properties, as well as the tool and part interactions. There have also been several efforts to establish numerical models that can capture the effect of stress relaxations in composite laminates due to constraints with the tooling. Examples of such efforts include the work of Sunderland et al. [7] and Kim et al. [8]. Their models use a coupled thermo-viscoelastic constitutive material behaviour to track the viscoelastic stress relaxation process. Their developed finite element code was applied to a compression molding process and modeled the intermediate part of the cooling cycle, when the laminate is constrained in the mold, as a thermoviscoelastic material. The final part of the cooling cycle, when the mold constraint is removed, was modeled as a thermoelastic material. Kim et al. [8] found that with fast cooling rates, the thermoviscoelastic model gives a similar prediction to Equation 1. At slower cooling rates, however, Sunderland et al. [7] showed that the stress relaxation mechanism becomes more significant. ) )( ( 0 t − p Ts −T = ∆θ θ α α
2.1 A Multi-Stage Roll Formin
The geometry of the exam forming machine at AS Compo Figure 1 and consists of an upp and two pairs of forming roller Twintex material in to V-shap compaction rollers are 450 mm based on their centre line. The fo The gap between rolling stations work by Borazghi et al. [1]. The
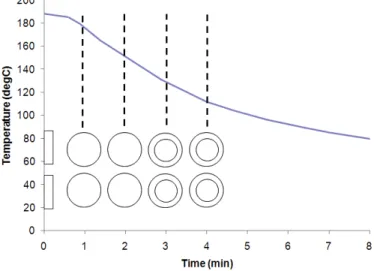
The thermal cycle used experience at AS Composites In shown in Figure 2. This is the av forming, a symmetric thermal gr laminate heats in the ovens, the m At the exit from the oven, as the than the core.
Figure 2 –Laminate temperatur
3. MAT
3.1 Differential Scanning CaloDifferential scanning calo of the matrix material during the used to measure the transition of crystalline structure. This transit
2. EXAMPLE CASE
ing Processample case used in this work is based on a custo posite Inc. The machine arrangement is schema pper and lower convection oven, two pairs of co lers. The machine is designed to form two laye aped channels. The initial laminate width is
in diameter and 100 mm wide and are spaced forming rollers form a V-shape profile with a 2 m
ns is optimized for a low final void content, bas e line speed is 0.5m/min.
ed in this example case is also based on pre Inc. The thermal cycle of the laminate after ex average temperature through the thickness of the l gradient is present through the thickness of the material surface temperature is hotter than the c he laminate starts to cool, the surface temperature
ure after exit from convection ovens in the examp process.
TERIAL CHARACTERIZATION
lorimetryalorimetry (DSC) was used to characterize the ch he manufacturing process outlined in Section 2. D of the polypropylene from an amorphous liquid st
sition defines when the material begins to be ab
tom-designed roll-atically shown in compaction rollers yers of 44 oz/yd2 is 100 mm. The d at 500 mm apart 2 mm inner radius. ased on a previous
revious trials and exiting the oven is e laminate. For roll e laminate. As the e core temperature. re becomes cooler ple roll-forming changing structure DSC results were structure to a semi able to build up a
thermal and mechanical history forming. As a first order thermod deviation from a constant slope in
DSC tests were performe roll forming process. By using t [1], the crystallization point cou any change to the thermal cycle point, and thus the amount of resu
Figure 3 shows the resu temperature due to “supercoolin crystallites of a minimum size w 40oC. In the temperature range thermodynamic transitions: melti two second order thermodynami repeatability of the test on four sa
Figure 3 - Differential Scannin The average of the four Typically, the (theoretical) ons intersection of two tangential lin taken as Ts in Equation 1. How kinetics and how they develop o the ‘Crystallization Index’. The matrix is melted and the structure 1 when the matrix material has c
y and is the start of spring-in development durin odynamic transition, crystallization is measured b
in a heat flow vs. temperature plot.
ed on pre-consolidated, flat samples of Twintex g the actual thermal cycle from the previously op
ould be found with confidence; however, it shou le for other processes will affect the location of th
esulting spring-in.
sults from the DSC tests where the offset of th ling” (a result of the required time to nucleate s e where crystal formations can begin growing)
ge of the test (20oC to 180oC), PP undergoes lting upon heating and crystallization upon coolin mic transitions, which can be seen at around 45oC
samples is very good as seen in Figure 3.
ing Calorimetry test results using the roll forming r samples is shown in Figure 4 for the crystalliz nset of crystallization is taken at the point lines shown in Figure 4. This onset temperatur owever, for a more complete description of th over time and temperature, we define a new stat he crystallization index (CI) is defined as equa ure is amorphous (on the right hand side of Figur completed its transition to a semi-crystalline stru
ring the composite by the amount the
ex produced by the optimized process ould be noted that the crystallization
the crystallization stable embryonic is approximately es two first order ling. There are also C and 90oC. The
ng thermal cycle. lization peak only.
t defined by the ure would then be the crystallization tate variable called ual to 0 when the ure 4) and equal to tructure (on the left
hand side of Figure 4). The trans the deviation of the crystallizatio
Figure 4 - Average crystallizatio and B show the start and e
The curve in Figure 5 is f the constant slope line and the ob by the total area between points A crystalline matrix structure (cry discontinuity of the first derivati be noted that a crystallization in refers to the degree of crystalliz Secondary transitions can also af we are primarily interested in the hold stress history.
Figure 5 – The crystallization in
CI=1
nsition from a crystallization index of 0 to 1 is the ion peak from a constant slope line.
tion peak for Twintex and the roll forming thermal d end of the primary crystallization transition, resp s found based on Figure 4 by taking the accumula observed deviation for any given temperature, and
s A and B. Therefore, the transition from an amor rystallization index 0 to 1) in Figure 5 is defin ation of the heat flow curve with respect to tempe
ndex of 1 does not imply a fully crystalline stru llization reaching its maximum at the end of the affect the degree of crystallization but in the con the first point during cooling when the matrix sta
index for the Twintex samples based on the roll f cycle.
CI=0
B
A
then mapped using
al cycle (points A spectively).
lated area between nd then dividing it orphous to a semi-ined based on the perature. It should tructure. Rather, it the first transition. ontext of spring-in, starts being able to
4
4.1 GeometryA two dimensional (2D) ABAQUS/Standard. A 2D mode of the laminate transverse to the state line speed, a correlation ma analysis time. The temperature temperature at any position along be defined as a function of the an (rolling) direction.
In order to simulate the c 2D model, two analytical rigid w and one bellow the laminate. The and then release. More precisely point in the analysis where the process. They are held until the rollers. This (equivalent) modeli time period between the first an forming stages, the laminate is fr the laminate in the rolling directi to the laminates’ own mass. The be captured with the aforement significant effect on the final spr the crystallization of the matrix o constrained to its 90o V-shape (to
Figure 6 – The 2D model geom rigid body
4. SIMULATION MODEL
D) approximation of the roll forming process del significantly reduces the simulation time. It co he rolling direction. Once the process reaches a
ay be made between distances along the roll form re distribution also reaches a steady state cond
ng the production line is constant. The temperatu analysis time and correlated to a given position in
composite sheet passing through a pair of form d wires were defined to represent the forming ro
he wires close on to the laminate, are held for the ly, the analytical rigid wires are closed on to the he laminate enters the first pair of forming rolle he point at which the laminate exits the second eling approach restricts any deformation of the and the exit forming stages. In the real process, free from tool contact. It is however not free to de
ction maintains a V-like-shape with some sag or e latter deformation between the two roll formi entioned 2D model. Nevertheless, it is not exp pring-in angle prediction since in the process und x occurs around the last forming roller stage whe (to be discussed further in Section 5).
metry showing cross section of the laminate and u dy surfaces representing the forming rollers.
s is established in considers a section (constant) steady rming line and the ndition where the ture cycle can then in the longitudinal
ming rollers in the rollers; one above he contact duration the laminate at the llers in the actual nd pair of forming e laminate for the s, between the two deform: tension in or deformation due ing stages cannot xpected to have a nder consideration, hen the laminate is
4.2 Boundary Conditions
The predefined fields fun laminate based on Figure 2. Mea experiments indicated a small (~ mentioned in Section 2.1, once th core temperature. Subsequently, the surface temperature is lower gradient is a result of the directio the following temperature bound cooling, the surface temperature The gradient is then applied ove distribution at room temperature
Figure 7 – Relative tempe
Figure 8 – The roll forming th
unction in ABAQUS was used to define the ther easurements of the core and surface temperatures (~2%) thermal gradient through the thickness of the laminate is heated, the surface temperature i as the laminate cools down, the thermal profile er than the core temperature. This small through-t
tion of heat flow in to or out of the laminate. In th ndary condition was defined to reflect the abov re was taken as 98% of the core temperature as sh ver the entire thermal cycle as shown in Figure 8
is reached.
perature distribution through the thickness of the
hermal cycle used in the simulation model as the boundary condition.
ermal cycle of the s during previous of the laminate. As is higher than the ile changes so that thickness thermal the current model, ove gradient: upon shown in Figure 7. 8 until a uniform
e laminate.
4.3 Material Properties
In order to model the ma model must be able to describe through crystallization. Section crystallization of the Twintex sa model the change of the matrix crystallization index (CI). In the twice. At a CI of zero, very low the stiffness of the laminate is es orthotropic, temperature depend consolidated samples. The trans USDFLD user-defined subrouti magnitude of the material proper A thermal mechanical an thermal expansion properties of expansion of four samples as a fu
Figure 9 - Through-thickn
4.4 Results
The simulation model res the crystallization index develop thickness of the laminate, crystal is very interesting to note where (shown in Figure 10). The therm current model were based on prev quality final parts. The simulatio successful at positioning the cry Figure 10 shows that no crystalli This allows the laminate to be de
manufacturing process of a thermoplastic compos be the change in the microstructure of the matri
n 3.2 discussed how the DSC test was used to samples subjected to the roll forming thermal c
x material microstructure, a new state variable wa he ABAQUS model, the relevant material prope w mechanical properties are used (i.e., when the m essentially zero). At a CI of one, the material is ndant properties are defined based on mechanic nsition from a CI of zero to one is defined in F utine. At temperatures within the crystallizatio
erties is found based on the value of the crystalliz analyzer (TMA) was also used to measure the th
f the material. Figure 9 shows the average coeff function of temperature.
kness coefficient of thermal expansion of the test
esults are summarized in Figures 10 and 11. Figu lops over time. Due to the thermal gradient pre tallization starts at the surface and progresses tow re the crystallization process occurs relative to th ermal cycle and roll forming set-up that were us
revious trial and error iterations at AS Composites tion model shows that these trial and error iterati crystallization transition at the correct point in
llization occurs before the laminate enters the fir deformed freely from a flat state in the compactio
osite, the material trix from the melt to characterize the cycle. In order to was defined as the perties are defined e matrix is melted, is hard and a set of ical tests on fully FORTRAN via a ion transition, the ization index. through thickness
fficient of thermal
st material.
gure 10 shows how resent through the owards the core. It the forming rollers used to define the tes to produce high ations were indeed n the process line. first forming stage. tion rollers to a
V-shape in the forming roller. If a deformation would induce elast quality of the final part. An elas the first forming roller. Also, Fig complete at the exit of the last fo thickness are at a crystallization i at the exit point. If the majority o forming stage, the formed lamin not under pressure. This could a simulation model confirms that t the process line (i.e., almost entir Figure 11 shows the sprin in until the exit of the lamina crystallization transition occurs b deformation at the exit due to deformation is small at only 0.05 angle notably increases until its f
Figure 10 – The temperature a majority of the matrix crystalliza the CI is a T e m p e ra tu re ( d e g C )
any crystallization did occur before the first fo stic and potentially plastic deformations that co lastic return would also indicate that crystallizatio Figure 10 shows that the crystallization transition forming stage. The surface of the laminate and th
n index of unity, while the core is at a crystallizati y of the crystallization transition occurred after th inate would fall open under its own weight and also appear to be a spring-back like deformation
the crystallization transition occurs during an op rely between the two forming roller stages). ring-in development over time in the process. Th inate from the last forming stage. Since the
before this stage, there is an initial instantaneous to the release of contact stresses from the to .05o. As the laminate cools to the room temperatu s final (steady-state) value of 1.83o.
e and CI variation with time during the roll formin ization seems to occur between the forming stages
almost equal to one for the entire laminate.
Time (min)
forming roller, the could damage the tion started before on is very close to the majority of the ation index of 0.96 the exit of the last d crystallize while ion. Therefore, the optimum period in
There is no spring-e majority of thspring-e us elastic/spring-in tool. This elastic ature, the spring-in
ing process; the es; at the exit roll,
Figure 11 - Spring-in angle (in develo
This article outlined the fr of Twintex laminates. It was sho characterize the crystallization tr forming process, the simulation location in the process line. As trial and error iterations require characterize the test material by defining a general crystallizatio presented in this paper could be a was also shown that the simula though experimental validation forming manufacturing process u from the last forming stage wher develops while the laminate is un by O’Neill et al. (Equation 1).
It is worth adding that for where the laminate is constrain secondary deformation mechani stresses that develop due to the spring-in angle. Thus another f include these secondary mechani manufacturing methods. T e m p e ra tu re ( d e g C )
(in degrees) in the roll forming process; it is found lop after exiting the last forming rollers.
5. CONCLUSIONS
framework for simulating the roll forming manuf hown that differential scanning calorimetry (DSC transition of the matrix. With reference to a prev
n model was able to show crystallization to occ s a result, such simulation techniques can reduc ired to optimize new processes. Future work is
y performing DSC tests at various cooling rates a tion kinetics model. With that model, the simu e applied to any arbitrary thermal cycle and roll f lation model could be used to give spring-in an n of the predicted value remains as a future w under study, spring-in was found to develop larg ere the laminate is allowed to deform freely. Sinc unconstrained, the final spring-in value is very cl
r other manufacturing processes such as compr ined to the tool while it cools to the room tem anisms can affect the spring-in angle predictio
he constraint of the laminate can relax over tim r future work will incorporate a viscoelastic m anism, allowing more general application of the a
Time (min)
nd to primarily
ufacturing process SC) can be used to eviously optimized ccur at the correct uce the number of is planned to fully s and subsequently ulation technique l forming set-up. It angle predictions, work. In the roll rgely after the exit ince such spring-in close to that given
pression molding, temperature, other tion. In particular, time, reducing the material model to approach in other
6. REFERENCES
1. Borazghi, H., Boucher, D. T., Denault, J., & Fisa, B. (2008). Continuous Consolidation of Polypropylene/Glass Fibre Commingled Fabric. Polymers & Polymer Composites vol.16 no.1
2. Corvaglia P, Passaro A, Manni O, Barone L, Maffezzoli A. (2006) Recycling of PP-based sandwich panels with continuous fibers composite skins. Journal of Thermoplastic
Composites, Vol 19, 731–45
3. O’Neil, & Spencer. (1988). Thermally Induced Distortions in the Moulding of Laminated Channel Sections. Mathematical Engineering in Industry , 2, no.1, 65-72.
4. Barnes, J. A., Byerly, G., LeBouton, M. C., & Zahlan, N. (1991). Dimensional stability effects in thermoplastic compkites - towards a predictive capability. Composites
Manufacturing , Vol 2 No 314, 171-178.
5. Radford DW, Rennic TS. Separating sources of manufacturing distortion in laminated
composites, Journal of Reinforced Plastic Composites, vol. 19, no. 8, pp. 621–41, 2000 6. Salomi, A., Garstka, T., Potter, K., Greco, A., & Maffezzoli, A. (2008). Spring-in angle as
molding distortion for thermoplastic matrix composite. Composites Science and Technology ,
68, 3047-3054.
7. Sunderland, P., Wonjae, W., & Mhvson, J.-A. (2001). A Thermoviscoelastic Analysis of Process-Induced Internal Stresses in Thermoplastic Matrix Composites. Polymer Composites
, 22 no.5, 579-592.
8. Kim, B., Bernet, N., Sunderland, P., & Manson, J.-A. (2002). Numerical Analysis of the Dimensional Stability of Thermoplastic Composites Using a Thermoviscoelastic Approach.
Journal of Composite Materials, Vol. 36, No. 20 , 36, 2389-2403.
9. Hou, M., & Friedrich, K. (1991). Stamp Forming of Continuous Carbon Fibre / Polypropylene Composites. Composites Manufacturing , 2, 3-9.
10.Lynam, C., & Milani, A. (2010). A Viscoelastic Based Mechanisms for Improving Spring-in Angle Predictions in Compression Moulded Thermoplastic Matrix Composites. ASME 2010
International Design Engineering Technical Conference & Computers and Information in Engineering Conference. Montreal Quebec.
11.Lalit, J., & Mai, Y.-W. (1997). Stresses and Deformations Induced during Manufacturing. Part I: Theroretical Analysis of Composite Cylinders and Shells. Journal of composite
materials , 31, 672-695.
12.Lalit, L. Y., & Mai, Y.-W. (1998). Spring-in study of the aileron rib manufactured from advanced thermoplastic composite. Composites Part A , 29A, 973-979.
13.Lalit, Y.-W. M., & Paton, R. (1997). Stresses and Deformations Induced during Manufacturing. Part II: A Study of the Spring-in Phenemenon. Journal of composite
14.Johnston, A., Vaziri, R., & Poursartip, A. (2001). A Plane Strain Model for Process-Induced Deformation of Laminated Composite Structures. Journal of Composites Materials , 35
no.16, 1435-1465.
15.Dykes, R. J., Mander, S. J., & Bhattacharyya, D. (2000). Roll forming continuous fibre-reinforced thermoplastic sheets: experimental analysis. Composites: Part A , 31, 1395-1407.