Publisher’s version / Version de l'éditeur:
Energy & Fuels, 22, December 2, pp. 742-746, 2008
READ THESE TERMS AND CONDITIONS CAREFULLY BEFORE USING THIS WEBSITE. https://nrc-publications.canada.ca/eng/copyright
Vous avez des questions? Nous pouvons vous aider. Pour communiquer directement avec un auteur, consultez la première page de la revue dans laquelle son article a été publié afin de trouver ses coordonnées. Si vous n’arrivez pas à les repérer, communiquez avec nous à PublicationsArchive-ArchivesPublications@nrc-cnrc.gc.ca.
Questions? Contact the NRC Publications Archive team at
PublicationsArchive-ArchivesPublications@nrc-cnrc.gc.ca. If you wish to email the authors directly, please see the first page of the publication for their contact information.
NRC Publications Archive
Archives des publications du CNRC
This publication could be one of several versions: author’s original, accepted manuscript or the publisher’s version. / La version de cette publication peut être l’une des suivantes : la version prépublication de l’auteur, la version acceptée du manuscrit ou la version de l’éditeur.
For the publisher’s version, please access the DOI link below./ Pour consulter la version de l’éditeur, utilisez le lien DOI ci-dessous.
https://doi.org/10.1021/ef7004354
Access and use of this website and the material on it are subject to the Terms and Conditions set forth at
Nature and origin of foulant on filters in coker gas hydrotreater feed
streams
Woods, John; Kung, Judy; Xu, Zhiming; Kotlyar, Luba; Sparks, Bryan D.;
McCracken, Thomas; Wu, Xin A.
https://publications-cnrc.canada.ca/fra/droits
L’accès à ce site Web et l’utilisation de son contenu sont assujettis aux conditions présentées dans le site
LISEZ CES CONDITIONS ATTENTIVEMENT AVANT D’UTILISER CE SITE WEB.
NRC Publications Record / Notice d'Archives des publications de CNRC:
https://nrc-publications.canada.ca/eng/view/object/?id=c4d9efbf-ec74-44c3-a792-7425416e3cce https://publications-cnrc.canada.ca/fra/voir/objet/?id=c4d9efbf-ec74-44c3-a792-7425416e3cceSubscriber access provided by CANADA INSTITUTE FOR STI
Energy & Fuels is published by the American Chemical Society. 1155 Sixteenth Street N.W., Washington, DC 20036
Article
Nature and Origin of Foulant on Filters in
Coker Gas Oil Hydrotreater Feed Streams
†John R. Woods, Judy Kung, Zhiming Xu, Luba S. Kotlyar,
Bryan D. Sparks, Thom McCracken, and Xin A. Wu
Energy Fuels, 2008, 22 (2), 742-746• DOI: 10.1021/ef7004354 • Publication Date (Web): 04 December 2007 Downloaded from http://pubs.acs.org on May 1, 2009
More About This Article
Additional resources and features associated with this article are available within the HTML version: • Supporting Information
• Access to high resolution figures
• Links to articles and content related to this article
Nature and Origin of Foulant on Filters in Coker Gas Oil
Hydrotreater Feed Streams
†John R. Woods,
‡Judy Kung,
‡Zhiming Xu,
‡Luba S. Kotlyar,*
,‡Bryan D. Sparks,
‡Thom McCracken,
‡and Xin A. Wu
§National Research Council of Canada, Institute for Chemical Process and EnVironmental Technology (ICPET), Montreal Road, Ottawa, Ontario K1A 0R6, Canada, and Syncrude Canada Ltd.,
Post Office Bag 4023, Fort McMurray, Alberta T9H 3H5, Canada ReceiVed July 24, 2007. ReVised Manuscript ReceiVed September 28, 2007
Process changes in a bitumen-upgrading plant resulted in an unexpected fouling problem on the feed filters to hydrotreater units. This work was undertaken to investigate the nature of the foulant and to determine its origin. Samples of foulant were extracted directly from a filter, fractionated, and characterized by a number of complementary techniques. These results were then compared to similar data from various gas oil fractions found in the feed. We concluded that the fouling was caused by oxidation of a nitrogen-rich pyrrole fraction present in gas oils.
Introduction
Oil sands bitumen presents unique challenges to conventional upgrading processes. One problem is the presence of ultrafine or colloidal solids,1,2originating from clay and other minerals,
present in the oil sands deposit. Primary upgrading of bitumen by coking removes a large proportion of these solids by entrapment in the solid residue. However, some solids are carried over with the volatiles from the coker to downstream units, such as catalytic hydrotreaters. Such solids are collected in the catalyst beds and cause pressure drop build-up, resulting in decreased throughput and catalyst activity. Consequently, coker gas oil must be passed through fine-mesh filters prior to further processing.
Previously, these filters functioned according to design specification. However, the addition of a vacuum distillation unit required the blending of a new, heavy gas oil stream with the original combined coker gas oil. This caused a significant decrease in filter performance because of fouling by a heavy, gummy material. Operators initially coped with this problem by frequent external cleaning of the filters. Because this is not a cost-effective solution, it was deemed necessary to understand the nature and origin of this intractable foulant so that it could be effectively eliminated.
In this work, the foulant was recovered from the filter using solvents of different polarity, followed by high-performance liquid chromatography (HPLC). Several complementary, ad-vanced analytical techniques were then used to characterize the separated components. Some specific characteristic parameters
were selected to allow for a comparison with fractions present in other process streams from bitumen upgrading.3,4 This
comparative study allowed us to identify the most likely origin of the filter foulant.
Experimental Section
Samples.The filter supplied by Syncrude Research was 89 cm long and 2 cm in diameter. Prior to analysis, it was cut into several segments, each 3-10 cm long, using a pipe cutter.
Separation. Any toluene-soluble organic matter was removed by placing a filter segment in a 250 mL glass jar with a large excess of toluene and allowing it to sit overnight. By the next day, the supernatant toluene had turned dark brown, owing to dissolved hydrocarbons, designated as toluene solubles (TS). A black layer of toluene-insoluble (TI) sediments collected at the bottom of the jar. After removal of the TS solution by pipet, fresh toluene was added to the jar and again left overnight. These steps were repeated until the toluene layer was colorless and no more TI separated. The TS solutions were combined and concentrated in a vacuum oven at 80°C. The entire TI fraction was collected and dried in a vacuum oven at 80°C overnight. The filter segments were then immersed in chloroform at room temperature in an argon atmo-sphere for 1 week. Chloroform solubles (CS) were recovered from solution by evaporating the solvent in a vacuum oven at 60 °C overnight.
Analyses. A LECO CHNS-932 analyzer with a VTF-900 attachment allowed for the determination of elemental carbon, hydrogen, nitrogen, sulfur, and oxygen. The values for oxygen determined by this method are primarily organic in origin. However, inorganic oxygen may still be a minor contributor to the measured value.
Gel permeation chromatography (GPC) was used to measure the molecular weight (MW) for each sample by reference to polystyrene standards. Waters Ltd. Empower chromatography software, a model 2690 solvent management system, a 2410 refractive index detector,
†Presented at the 8th International Conference on Petroleum Phase
Behavior and Fouling.
* To whom correspondence should be addressed. E-mail: luba.kotlyar@ nrc.gc.ca.
‡National Research Council of Canada. §Syncrude Canada Ltd.
(1) Kotlyar, L. S.; Sparks, B. D.; Woods, J.; Raymond, S.; Le Page, Y.; Shelfantook, W. Distribution and types of solids associated with bitumen.
Pet. Sci. Technol. 1998, 16, 1–19.
(2) Kotlyar, L. S.; Sparks, B. D.; Woods, J.; Chung, K. Solids associated with the asphaltene fraction of oil sands bitumen. Energy Fuels 1999, 13, 346–350.
(3) Xu, Z.; Wang, Z.; Kung, J.; Woods, J. R.; Chung, K. H.; Kotlyar, L. S.; Sparks, B. D.; Wu, X. A. Separation and identification of suspended solids in coker gas oil from Athabasca bitumen. Fuel 2005, 84, 661–668.
(4) Woods, J.; Kung, J.; Pleizier, G.; Kotlyar, L.; Sparks, B.; Adjaye, J.; Chung, K. Characterization of a coker gas oil fraction from Athabasca oil sands bitumen. Fuel 2004, 83, 1907–1914.
Energy & Fuels 2008, 22,742–746
742
10.1021/ef7004354 CCC: $40.75 2008 American Chemical Society Published on Web 12/04/2007
and a column bank consisting of HR4, HR3, HR2, and HR1 Styragel columns were employed in this analysis. The analytical method used tetrahydrofuran as the mobile phase, with a flow rate of 1 mL/min at 40 °C and sample volumes of 0.1 mL at a concentration of 0.5 w/w %.
For X-ray photoelectron spectroscopy (XPS), the samples were analyzed using a Kratos Axis Ultra unit equipped with a mono-chromated Al X-ray source. Three analyses were performed on each sample to ensure reproducibility. Analyses were carried out using an accelerating voltage of 14 kV, a current of 10 mA, and an X-ray spot size of 400 × 700 µm. Compensation for charge buildup was achieved with the Axis charge balancing system. The pressure in the analysis chamber during analysis was 2.0 × 10⁻⁹
torr. High-resolution spectra were collected at a pass energy of 40 eV and peak-fitted using CasaXPS (version 2.2.107) data-processing soft-ware. Shirley background correction procedures were used as provided by CasaXPS. For high-resolution spectra, a Gaussian– Lorentzian function curve-fitting procedure was used. High-resolution analyses were calibrated to the adventitious C 1s signal, at 285 eV. Quantification was performed using sensitivity factors provided by the Scofield element library of CasaXPS.
A Nicolet Magna-IR 560 spectrometer, equipped with a MTEC 300 photoacoustic cell, recorded photoacoustic Fourier transform infrared (PA-FTIR) spectra. Identical conditions were used for each sample. All peak assignments in this work were taken from the literature.5–7
Thermogravimetric Instruments model TGA 2950 yielded ash contents by heating solids to 900°C in an oxygen atmosphere.
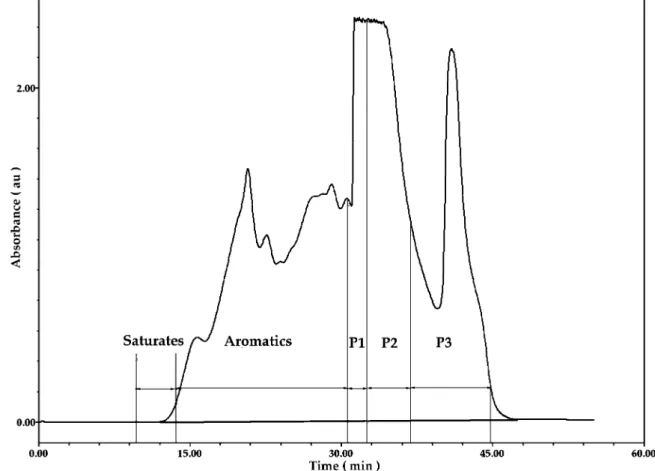
HPLC group separation was carried out using a Waters Ltd. YMC brand propylamine semipreparative column (20 × 250 mm). The Waters Ltd. chromatography system comprises a model 600E pump, a model 717 autosampler, a model 996 photodiode array detector equipped with a 3 mm semiprep cell, a model 2410 refractive index (RI) detector, and an Empower software equipped workstation. A solvent gradient, initially using hexane and changing after 25 min to methyl t-butyl ether followed by methylene chloride was used at a flow rate of 5 mL/min at 20°C. A Waters Ltd. fraction collector was connected to the outlet of the refractive index detector with wide bore polypropylene tubing. Fraction collection times accounted for the delay period of 33 s from the photodetector array sample cell to the outlet tubing of the fraction collector. A typical chromatogram is shown in Figure 1. The cut points for the three polar fractions (P1, P2, and P3) are based on previous work4using
model compounds with three, four, and five aromatic rings. While this approach did not produce the desired result, it serendipitously provided a useful tool for selectively separating highly polar fractions. After fractionation, all samples were desolventized using a Labconco Ltd. RapidVap evaporation system.
Results and Discussion
Elemental analysis of the TS fraction separated from the filter is given in Table 1. Also included for a comparison is the elemental composition of coker gas oil (GO) samples from different points in the bitumen upgrader circuit, as outlined previously.3 The results show that there are only minimal
differences between the TS separated from the filters and coker gas oil itself.
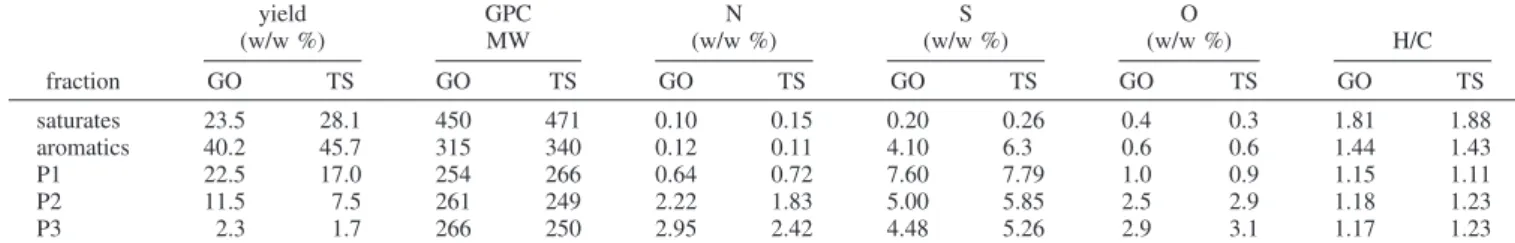
Application of a preparative HPLC separation technique to GO and the TS from the filter, allowed these materials to be separated into saturates and aromatics plus three polar fractions (P1, P2, and P3). A comparison of the yields, molecular weights, and elemental compositions for the HPLC fractions from TS
(5) Lin-Vien, D.; Colthup, N. B.; Fateley, W. G.; Grasselli, J. G. In
The Handbook of Infrared and Raman Characteristic Frequencies of Organic Molecules; Academic Press Publishers: Boston, MA, 1991; pp 485– 490.
(6) van der Marel; H. W.; Beutelspacher, H. In Atlas of Infrared
Spectroscopy of Clay Minerals and Their Admixtures; Elsevier: Amsterdam, The Netherlands, 1976; p 57.
(7) Durand, B. In Kerogen: Insoluble Organic Matter from Sedimentary
Rocks; Editions Technip: Paris, France, 1980.
Figure 1.Typical chromatogram showing cut points for fractions P1, P2, and P3.
and GO shows only marginal differences (see Table 2). This indicates that the TS material associated with the filter is essentially the same as the gas oil feed. Another important feature of the results shown in Table 2 is that the saturate and aromatic fractions from both TS and GO contain relatively insignificant amounts of nitrogen, oxygen, and sulfur heteroa-toms. However, nitrogen and oxygen contents increase rapidly with the degree of polarity, i.e., from P1 to P3.
Table 3 summarizes the yields and elemental analyses for the chloroform-soluble (CS) fraction separated from the filter. This material is primarily distinguished from the TS component by a combination of lower H/C ratio and higher elemental nitrogen, sulfur, and oxygen levels (compare Tables 1 and 3). It also follows from Table 3 that the closest matches for the nitrogen content of the CS material are fractions P2 and P3 of heavy gas oil separated by HPLC. The major differences between CS and (P2 plus P3) samples are the higher oxygen content and MW in the former case.
In Table 4, elemental compositions and ash contents of the TI material separated from the filter are compared to the equivalent data for TI extracted from various gas oil streams.3
Table 5 presents the same data calculated on an ash-free basis. Despite their disparate origins, the H/C ratios for these TI samples are quite similar and cover the narrow range of 0.86-0.96. Higher values for ash and sulfur but lower nitrogen content represent the major differences between the filter TI sample and gas oil. Such a difference may be a reflection of occlusion of gas oil fraction P1 with the filter foulant.
A comparison of the data in Tables 3 and 5 shows that the nitrogen content for the TI fractions from the filter is close to the values for the CS fraction. The data also show that the TI fraction separated from the filter has an even higher oxygen content than the already oxygen-rich CS samples. This result may be due to some contribution from inorganic oxygen in the former samples.
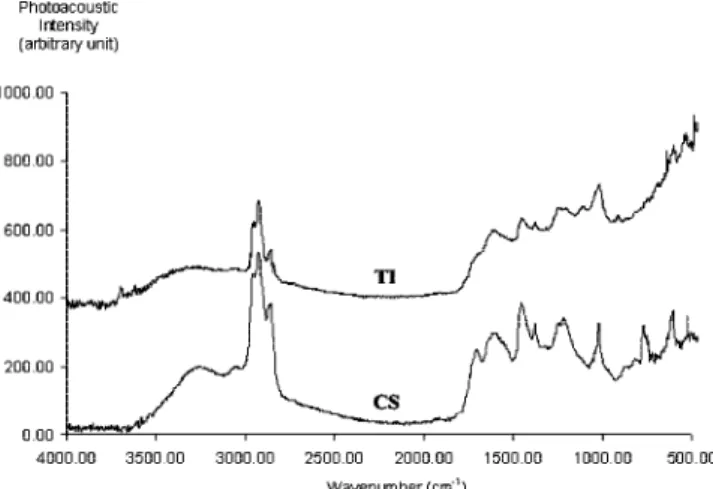
Figure 2 shows the PA-FTIR spectra for the CS and TI samples from the filter. As in the case of the polar fractions (P2 plus P3) and the TI fractions from gas oil,3a broad band
around 3400 cm-1, assigned to hydrogen-bonded O-H or N-H
stretching, is present in all spectra. Other oxygen-containing functional groups were also detected In the CS samples. The band at 1700–1705 cm-1is attributed to CdO stretching. The
bands between 1200 and 1250 cm-1 are attributed to C-O
stretching in ethers and out-of-phase C-C-O stretching of phenols. The sharp band at 1021 cm-1 may be attributed to
many possible functional groups including C-O stretching in alkyl-aryl ethers, out-of-phase C-C-O stretching of aliphatic alcohols, and SdO stretching in sulfoxides.
In the TI spectra, most of the above-mentioned bands are present in various degrees of intensity. Superimposed on these bands is a broad unresolved absorption region, extending with increasing intensity from 1710 to 930 cm-1. Oxygen-containing
functional groups are known to contribute significantly to this region. Various bands because of mineral solids, e.g., clays, are also found in this wavelength range. Peaks at 1115 and 1032 cm-1are likely attributed to Si-O and Si-O-Si in kaolinite.
The presence of kaolinite is further confirmed by the bands at 3696 and 3620 cm-1 that are characteristic of Al · · · O-H
stretching. The medium intensity peak at 911-915 cm-1
probably corresponds to Al · · · O-H bending. The detection of clay minerals in the TI fractions is in accordance with the high ash concentrations determined for these samples (see Table 4).
XPS examination of the outer 7 nm of the sample surfaces provided elemental and chemical species data. A summary of the major elements detected for various samples is given in Table 6. The estimated content for each species was based on hydrogen-free, atomic percentage data. All of the samples analyzed have similar nitrogen contents. The high values for oxygen contents in the TI sample may be due to inorganic
Table 1. Comparison of the Bulk Analysis of the TS Fraction with Typical GO
composition (w/w%)
sample C H N S O H/C
TS 83.75 10.0 0.45 4.31 1.49 1.43
GO3 80.72–84.71 10.10–11.26 0.33–0.53 3.97–4.45 0.99–1.21 1.48–1.64
Table 2. Yield, MW, and Elemental Analysis of HPLC Fractions from GO and TS Extracted from the Filter
yield (w/w %) GPC MW N (w/w %) S (w/w %) O (w/w %) H/C fraction GO TS GO TS GO TS GO TS GO TS GO TS saturates 23.5 28.1 450 471 0.10 0.15 0.20 0.26 0.4 0.3 1.81 1.88 aromatics 40.2 45.7 315 340 0.12 0.11 4.10 6.3 0.6 0.6 1.44 1.43 P1 22.5 17.0 254 266 0.64 0.72 7.60 7.79 1.0 0.9 1.15 1.11 P2 11.5 7.5 261 249 2.22 1.83 5.00 5.85 2.5 2.9 1.18 1.23 P3 2.3 1.7 266 250 2.95 2.42 4.48 5.26 2.9 3.1 1.17 1.23
Table 3. Yield, MW, and Bulk Elemental Analysis of CS Separated from the Filter
composition (w/w %) sample yield (mg/g of filter) GPC MW C H N S O H/C CS 0.42 792 73.02 6.81 2.36 9.28 6.25 1.12
Table 4. Bulk Elemental Analysis of TI from Filter and Coker Gas Oil Streams
TI source C H N S O ash (w/w %) filter 37.51 3.03 1.40 5.20 14.62 52.3 coker
gas oils3
58.7–72.5 4.4–5.6 2.6–4.1 4.2–5.7 8.9–15.1 1.6–24.0
Table 5. Bulk Elemental Analysis (Ash-Free Basis) of TI from Filter and Coker Gas Oil Streams
TI source C H N S O H/C O/C
filter 60.8 4.9 2.3 8.4 23.6 0.96 0.29
coker gas oils3 66.5–75.1 5.1–5.8 3.3–4.5 5.3–6.5 10.4–17.1 0.86–0.96 0.1–0.19
oxygen contribution. However, the actual proportion of inorganic oxygen is not clear. Although PA-FTIR data is not quantitative, it also indicates high oxygen contents in these samples.
Deconvolution of the sulfur and nitrogen envelopes in the XPS spectra provided information concerning the chemical functionalities for sulfur and nitrogen. The results are presented in Table 7. As expected from previous stream characterization work,3,4 sulfur is present primarily as the thiophenic form.
However, the key observation relates to nitrogen. The dominant nitrogen species are pyrroles, with only a small amount of pyridines being detected.8
In summary, the CS filter foulant fraction contains high concentrations of elemental oxygen and oxygenated organic species. In addition to oxygen, nitrogen content in this sample is also high. Except for the HPLC fractions (P2 and P3) from GO, no other fractions separated from the hydrotreater feed have such high nitrogen content. The H/C ratio of the P2 and P3 mixture is also close to that for the CS samples (see Tables 2 and 3). However, the oxygen content and MW of the P2 and P3 mixture is significantly lower than those for the CS fractions.
Therefore, it appears possible that the CS material is formed by oxidative polymerization of organic species present in fractions P2 and P3 in the original gas oil. This hypothesis is further supported by the fact that pyrroles, which concentrate with the CS fraction, are known to be readily oxidized to form unstable peroxides that serve as free-radical sources for other oxidative reactions.9,10These reactions generate gummy
poly-meric materials that can cause filter fouling.
The organic portion of the TI samples from the filters may originate from the same species in P2 and P3 through a similar oxidative mechanism with a higher degree of polymerization. The poor solubility of the organic part of TI material may be due to its higher MW, polarity, and adhesion to clay minerals present in the gas oil.11The elemental composition data in Table
4 also shows that the TI sample from the filter is almost identical to the same fraction from the original coker gas oil. However, the latter has very fine solid particles compared to the TI from the filter. It is possible that highly reactive pyrrole-type compounds from P2 and P3 fractions of GO form small organic particles capable of passing through the filter pores without causing a severe plugging problem, as long as they remain in this form. However, upon mixing with the heavy vacuum gas oil, these materials may undergo further oxidative polymeriza-tion, producing much larger particles bound to clays and other mineral solids. This combination could form a potent filter foulant.
As mentioned earlier, the fouling problem arose as a result of blending heavy vacuum gas oil with the original coker gas oil stream. At present, the following mechanisms are considered to be responsible for such an effect.12–14Vacuum gas oil could
supply molecular oxygen to the mixture, owing to the suscep-tibility of vacuum distillation units to air leaks. Oil-soluble iron naphthenate and naphthenic acids are practically absent in coker gas oil streams but are relatively abundant in vacuum gas oil. These components are potential catalysts for the proposed fouling reactions.
Recent results15,16showed that, while the dissolved oxygen
concentration in a sealed sample of virgin gas was below the threshold needed to support oxidation, the data did indicate that iron naphthenate was a catalyst for the fouling reactions. Replacement of mild steel components with stainless steel in the vacuum distillation unit eliminated the fouling problem by reducing corrosion because of the presence of naphthenic acids.
Conclusions
The material extracted from plugged hydrotreater feed filter comprises several components: TS,occluded gas oil; TI, particles
(8) Pels, J. R.; Kapteijn, F.; Moulijn, J. A.; Zhu, Q.; Thomas, K. M. Evaluation of nitrogen functionalities in carbonaceous materials during pyrolysis. Carbon 1995, 33, 1641–1653.
(9) Mushrush, G. W.; Speight, J. G. Instability and incompability of petroleum products. In Petroleum Chemistry and Refining; Speight, J. G., Ed.; CRC: Boca Raton, FL, 1998, and references therein.
(10) Mochida, I.; Sakanishi, K.; Fujitsu, H. Stored crude-oil sludge components identified. Oil Gas J. 1986, 58–63.
(11) Cosultchi, A.; Garciafigueroa, E.; Carcia-Borquez, A.; Reguera, E.; Yee-Madeira, H.; Lara, V. H.; Bosch, P. Petroleum solid adherence on tubing surface. Fuel 2001, 80, 1963–1968.
(12) Vadekar, M. Oxygen contamination of hydrocarbon feedstocks.
Petrol. Technol. 2002/2003, 87–93.
(13) Pickard, J. M.; Jones, E. G. Catalysis of Jet-A fuel autoxidation by Fe2O3. Energy Fuels 1997, 11, 1232–1236.
(14) Cooney, J. V.; Beal, E. J.; Beaver, B. D. Mechanisms of synfuel degradation. 3. Interactive effects in nitrogen compound induced storage instability in shale derived diesel fuel. Fuel Sci. Technol. Int. 1986, 4, 1– 18.
(15) Wu, X. A.; Chung, K. H. Determination of oxygen solubility in refinery streams with a membrane-covered polarographic sensor. Ind. Eng.
Chem. Res. 2006, 5, 3707–3710.
(16) Wu, X. A.; Chung, K. H. Hydrotreater feed filter fouling and its remedy. Energy Fuels 2006, 21, 1212–1216.
Figure 2.PA-FTIR spectra of CS and TI fractions separated from the
filter matrix.
Table 6. Surface Analysis of CS and TI Fractions from the Filter, Combined (P2 Plus P3) HPLC Fraction, and TI Fraction
from Coker Gas Oil
surface composition (atomic percent) source sample C O Si Al Fe S N filter CS 85.6 8.0 1.0 bdl 1.3 2.5 1.8 TI 76.4 15.4 0.8 bdl 1.9 3.0 2.1 gas oil P2 plus P3 88.5–91.2 4.2–5.4 bdl bdl bdl 2.0–2.1 2.0–3.1 TI 73.3–84.2 9.0–17.3 0–4.5 bdl bdl 0.7–2.3 1.9–4.1
Table 7. XPS Estimates for Sulfur and Nitrogen Species Present in CS and TI Fractions from the Filter, Combined (P2 Plus P3)
HPLC Fraction, and TI Fraction from Coker Gas Oil
weight percent of total heteroatom sulfur species nitrogen species
source sample thiophene
sulphite
plus sulfate pyridine pyrrole quaternary
filter CS 72 28 0 67 33 TI 60 40 0 70 30 gas oils P2 and P3 61–63 37–39 0 80–100 0–20 TI 73–100 0–27 17–24 59–66 14–22
composed of clays and other mineral solids bound to polar organic matter that is insoluble in organic solvents; and CS, adhesive polar organic matter bound to a stainless-steel filter element.
The polar organic matter in CS samples concentrates het-eroatoms from the gas oil. The gas oil fractions with the most similar composition are polar P2 and P3 fractions, separated using an HPLC technique. Both contain 2-3% nitrogen, primarily of the pyrrole type. This gas oil fraction probably undergoes oxidative polymerization to form the adhesive CS material that binds tenaciously to the filter elements.
Clays and other mineral solids carried over from the coker are noted for their ability to bind with polar crude oil components, thereby forming TI particles. A mixture of these organo-mineral particles and the adhesive polymers present in the CS fraction creates a highly intractable filter foulant.
Acknowledgment. The authors thank D. Kingston for his assistance with XPS analysis.
EF7004354