ANALYSIS OF STABLE SULFUR ISOTOPES AND TRACE COBALT ON SULFIDES FROM THE TAG HYDROTHERMAL MOUND
by
Carrie T. Friedman B.A. Earth Science
University of California at Berkeley, 1994
SUBMITTED TO THE MASSACHUSETTS INSTITUTE OF TECHNOLOGY AND THE WOODS HOLE OCEANOGRAPHIC INSITUTION JOINT PROGRAM IN MARINE GEOLOGY AND GEOPHYSICS IN PARTIAL FULFILLMENT OF THE
REQUIREMENTS FOR THE DEGREE OF MASTER OF SCIENCE
at the
MASSACHUSETTS INSTITUTE OF TECHNOLOGY and the
WOODS HOLE OCEANOGRAPHIC INSTITUTION February 1998
© 1998 Carrie T. Friedman. All rights reserved.
The author hereby grants to MIT and WHOI permission to reproduce paper and electronic copies of this thesis in whole or in part, and to distribute them publicly.
Signature of Author
i
Joint Program in Marine Geology and Geophysics Massachusetts Institute of Technology/Woods Hole Oceanographic Institution Certified bySusan E. Humphris Research Specialist, Marine Geology and Geophysics Thesis Co-Supervisor
Certified by , Certified bMargaret
K. Tivey Associate Scientist, Marine Chemistry and Geochemistry
/
/ Thesis Co-SupervisorAccepted by ,
Deborah Smith Chair, Joint Committee for Marine Geology and Geophysics, Massachusetts Institute of Technology/Woods Hole Oceanographic Institution
ANALYSIS OF STABLE SULFUR ISOTOPES AND TRACE COBALT ON SULFIDES FROM THE TAG HYDROTHERMAL MOUND
by
Carrie T. Friedman
Submitted to the Massachusetts Institute of Technology and the Woods Hole Oceanographic Institution on January 16, 1998 in partial fulfillment of the requirements
for the Degree of Master of Science in Oceanography
ABSTRACT
Stable sulfur isotopes (634S) and trace Co are analyzed in sulfide and sulfate minerals from six sample types collected from the TAG active mound, 260N Mid-Atlantic Ridge. 834S values range from 2.7 to 20.9%o, with sulfate minerals isotopically indistinguishable from seawater (21%o), and sulfide minerals reflecting input of-1/3 seawater and -2/3 basaltic sulfur (-0%o). Co concentrations in pyrite analyzed by ion microprobe primarily reflect depositional temperatures. The 834S and Co data are combined to provide
information regarding the sources and temperatures of parent fluids, the genetic relationships among sample types, and the circulation of hydrothermal fluids and seawater in the mound. 634S values and Co concentrations vary by sample type.
Chalcopyrite from black smoker samples exhibits invariant 834S values, indicating direct precipitation from black smoker fluids. Crust samples contain chalcopyrite with a mean 834S indistinguishable from that of black smoker samples, and pyrite with some light 834S and moderately high Co values, consistent with crust samples precipitating from cooled black smoker fluids. Massive anhydrite samples are a mixture of anhydrite with high 834S, and pyrite with variable 834S and Co values, indicative of deposition from
disequilibrium mixing between black smoker fluids and seawater. White smoker samples contain chalcopyrite and sphalerite with high 53 4S, and pyrite with low Co values,
reflecting deposition from cooler fluids formed from mixtures of seawater and black smoker fluid, with some reduction of sulfate. Mound samples contain chalcopyrite with a mean 63 4S indistinguishable from that of black smoker and crust samples, and pyrite with low Co values, suggesting deposition from a fluid isotopically similar to black smoker
fluid at temperatures similar to those of white smoker fluid. Massive sulfide samples exhibit pyrite with high 834S values and very high Co, indicating deposition from and recrystallization with very hot fluids contaminated with seawater-derived sulfate. The data demonstrate that direct precipitation from black smoker fluids, conductive cooling, disequilibrium mixing with entrained seawater, sulfate reduction, and recrystallization all contribute to the formation of the TAG mound deposit. The successful preliminary Co analyses demonstrate that ion microprobe analyses are a viable technique for measuring trace elements in sulfides.
Table of Contents
Chapter 1. Introduction and Background... ... 5
Section 1. Introduction... ... 5
Figures 1, 2, 3... ... 8
Section 2. The TAG Active Mound...10
Geologic Setting... ... ... 10
Previous Studies ... ... 11
Sample Description... ... 12
Tables 1, 2 and Figures 4, 5, 6 ... ... 14
Chapter 2. Stable Sulfur Isotopes Study ... 19
Section 1. Sulfur Isotope Analysis of Surficial Samples from the TAG Mound..19
Introduction and Background ... ... 19
M ethods...21
R esults... ... 22
Tables 3, 4, 5 and Figures 7 to 11 ... ... 24
Section 2. Factors Affecting 834S Values ... ... 30
Variations in the 634S Value of End-Member Hydrothermal Fluid...30
Seawater Entrainment ... 32
Isotopic Equilibrium ... 33
Isotopic Relationships of Coexisting Minerals ... 35
Isotopic Relationship of Black Smoker Fluids and Sulfides ... 37
Post-depositional Reworking ... ... 38
Tables 6, 7, 8 and Figure 12...39
Section 3. Interpretation of 534S Data ... ... 41
Black Smoker, Crust, and Massive Anhydrite Samples ... 41
W hite Smoker Samples... ... 44
Mound Samples ... ... 47
Figure 13 ... 52
Section 4. Summary ... ... 53
Figure 14...54
Chapter 3. Trace Cobalt Study... ... 55
Section 1. Analysis of Cobalt...55
Introduction and Background ... ... 55
M ethods ... ... 56
General Parameters ... ... 58
Development of Standards ... 58
Development of Analytical Techniques...58
R esults... ... ... 6 1 Tables 9 to 18 and Figures 15 to 22...63
Section 2. Interpretation of Cobalt Data ... ... 74
Crust and Massive Anhydrite Samples ... .... 75
White Smoker and Mound Samples ... 76
Massive Sulfide Sample... 78
Table 19 ... 80 Section 3. Summary ... 81 Chapter 4. Conclusions ... 82 Appendices... 84 A ppendix 1 ... ... 84 A ppendix 2... ... 85 R eferences ... ... 86 Acknowledgements ... 91
Chapter 1. INTRODUCTION AND BACKGROUND
Section 1. INTRODUCTION
The convection of seawater through mid-ocean ridges and ridge flanks affects heat transport, influences the chemistry of the oceans and ocean crust, and controls the
formation of seafloor massive sulfide deposits. High and low temperature reactions between seawater and crustal rock account for 25% of global heat loss (Stein and Stein,
1994) and regulate ocean chemistry on an 8-10 Myr cycle (Edmond et al., 1982). Chemical reactions modify the composition of the crust, particularly at the surface and shallow subsurface of a vent where metals leached out of crustal rock by circulating seawater can accumulate as massive sulfide deposits as great as 9 million tons
(Zierenberg et al., in press). Large seafloor sulfide deposits are believed to be the modem analogues to economic orebodies such as those in Cyprus (Constantinou and Govett, 1972).
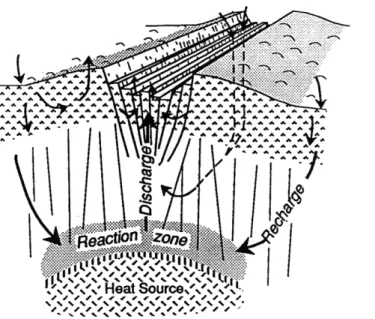
Seafloor sulfide deposits form when a heat source in the crust supplies energy that drives the circulation of seawater through oceanic rocks on both the axis and flanks of a mid-ocean ridge. Considering only processes which occur at the ridge axis, the system can be separated into recharge, reaction, and discharge zones (Figure 1). The recharge zone is defined as the zone where seawater enters permeable volcanic rocks and heats by conduction. As summarized in Figure 2 by Alt (1995), oxidizing seawater grows
increasingly hotter, and a series of water-rock reactions take place that initially fix alkalis into basalt (Seyfried and Bischoff, 1979). This is followed by uptake of Mg into basalt (Bischoff and Seyfried, 1978; Mottl, 1983) and precipitation of retrograde soluble anhydrite (Blount and Dickson, 1969; Bischoff and Seyfried, 1978), and finally mobilization of alkalis back out of basalt (Seyfried and Bischoff, 1979). As modified seawater penetrates close to the heat source and reaches temperatures >3500C, it enters the reaction zone. Here, seawater leaches metals and S out of surrounding rock (Alt,
1995; Seyfried and Bischoff, 1977) before increasing temperatures drive the buoyancy of the fluid to the point where it is hydrostatically unstable. Once the reaction zone fluid becomes unstable, it rises up through the discharge zone to the seafloor (Alt, 1995).
Ascending fluid may either pass directly through the shallow subsurface of a vent to exit at the seafloor or may undergo additional processes within the shallow subsurface prior to emission. Directly exiting fluid is termed "end-member fluid," and it is defined as the highest temperature, Mg-free hydrothermal fluid. Fluid which does not directly exit at the seafloor may mix in the shallow subsurface with entrained seawater, cool
conductively, reduce velocity, precipitate anhydrite and sulfides, or remobilize metals out of previously deposited minerals (Janecky and Shanks, 1988). These shallow subsurface processes are thought to be responsible for the formation of non-end-member fluids such as "white smoker fluid," for influencing the chemistry and size of near surface deposits, and for creating a variety of surface precipitates with diverse mineralogies and
morphologies (Koski et al., 1984; Shanks and Seyfried, 1987; Tivey et al., 1995). Shallow subsurface discharge zone processes play a major role in altering
depositional environments at the actively venting TAG hydrothermal mound on the Mid-Atlantic Ridge (Tivey et al., 1995). Cores recovered during the recent drilling of the active mound are composed of sulfide-sulfate-silica breccias and altered basalt (Figure 3; Humphris et al., 1995). The presence, in particular, of the sulfate mineral, anhydrite, in drill cores confirms that seawater has been entrained into the active mound (Humphris et al., 1995), and indicates the presence of shallow subsurface processes more complex than the simple emission of end-member fluid.
To examine the processes which affect the TAG active mound, this study combines analyses of sulfur isotopes and trace cobalt from a suite of surficial mound
samples. Sulfur isotopes can provide information on the relative contributions of
isotopically heavy seawater and isotopically light basalt to the formation of hydrothermal fluids and vent sulfides. Sulfur isotope data are useful for determining the extent of reactions between seawater and basalt, but sulfur isotopes alone do not yield a unique
solution to describe which reactions occur and in what part of a hydrothermal vent system. Additional information may be garnered through analysis of trace elements such
as cobalt. Trace elements can help characterize a source fluid and depositional conditions as well as potentially provide information on precipitation and remobilization reactions. Because the trace element analytical techniques used in this study are relatively new, the methodology is still being developed. Cobalt is the only trace element for which the analytical techniques were resolved, and, consequently, cobalt is the only trace element for which data are presented. Combined with the sulfur isotope data, the trace cobalt studies of surface precipitates can provide insight into the chemical reactions in the shallow subsurface of the TAG active mound. The aim of this study is to use the sulfur isotope and cobalt data to help identify the processes that form and modify the TAG active mound, to determine the relationships among samples, and to understand the pattern of fluid circulation inside the mound.
Figure 1. Schematization of ridge axis hydrothermal system. Hydrothermal circulation begins at recharge zones where seawater enters the ocean crust. As it progresses closer to a heat source, seawater reacts with crustal rocks. Upon entering the reaction zone, high temperature reactions produce a hydrostatically unstable, chemically evolved fluid. The buoyant fluid rises rapidly through the discharge zone and exits at the seafloor. Figure from Alt, 1995.
Recharge I
Seawater
Figure 2. Schematization of recharge zone processes Seawater enters permeable volcanic rocks and heats by conduction. As oxidizing seawater grows increasingly hotter, it fixes alkalis, then fixes Mg and precipitates anhydrite, and finally mobilizes alkalis back out of basalt. Figure from
'9U TAG 2
(B)
TAG 50m
Pyrite-silica breccia I I I
Figure 3. Cross-section of the TAG active mound showing simplified internal structure based on the results from drilling. TAG 1-5 refer to drilling sites at each of 5 locations, and letters in
brackets refer to individual holes drilled at each location. The presence of anhydrite indicates entrainment of seawater into the active mound. Figure from Humphris et al. (1995) and drawn by
Section 2. THE TAG ACTIVE MOUND
Geologic Setting
As early as the mid-1970's, surface ships started investigating the TAG area for hydrothermal activity (summary in Rona, 1980). Dives by submersible began in 1986 (Thompson et al., 1988) and made it possible to precisely document the location and morphology of seafloor sulfide samples, as well as determine whether the samples were
2 collected from an active or inactive vent. The TAG field is now known to cover a 5 km area along the floor and eastern wall of the rift valley (Rona and Von Herzen, 1996; Tivey et al., 1995), and includes the currently venting TAG active mound, relict mounds in the ALVIN and MIR zones, and an active low-temperature zone (Figure 4).
Located at 26008.2'N 44°49.6'W and 3670m depth, the TAG active mound is -200m diameter and 50m high (Thompson et al., 1988; Tivey et al., 1995). The mound is topped by a 20 m diameter, 10-20 m high cone covered with up to 15 m tall "black
smoker" chimneys termed the "black smoker complex" (Figure 5; Tivey et al., 1995; Humphris et al., 1995). Black smokers form when discharging high temperature
(>3500C) fluids mix with cold ambient seawater, depositing minerals that build
chimney-like structures composed of outer walls of anhydrite (CaSO4) and inner channels of mainly chalcopyrite (CuFeS2) (Goldfarb et al., 1983). The surface of the cone supporting
the black smoker chimneys is composed of "crust" samples, which are 2-10 cm thick platy surface layers consisting primarily of chalcopyrite and pyrite/marcasite (FeS2) and
exhibiting a porous textured underside (Tivey et al., 1995). Crusts are believed to form when the same fluid responsible for the precipitation of black smoker chimneys fails to rise rapidly to discharge at the seafloor and instead pools below the cone supporting the black smoker complex. Pooled fluid subsequently flows slowly up through debris to the surface to form crusts (Tivey et al., 1995). On the sides of the cone sit talus blocks of anhydrite and minor pyrite, called "massive anhydrite" (Tivey et al., 1995). Massive anhydrites are thought to form inside the base of the cone when entrained seawater and black smoker fluid mix, precipitating anhydrite, pyrite, and minor chalcopyrite (Tivey et
al., 1995).
Located 70m southeast of the black smoker complex, 1-2 m tall "white smoker" chimneys group in a 20-50 m diameter region named the "Kremlin area" (Thompson et al., 1988). White smoker chimneys form from lower temperature (260-300'C) fluids, and are composed dominantly of low-Fe sphalerite (ZnS) with small amounts of pyrite and chalcopyrite (Tivey et al., 1995; Edmond et al., 1995).
Much lower temperature fluids (<46°C) percolate out of many areas of the active mound (Mills and Elderfield., 1995; Mills et al., 1996; James and Elderfield, 1996). Large bulbous "mound" samples containing variable proportions of sphalerite, pyrite, and chalcopyrite all coated with a <1 to 2 mm thick outer layer of amorphous red-orange Fe-oxide are found on the mound surface (Tivey et al., 1995). These samples display neither the well developed channels of smoker samples nor the layered, planar morphology of crust samples. On the steep outer slopes of the mound are dense, unfriable "massive sulfide" samples consisting primarily of pyrite/marcasite with lesser amounts of chalcopyrite (Tivey et al., 1995). As suggested by Th/U age dates (Lalou et al., 1993) and replacement and recrystallization textures (Tivey et al., 1995), these massive sulfide samples were initially precipitated as much as 10,000 years ago and have undergone extensive post-depositional reworking.
Previous Studies
The TAG active mound has been the subject of numerous studies. Radiometric dating has constrained active venting at the TAG mound to a minimum of four pulses over the past 18,000 to 4000 years (Lalou et al., 1990; 1993). Current activity at TAG is believed to have begun in the last 50 years (Lalou et al., 1990; 1993).
Variability in activity on the TAG mound on a shorter time scale was investigated in measurements of conductive heat flow taken on and around the mound. During submersible dives in 1993, 1994, and 1995, heat flow measurements yielded extremely variable results in the region surrounding the black and white smoker areas, consistently high results on the southern and southeastern slopes of the mound and in the surrounding
complex (Becker et al., 1996). Consistently low heat flow was interpreted to indicate a zone of seawater entrainment (Becker et al., 1996). In another study, instruments emplaced on the mound surface from August 1994 to February 1995 continuously measured temperatures. Temperatures were found to fluctuate and to not always match the measurements of Becker et al. (1996), but they nevertheless supported seawater entrainment into the area of the mound (Kinoshita et al., 1996).
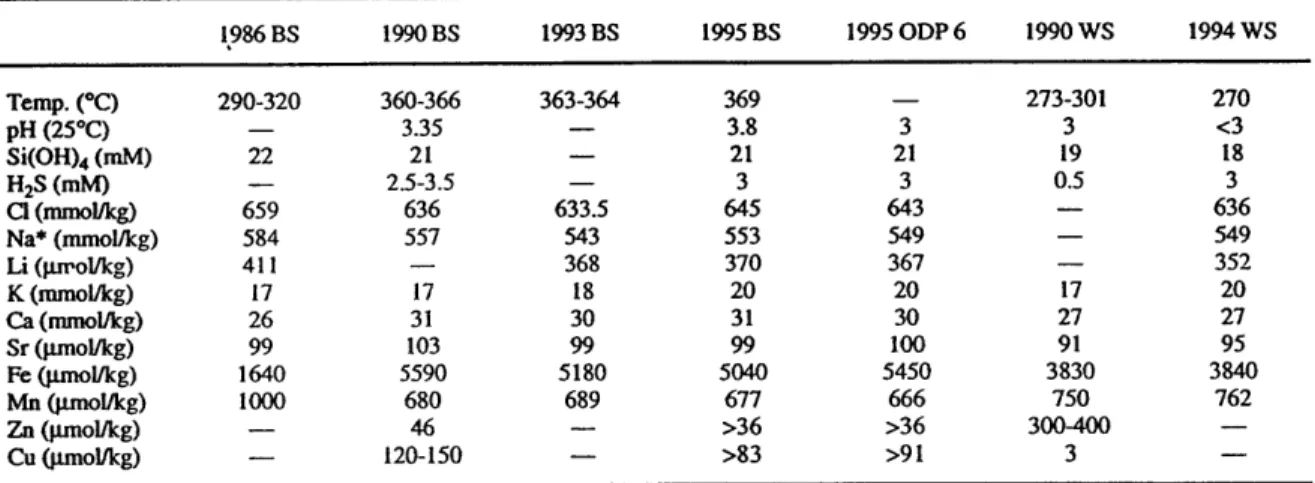
Time series studies of TAG active mound fluid samples collected in 5 years during the period 1986 to 1995 determined that end-member fluids had a major ion chemistry and pH which remained relatively constant on the order of a decade (Table 1; Edmonds et al., 1996; Gamo et al., 1996). Because there were no time series
measurements of sulfur isotopes and trace elements, it is not known whether they also remained constant in end-member fluid.
Analyses of surface precipitates formed from end-member and other fluids
indicated that chemistry varied among sample types. The mineralogy and bulk chemistry of a range of surface samples was detailed in several studies (Thompson et al., 1985,
1988; Tivey et al., 1995), and described in the previous section. Analyses of gold enrichment in white smoker deposits indicated that lower temperature white smokers fluids precipitate gold in seafloor sulfides (Hannington et al., 1995). Measurements of gold concentrations in massive sulfide samples also demonstrated that post-depositional reworking locally concentrates gold (Hannington et al., 1995).
Geochemical modeling has demonstrated that white smoker fluids can be formed from a mixture of black smoker fluid and entrained seawater, coupled with anhydrite, pyrite, and chalcopyrite precipitation and sphalerite dissolution (Tivey et al., 1995; Edmond et al., 1995). These results were supported by data from a series of 17 cores taken during Leg 158 of the Ocean Drilling Program (ODP) in 1994.
Sample Description
The method employed for classifying TAG mound surface samples is based on macroscopic texture and mineralogy, and has been adapted from Tivey et al. (1995). In this study, 4 different minerals (pyrite, chalcopyrite, sphalerite, and anhydrite) from 6
different sample types (black smoker, crust, massive anhydrite, white smoker, mound, massive sulfide) were analyzed for stable sulfur isotopes, trace cobalt, or both. Most samples were retrieved in 1990 by the U.S. submersible DSV ALVIN, with the
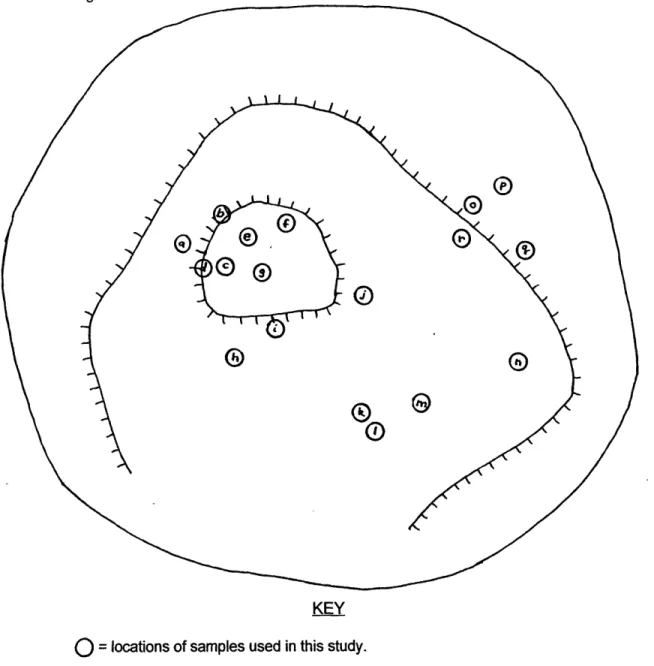
exceptions of sample ODP-6-2894 (named for ODP marker 6), which was collected by DSV ALVIN in 1995, and sample MIR2-75, which was collected by the Russian MIR submersibles in 1991. Figure 6 shows the sites from which each sample used in this study was collected. A list of all samples analyzed in this study for stable sulfur isotopes and trace cobalt is provided in Table 2.
44*51W
- Figure 4. Bathymetric map of the TAG hydrothermal field showing the currently venting TAG active mound, relict mounds in the ALVIN and MIR zones, and an active low-temperature zone.
Figure from Tivey et al. (1995) and based on Rona et al. (1993).
Figure 5. Plan view of the TAG active mound compiled from observations made during Alvin dives. Figure from Tivey et al. (1995).
26*10'N
26*09'N
26*08'N
1986 BS 1990 BS 1993 BS 1995 BS 1995 ODP 6 1990 WS 1994 WS Temp. (*C) 290-320 360-366 363-364 369 - 273-301 270 pH (25*C) - 3.35 - 3.8 3 3 <3 Si(OH)4 (mM) 22 21 - 21 21 19 18 H2S (mM) - 2.5-3.5 - 3 3 0.5 3 CI (mmol/kg) 659 636 633.5 645 643 - 636 Na* (mmol/kg) 584 557 543 553 549 - 549 Li (.rol/kg) 411 - 368 370 367 - 352 K (mmol/kg) 17 17 18 20 20 17 20 Ca (mmol/kg) 26 31 30 31 30 27 27 Sr (pmol/kg) 99 103 99 99 100 91 95 Fe (pmol/kg) 1640 5590 5180 5040 5450 3830 3840 Mn (pmol/kg) 1000 680 689 677 666 750 762 Zn (pmol/kg) - 46 - >36 >36 300-400 -Cu (gmol/kg) - 120-150 - >83 >91 3
Table 1. Time series study of TAG active mound fluid samples. BS = samples from black smoker
complex; ODP 6 = black smoker samples from ODP Marker 6; WS = white smokers. Na* is
sodium concentration calculated from charge balance. Data for 1986 and 1990 from Edmond et al. (1995). Table from Edmonds et al. (1996)
Figure 6. Location of Samples on TAG active mound., Plan view compiled from observations made during Alvin dives.
KEY
O
= locations of samples used in this study. Letters identify individual samples:a MIR2-75-5A b 2190-13 c 2180-3 d 2180-1 e 2179-1 f 2190-8 g 2178-5 h 2186-1 i 2183-9 j 2178-3 k 2190-14 I 2187-1 m 2183-4 n ODP-6-2894 o 2189-5 p 2190-6 q 2183-6 r 2190-7
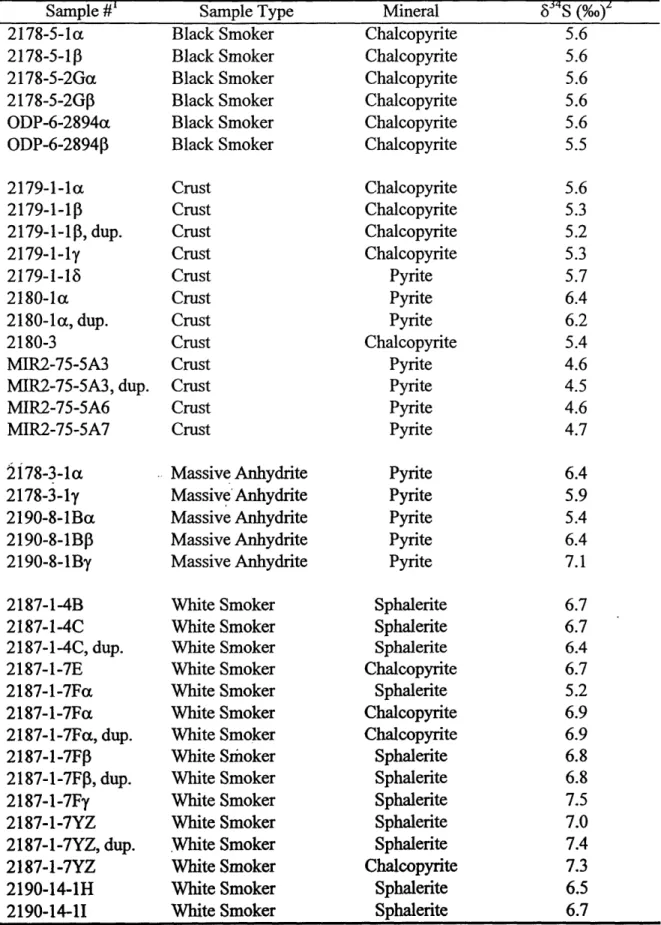
TABLE 2. List of TAG Samples Used for 834S and Trace Element Analyses
Sample # Sample Type Description of Sub-sample 2178-5-1 Black Solid base of black smoker chimney.
Smoker
2178-5-2 Black Chimney wall. Displays two independent, sub-parallel Smoker channels marked by chalcopyrite crystals
2181-1-1 Black Cross-section of chimney lined with fine grained Smoker sulfide minerals and marked by veins of anhydrite. ODP-6-2894 Black Cylindrical cross-section of chimney. Chalcopyrite
Smoker crystals mark the channel at either end. 2179-1-1 Crust Cross-section of plate-like sample. Euhedral
chalcopyrite with minor amount of pyrite and trace anhydrite. Few mm-sized pockets of cubic pyrite. 2180-1 Crust Cross-section of plate-like sample. Few mm-sized
pockets of cubic and massive pyrite.
2180-3 Crust Cross-section of plate-like sample Fine grained chalcopyrite and pyrite with trace anhydrite. MIR2-75-5A Crust Thick plate with small, convoluted channels.
Pyrite/marcasite with 10% sphalerite, <1% chalcopyrite, and trace silica.
2178-3-1 Massive Anhydrite matrix with mm to cm sized pyrite grains. Anhydrite Some euhedral, cubic pyrite.
2183-70 Massive >95% pure anhydrite, contains little sulfide. Anhydrite
2190-8-1 Massive Primarily pyrite with <10% intergrown chalcopyrite Anhydrite and traces of silica and anhydrite. Includes Icm sized
pyrite clast.
2187-1-2 White Anhydrite-rich area of sample with regions of <5% Smoker sulfide.
2187-1-4 White Light gray, porous, friable chimney cross sections. Smoker Sphalerite with 5% fine grained chalcopyrite, 1%
disseminated pyrite.
2187-1-7 White Cylindrical cross section of chimney. Both light and Smoker dark (lower and higher iron) sphalerite with trace pyrite
and silica, and variable amounts of chalcopyrite. Includes well-formed channel lined with chalcopyrite. 2190-14-1 White Light gray, porous, friable chimney cross sections.
Smoker Sphalerite with trace silica, 1% chalcopyrite, <5%
pyrite.
chalcopyrite. Few regions of dark sphalerite and few regions of fine grained chalcopyrite.
2183-9-1 Mound Large bulbous sample with red oxidized exterior, dark gray sulfide interior, and patches of white salt. Fine grained mix of sulfides with some regions of euhedral chalcopyrite.
2186-1 Mound Large bulbous sample with red oxidized exterior, dark gray sulfide interior, and patches of white salt. Mix of sphalerite, chalcopyrite, pyrite, and silica with few small strips of massive pyrite.
2190-7-1 Mound Small chunk of red oxidized exterior. Sphalerite with fine grained chalcopyrite.
2190-13-1 Mound Large bulbous sample with red oxidized exterior and dark gray sulfide interior. Sphalerite and trace pyrite with few small semi-circular patches of euhedral cubic pyrite that may mark a former channel.
2183-6-1 Massive Dense, massive pyrite with trace chalcopyrite and Sulfide sphalerite.
2189-5-1 Massive Dense, massive pyrite with some euhedral cubic Sulfide crystals. Trace chalcopyrite.
2190-6-1 Massive Dense. Fine grained pyrite with minor chalcopyrite. Sulfide
Chapter 2. STABLE SULFUR ISOTOPES STUDY
Section 1. SULFUR ISOTOPE ANALYSIS OF SURFICIAL SAMPLES FROM THE TAG MOUND
Introduction and Background
In volcanic-associated massive sulfide (VMS) deposits as old as the Precambrian,
834S analyses of sulfides have been used to infer the source of sulfur, the mechanisms of
mineralization, and the temperature, oxidation state, and pH of ore-forming fluids (Franklin et al., 1981; Ohmoto and Rye, 1979). With the recognition of the genetic relationship between seafloor hydrothermal systems and certain VMS deposits, 634S analyses of sulfides have become a powerful tool for understanding reactions and the sources of sulfur which form sulfides at seafloor hydrothermal vents.
834S values in seafloor vent deposits depend on the relative contributions of sulfur
from isotopically "heavy" seawater with 534S of +21 ±0.2%o (Rees et al., 1978) and isotopically "light" basalt with 834S of +0.3 ±0.5%o (Sakai et al., 1984; Figure 7). In organic- and sulfide-rich sedimented hydrothermal environments, sulfate-reducing bacteria can constitute an additional source of sulfur with low 834S values. For example, bacteriogenic pyrite in carbonate-cemented worm burrows at Middle Valley, Northern Juan de Fuca Ridge, yields highly negative 834S values of -19.4%o to -39.7%o
(Goodfellow et al., 1993). Non-biogenic, cubic pyrite from the same site yields the positive range of +0.1%o to +7.5%o (Goodfellow et al., 1993), which falls within the limits
set by the basalt and seawater end-members. Previous 834S analyses of seafloor hydrothermal sulfides and fluids (Table 3) show that 634S values of non-biogenic hydrothermal vent sulfides and fluids range generally from +1 to +8%o (Shanks et al.,
1995), which indicates an origin from isotopically light basalt with a lesser component
derived from isotopically heavy seawater.
The 834S values of seafloor deposits are hypothesized to be the result of a series of reactions between seawater and basalt. Beginning in the recharge zone at temperatures
<1500C, basalt contributes light sulfur into evolving seawater (Alt, 1995), decreasing the
834S value of the fluid. Once 150'C is reached, isotopically heavy anhydrite (834S ~ 21 %o) precipitates from the circulating fluid (McDuff and Edmond, 1982), further decreasing the 834S value of the fluid. In the reaction zone, most of the remaining seawater sulfate is reduced by the oxidation of basaltic pyrrhotite (FeS) to pyrite:
8FeS + 1OH+ + SO42- = 4FeS2 + H2S + 4H20 + 4Fe2+
which produces H2S with 834S values of +1 to +1.5%o (Shanks and Seyfried, 1987;
Shanks et al., 1995). Evolved fluid leaving the reaction zone and ascending through the discharge zone is hypothesized to have 834S values close to 1%o (Shanks and Seyfried,
1987; Janecky and Shanks, 1988). As shown in Table 3, 834S values of both fluids and precipitates are generally >l%o, which suggests that the fluid receives some additional input of heavy seawater sulfur while in the discharge zone.
Possible discharge zone processes which may contribute additional heavy sulfur have been modeled by Janecky and Shanks (1988). Based on the results of Shanks and Seyfried (1987) and others, the model assumes ascending hydrothermal fluid has a uniform 834S of 1%o as it enters the shallow subsurface (<500m depth) of the system. Using adiabatic mixing reactions between hydrothermal fluid (834S = 1%o) and seawater
(534S = 21%0) in both equilibrium and disequilibrium paths, the model produces fluids with 834S only as heavy as 4.5%o (Janecky and Shanks, 1988). Janecky and Shanks (1988) find that neither adiabatically mixing hydrothermal fluids nor hydrothermal fluids reacting with chimney minerals during mixing have the capacity to reduce enough sulfate in the chimney environment to produce 834S values heavier than 4.5%o. They conclude that fluid 834S values >4.5%o require reaction in the shallow subsurface between Fe2+
minerals in basalt and sulfate derived from seawater (Janecky and Shanks, 1988). These results indicate that a localized entrainment of seawater into the shallow subsurface of a vent is necessary to produce the observed range of 834S values of seafloor hydrothermal sulfides.
Seawater sulfate in the shallow subsurface of a vent can come from two sources: (1) direct mixing of vent fluid with entrained seawater, and (2) dissolution of anhydrite
that previously precipitated from entrained seawater. Using mineralogical and geochemical data and geochemical modeling, Tivey et al. (1995) discuss the internal circulation of entrained seawater and hydrothermal fluid in the TAG hydrothermal mound, and suggest that both sources of seawater sulfate are available in the shallow subsurface. In this study, the results from 834S analyses of TAG active mound fluid and mineral samples are used to constrain the seawater entrainment and shallow subsurface processes described by Tivey et al. (1995).
Methods
Minerals were carefully excavated from distinct zones in a suite of sulfide samples (see Table 2) and crushed to expose maximum surface area. Because of their fine grained, intergrown texture, samples were matched to polished thin sections
whenever possible. Specimens removed from isomineralic zones or zones shown in thin section to contain only very minor (<5%) amounts of other intergrown minerals were hand picked under a binocular microscope. After hand picking, samples containing trace
amounts of anhydrite were soaked for approximately 24 hours at room temperature in 6 M HCl to dissolve anhydrite.
Specimens containing a mixture of sphalerite and other minerals were hand picked only to remove obvious contaminants such as flakes of oxidized iron or fragments
of amorphous silica. The remainder was then subjected to chemical extraction under the guidance of W. C. (Pat) Shanks III at the U.S. Geological Survey (USGS) in Denver. Sphalerite was dissolved in 6 N HCl at 600C in a N2 flushed system. Resulting H2S was
passed through a 0.1 M AgNO3 trap, where it precipitated as Ag2S. Undissolved residues containing pure pyrite or chalcopyrite were hand picked. Residues containing impure or insufficient quantities of pyrite or chalcopyrite were not analyzed.
Both precipitated Ag2S and hand picked minerals were combusted with Cu20O at 1050'C. Resulting SO2 was purified by vacuum distillation which removed H20, CO2, and non-condensable gases. 34S/32S ratios were measured on a Nuclide Corporation mass spectrometer at the USGS Stable Isotope Laboratory in Denver. The results are
standardized relative to the Canyon Diablo troilite (CDT) and given in units of permil (%o) in conventional 534S notation:
634S = [[(34S/32S)sample - (34S/32S)standard /(34S/32S)standard] * 1000
Analytical uncertainty is ±0.2%o (lo), based on replicated preparation of duplicate samples (W. C. (Pat) Shanks, pers. comm.).
Results
Table 4 gives the results of 834S analyses for anhydrite from TAG vent deposits. The overall range is 20.0 to 20.9%o with a mean value and standard deviation of 20.6 ±0.4%o, indicative of precipitation from seawater.
834S values in sulfide samples range from 2.7 to 7.6%o (Table 5). The overall mean and standard deviation are 6.0 ±0.9%o. With the exception of the single low analysis of 2.7%o, the range of 834S values (4.5 to 7.6%o) in sulfides from the TAG active mound is higher than the range reported for sulfide minerals from any other seafloor hydrothermal site. The 634S values from black smoker samples include only one mineral type and are remarkably consistent (Figure 8). White smoker and massive sulfides tend to have higher 634S values that range 6.1 to 7.6%o, excluding one unusual low 634S value of 5.2%o (Figure 8). The four other sample types all show scatter between 2.7 and 7.1%o (Figure 8).
Examination of the data by mineral type indicates that pyrite 634S values are highly variable, and span the entire range of 2.7 to 7.6%o with a mean and standard deviation of 5.7 ±1.2%o. Chalcopyrite 634S values are much less variable and show a more limited range of 5.2 to 7.3%o, only a few high values, and an overall mean and
standard deviation of 5.5 ±0.6%o. Sphalerite 834S values are also less variable and show a limited range of generally high 83 4S values of 5.2 to 7.8%o and a mean and standard deviation of 6.4 +0.7%o.
634S values tend to cluster by sample type. For pyrite, crust samples yield a mean 834S value and standard deviation of 5.2 ±0.8%o, massive anhydrite samples yield 6.2 ±0.6%oo, mound samples yield 4.9 ±1.2%o, and massive sulfide samples yield 7.2 ±0.4%o
standard deviation of 5.6 ±0.04%o, crust samples exhibit 5.4 +0.2%o, white smoker samples exhibit 7.0 ±0.3%o, and mound samples exhibit 5.5 +0.4%o (Figure 10). The black smoker, crust, and mound samples show consistent chalcopyrite data, but the white smoker data are noticeably high. For sphalerite, white smoker samples have a mean 83 4S value and standard deviation of 6.7 ±0.6%o, and mound samples have 5.9 ±0.5%o (Figure
Figure 7: Schematic drawing of sources of sulfur for a hydrothermal vent unaffected by biogenic processes. Isotopically heavy seawater and isotopically light basalt react to produce hydrothermal fluid with a sulfur isotopic signature reflecting input from basalt with a small component of seawater.
OCEAN
~350C
hydrothermal fluid
-O°C 834S = +1%o to +8%o
seawater A 634S = +21%o RIDGE AXIS V basalt 634S = 0%o heat source
TABLE 3. Previous Studies of 634S
in Non-Biogenic Sulfides and Fluids at Hydrothermal Vents
TABLE 4. 834S Data in Anhydrite from TAG Vent Deposits
Sample #1 Sample Type 6 S (%o)L
2181-1-Ay Black Smoker 20.0
2178-3-13 Massive Anhydrite 20.6
2183-70-B Massive Anhydrite 20.7
2187-1-2 White Smoker 20.9
1Capital letters refer to pieces of a main sample; Greek letters refer to subsamples collected for sulfur isotope analysis.
2Note error on 834S values is ±0.2%o.
Location 8 S Reference
90N, +3.2 to 7.8 %o, chimney fluids Shanks et al., 1995 East Pacific Rise
110 and 13N, +2.3 to 5.2%o, chimney fluids Bluth and Ohmoto, 1988 East Pacific Rise +1.7 to 5.0%o0, chimney sulfides
210N, +1.3 to 5.5%0, chimney fluids Woodruff and Shanks, 1988 East Pacific Rise +1.5 to 4%o,chimney sulfides Zierenberg et al., 1984
Southern +4.0 to 7.4%o, chimney fluids Shanks and Seyfried, 1987 Juan de Fuca Ridge +1.6 to 5.7%o,chimney sulfides Woodruff and Shanks, 1988
Zierenberg et al., 1984 Axial Seamount, +6.1 to 7.3%o, chimney fluids Shanks et al., 1995
Juan de Fuca Ridge
Endeavour Segment, +3.8 to 6.6 %o, chimney fluids Shanks et al., 1995 Juan de Fuca Ridge
85055'W, +2.7 to 5.5%o, core from a Knott et al., 1995 Galapagos Rift sulfide boulder
MARK,230N, +4.9 to 5.0 %o, chimney fluids Campbell et al., 1988 Mid-Atlantic Ridge
290N, -0.8 to +2.4%o, all sulfides Duckworth et al., 1995-Mid-Atlantic Ridge
TABLE 5. 834S Data in Sulfides from TAG Vent Deposits Sample #' 2178-5-la 2178-5-103 2178-5-2Ga 2178-5-2G ODP-6-2894a ODP-6-28943 2179-1-la 2179-1-1 P 2179-1-1p, dup. 2179-1-1y 2179-1-18 2180-la 2180-la, dup. 2180-3 MIR2-75-5A3 MIR2-75-5A3, dup. MIR2-75-5A6 MIR2-75-5A7 2178-3-la 2178-3-1y 2190-8-1Ba 2190-8-1B 2190-8-1By 2187-1-4B 2187-1-4C 2187-1-4C, dup. 2187-1-7E 2187-1-7Fa 2187-1-7Fa 2187-1-7Fa, dup. 2187-1-7F3 2187-1-7FP, dup. 2187-1-7Fy 2187-1-7YZ 2187-1-7YZ, dup. 2187-1-7YZ 2190-14-1H 2190-14-11 Sample Type Black Smoker Black Smoker Black Smoker Black Smoker Black Smoker Black Smoker Crust Crust Crust Crust Crust Crust Crust Crust Crust Crust Crust Crust Massive Massive' Massive Massive Massive Mineral Chalcopyrite Chalcopyrite Chalcopyrite Chalcopyrite Chalcopyrite Chalcopyrite Chalcopyrite Chalcopyrite Chalcopyrite Chalcopyrite Pyrite Pyrite Pyrite Chalcopyrite Pyrite Pyrite Pyrite Pyrite Anhydrite Anhydrite Anhydrite Anhydrite Anhydrite White Smoker White Smoker White Smoker White Smoker White Smoker White Smoker White Smoker White Smoker White Smoker White Smoker White Smoker White Smoker White Smoker White Smoker White Smoker Pyrite Pyrite Pyrite Pyrite Pyrite Sphalerite Sphalerite Sphalerite Chalcopyrite Sphalerite Chalcopyrite Chalcopyrite Sphalerite Sphalerite Sphalerite Sphalerite Sphalerite Chalcopyrite Sphalerite Sphalerite 8, S (%o)L 5.6 5.6 5.6 5.6 5.6 5.5 5.6 5.3 5.2 5.3 5.7 6.4 6.2 5.4 4.6 4.5 4.6 4.7 6.4 5.9 5.4 6.4 7.1 6.7 6.7 6.4 6.7 5.2 6.9 6.9 6.8 6.8 7.5 7.0 7.4 7.3 6.5 6.7 1 T_
2190-14-1Ja 2190-14-1J[ 2190-14-1K3 2190-14-1KP 2183-4-1B 2183-4-1B 2183-4-1B, dup. 2183-9-1 2186-1Aa 2186-1Ay 2186-1A8 2186-1A8 2190-7-1A 2190-7-1A, dup. 2190-13-la 2190-13-103 2190-13-ly 2190-13-ly 2190-13-15 2190-13-16, dup. 2190-13-18 White Smoker White Smoker White Smoker White Smoker Mound Mound Mound Mound Mound Mound Mound Mound Mound Mound Mound Mound Mound Mound Mound Mound Mound Sphalerite Sphalerite Sphalerite Sphalerite Chalcopyrite Sphalerite Sphalerite Chalcopyrite Pyrite Sphalerite Pyrite Sphalerite Chalcopyrite Chalcopyrite Pyrite Pyrite Pyrite Sphalerite Pyrite Pyrite Sphalerite
2183-6-la Massive Sulfide Pyrite 7.0
2189-5-1Da Massive Sulfide Pyrite 7.0
2189-5-1Da, dup. Massive Sulfide Pyrite 6.7
2190-6-1a Massive Sulfide Pyrite 7.6
ICapital letters refer to pieces of a main sample; Greek letters refer to subsamples collected for sulfur isotope analysis.
2Note error on 634S values is ±0.2%o.
6.4 6.7 6.1 6.4 5.2 5.5 5.9 6.0 2.7 5.8 5.7 6.0 5.4 5.2 4.6 5.4 5.4 5.0 5.5 5.8 6.7
Figure 8: Symbols indicate different sample types, as shown in legend. Note that BS = black smoker, MA = massive anhydrite, WS = white smoker, MS = massive sulfide.
Figure 8. 834S Data for All Sulfides
7.5 - 6.5-a A A x a 5.5 ]
-*1.,
4.5 3.5 -2.5 xx xx x x a A%I?
* BS i Crust A MA x WS x Mound 0 MS IIn figures 9, 10, and 11: Squares plotted are the mean 534S value for the particular sample type. Bars show the range of values.
Figure 9. 834S in Pyrite by Sample Type
6..
5.
4. 5
5 Massive Anhydrite Massive Sulfide
5
SCrust Mound
5
5
--5
Figure 10. 834S in Chalcopyrite by Sample Type
White Smoker Black Smoker
SCrust Mound
Figure 11. 834S in Sphalerite by Sample Type
5-White Smoker 5 Mound 5 5 5 5 7.5 6.5 ., 5.5 CL, 4.5 3.5
Section 2. FACTORS AFFECTING 834S VALUES
The primary influence on the 634S values of sulfides from the TAG active mound is the source of sulfur. The sulfur isotope ratios for TAG sulfides depend on the relative inputs of sulfur derived from seawater sulfate reduction (-21%o) and from basalt (-O%o).
Because TAG samples do not show biogenic textures and yield 534S values which fall into the range between basalt and seawater, bacterial reduction of sulfate does not appear to be a factor in TAG sulfides.
Approximately 1/3 seawater sulfur and 2/3 basaltic sulfur combine to produce black smoker hydrothermal fluid with 834S -7%o (Table 6). The temperatures of hydrothermal fluids from the TAG active mound were measured by Edmond et al.
(1995), and the sulfur isotope ratios of these fluids were analyzed by W. C. (Pat) Shanks III (unpublished data). 834S values in H2S from 3 low Mg, black smoker fluid samples
range from 6.6 to 7.5%o (Table 6), with a mean 834S value and standard deviation of 7.2 ±0.5%o. All of the fluid samples are isotopically heavier than any of the sulfides from black smoker chimney samples and most of the sulfides from other TAG mound sample types.
The isotopic signature of the sulfides reflects the integrated effects of the isotopic composition of the source and the physical and chemical processes that can fractionate the isotopes. Isotopic fractionation depends on: (1) whether a sample attained
equilibrium with its parent fluid, (2) the mineralogy of a sample, (3) the temperature at which a mineral precipitates, and (4) post-depositional reworking with hydrothermal
fluid. To understand the relationships among samples and to identify the processes that produce their 834S values, it is necessary to determine the proportions of sulfur from the two sources and the relative importance of the processes which can fractionate sulfur
isotopes.
Variations in the 834S Value of End-Member Hydrothermal Fluid
values in samples from 110 and 130N, East Pacific Rise. Bluth and Ohmoto (1988) argue for a gradual increase in the 534S value of end-member fluid due to increased inputs of heavy seawater sulfate deep in the hydrothermal systems. Time series studies at TAG
indicate that the major element chemistry and pH of TAG black smoker fluids have been invariant over a time scale of a decade (Table 1; Edmonds et al., 1996; Gamo et al., 1996). Although a time series study of sulfur isotope ratios has not been conducted, invariability in the 83 4S values of end-member fluid over the time scale of about a decade
is suggested by the 834S data from chalcopyrite which lines the inner walls of black smoker chimneys. The 634S values are remarkably constant, even though the black smoker samples are from different parts of the mound and were collected during different years (Table 5 and Figure 6). Given the fact that the chalcopyrite which lines black smoker chimneys is believed to precipitate directly from end-member fluids, the
invariability of the chalcopyrite 834S data implies invariability in the 83 4S values of end-member fluids over the time scale of the deposition of the black smokers.
Although the uniform 834S values in chalcopyrite from black smoker chimney walls implies uniformity in the mineralizing fluid, the 834S values measured in TAG black smoker fluids are variable (Table 6). This discrepancy cannot be resolved based on the data collected in this study. To investigate the problem, transects could be analyzed for 834S values in chalcopyrite from TAG black smoker chimney walls using a
microanalytical technique such as an ion microprobe. The transects would yield 834S values as a function of distance and time, providing information regarding the temporal variability of 634S in black smoker chimneys and end-member fluids. Hydrothermal fluids exhibiting invariable chemistry yet variable 834S values have also been found at 21'N, East Pacific Rise (Table 3; Woodruff and Shanks, 1988).
Although the fluid chemistry and black smoker chalcopyrite 834S data support short-term invariability of end-member fluids, it cannot be established whether there has been variability over the entire 18,000 year history of the mound. Geochronological studies suggest hydrothermal activity has been episodic (Lalou et al., 1990; 1993), and changes in the composition of fluids are possible with each new episode. The 834S of
end-member fluids currently exiting the TAG active mound may only represent fluid which has been precipitating surface sulfides during the current episode of activity which commenced 50 years ago (Lalou et al., 1990; 1993). The fact that sulfides from other hydrothermal sites yield slightly different 834S ranges (Table 3) suggests that end-member hydrothermal fluid can have different isotopic signatures while still remaining
"end-member fluids."
A likely source for variability in 63 4S values of end-member fluids over long time scales is altered basalt. Basalt 83 4S is believed to be constant, as observed early on by Shima et al. (1963) and Smitheringale and Jensen (1963). However, B isotope data and Cs to Rb ratios suggest that in the modem TAG hydrothermal system, seawater is reacting with previously altered basalt to produce end-member fluids (Edmond et al., 1995; Palmer and Edmond, 1989). Because basalt is altered by reaction with isotopically heavy seawater, alteration can result in basalt with elevated 834S values (Alt et al., 1995), and this may explain why TAG fluids have higher 634S values than fluids from other vent sites (Table 3).
In summary, variability in the 634S of end-member fluids does not appear to explain variability in the 634S of sulfides over the short time scale of the deposition of surface samples. It is possible, however, that variability in the 834S of end-member fluids has caused variability in the 53 4S of sulfides over the entire life span of the TAG active mound deposit. A change in TAG end-member fluids over a long time scale has the greatest implication for sample types which show evidence of reworking, like massive sulfide samples.
Seawater Entrainment
The compositions of TAG active mound black smoker and white smoker fluids (Edmond et al., 1995) and the results of chemical modeling by Tivey et al. (1995) provide evidence for seawater entrainment into the mound. This is further substantiated by
drilling, which has revealed the presence of anhydrite within the mound (Humphris et al., 1995).
Evidence from other hydrothermal sites bolster the theory that seawater can be locally entrained at a hydrothermal vent. In a study of the Southern Juan de Fuca Ridge, Shanks and Seyfried (1987) concluded that seawater is entrained through the porous chimney walls of sulfide samples formed from lower velocity hydrothermal fluids. In a study of 21oN, East Pacific Rise, Woodruff and Shanks (1988) provided evidence that
seawater-derived sulfate is reduced in chimneys and in the hydrothermal mound. Also, since heavy seawater sulfate can be derived either directly from locally entrained
seawater or indirectly from previously deposited anhydrite, Woodruff and Shanks (1988) concluded that previously deposited anhydrite reduced in the "near surface feeder zone" constitutes an additional source of heavy sulfur isotopes. Shanks et al. (1995) reviewed 83 4S data from many hydrothermal sites and reaffirmed the conclusion that seawater-derived sulfate can be reduced and added to ascending fluids in the discharge zone or in the chimneys. Knott et al. (1995) used a slightly different theory to explain the role of
seawater sulfur in causing variability in samples from 85o55'W, Galapagos Rift. In addition to sulfate reduction within the deposit, Knott et al. (1995) suggested that variability in sulfide precipitates is produced by mixing of rising hydrothermal fluid in the shallow subsurface with a heavier seawater-influenced fluid of 834S = 7.7%o. Finally, chemical modeling by Bowers (1989) showed that isotopically heavy fluids required an addition of reduced sulfate close to the exit point of the fluid, as in the shallow subsurface environment of a hydrothermal mound.
Isotopic Equilibrium
The isotopic signature imparted by end-member fluid and variable amounts of entrained seawater is modified by processes which fractionate the isotopes. One such cause of fractionation is variability in the equilibrium state of a sample relative to its parent fluid. To assess whether or not a sample is in equilibrium, 834S values from at least two related minerals or fluids must be compared. "Related minerals" are
precipitates which formed from the same fluid. A "related fluid" is the parent solution from which a mineral precipitated or was post-depositionally reworked.
The 63 4S values of equilibrium related minerals and fluids differ as a function of temperature, as shown in Figure 12. For any mineral (i) and any parent fluid (H2S), the isotopic fractionation factor (a) is defined as:
ai.H2S = (34S/32S)i/(34S/32S)H2S
(Ohmoto and Rye, 1979). Using the fractionation factor, the following relationship can be solved:
834Si _ 534SH2S = 1000(Ci-H2S - 1)* [1 + (53 4SH2s/1000)] (see Appendix 1) which can be approximated as:
834Si - 834SH2S - 1000 In Ci-H2S
(Ohmoto and Rye, 1979).
At very high temperatures, equilibrium isotopic fractionation of pyrite,
chalcopyrite, and sphalerite is insignificant both relative to parent fluids and relative to each other. At the <3670C temperatures measured for exiting fluids at the TAG active
mound, however, isotopic fractionation between sulfides may be large enough to be significant (Figure 12). For precipitates at or approaching equilibrium, the difference in 63 4S values between minerals and fluids increases with decreasing temperature, and the rate and direction of change depends on the mineral (Figure 12).
At a given temperature, a quantitative estimate of equilibrium isotopic
fractionation between related minerals can be calculated using the equations in Table 7. In the first column of Table 7, for any two minerals, i and j, "mineral i - mineral j" refers to their difference. In the second column of Table 7, for the same minerals, i and j, A is defined as A = 834Si- 34Sj.
If 634S analyses of related minerals are unavailable, 834S analyses of a related fluid and mineral can be used to calculate the state of equilibrium as:
1000 In ai-H2S = (A/TL)x10' + B (Equation 1)
where A and B are constants listed in Table 8 for each mineral (Ohmoto and Rye, 1979).
1000 In ai.H2s approximates Ai-H2s, which equals 834Si - 3 4SH2s. Given the 8
3 4S value of any mineral, Eq. 1 can be used with the constants in Table 8 to calculate the 834S value of an equilibrium parent fluid. Alternatively, Eq. 1 can be used to write separate equations for each of two minerals in a related pair. The two equations may then be subtracted to
cancel out the variable for H2S. Subtraction leaves only 1000 In ai-j, which approximates 534Si - 834Sj
Isotopic Relationships of Coexisting Minerals
The methods for investigating isotopic equilibrium can be applied to the 834S
values of related minerals from TAG active mound samples. A qualitative comparison between Figure 12 and any pair of related 834S values can readily identify whether the pair is in disequilibrium. At any temperature in Figure 12, the order of enrichment with heavy isotopes is anhydrite > pyrite > sphalerite > fluid H2S > chalcopyrite. This experimentally determined order corresponds with decreasing bond strengths and has generally been confirmed by analytical data. TAG mound sulfides qualitatively show this equilibrium order of 534S values within analytical uncertainty, with the exception of a
sphalerite-chalcopyrite pair from white smoker sample 2187-1-7F, and a sphalerite-pyrite pair from mound sample 2190-13-18. For example, 834S analysis of the 2187-1-7F mineral pair yields chalcopyrite (6.9 ±0.2%o) isotopically heavier than related sphalerite
(5.2 +0.2%o), giving a reversed order of enrichment where sphalerite < chalcopyrite.
Mineral pairs which qualitatively mimic the isotopic enrichment order of Figure 12 may be in isotopic equilibrium. The equations in Tables 7 and 8 can be used to investigate the equilibrium status of such minerals with better precision. For example, the sulfide-sulfide mineral pair in mound sample 2 19 0-13-1y and the sulfide-sulfate mineral pair of pyrite and anhydrite in massive anhydrite sample 2178-3-1 both agree with the equilibrium isotopic enrichment order.
Analysis of mound sample 2 19 0-13-1y yields a pyrite 634S value of 5.4 ±0.2%o and a sphalerite value of 5.0 10.2%o. (Note that the fact that these two samples yield identical 834S values within analytical error does not imply that they are in equilibrium-see Figure 12). The difference in measured 634S values between the two minerals is Apy-sp
= 0.4 ±0.3%o (where 0.3%o = ,,tot = sqrt[apy2 + asp2]). Pyrite and sphalerite in 2190-13-ly were chemically separated from each other in the original sample prior to analysis, and are thought to be "related" minerals.
The temperature at which the mound sample precipitated is not known. Applying 150C as a reasonable lower limit, the equations in Table 7 can be used to calculate an equilibrium Apysp = 1.7 ±0.2%o:
Apysp = [((0.55 ±0.04)* 10) / (150 + 273)]2 = 1.7 ±0.2%o
This calculated equilibrium difference is around 1.3%o greater than the analyzed difference. 1.3%o is much larger than the analytical uncertainty of 0.3%o, indicating isotopic disequilibrium in sample 2190-13-ly at the temperature of 1500C.
Calculations of pyrite and sphalerite from 2190-13-ly fail to demonstrate equilibrium at 150C. Because the temperature at which the samples precipitate is not well-constrained, it is possible that the apparent disequilibrium is an artifact from using an incorrect equilibrium temperature. As derived in Appendix 2, it is possible to determine the temperature of a parent fluid from which a sample would precipitate minerals with certain 834S values. The temperature at which minerals from sample
2190-13-ly would precipitate the observed minerals in equilibrium can be calculated using the
measured value Apy-sp = 0.4 +0.3%o:
T = [(0.55 +0.04)*103] / (y-sp)" 2 = 870 ±630
K = 597 ±630C
Even considering the uncertainty, a temperature of 597 ±63'C is unrealistically high. The sulfide pair in 2190-13-1y demonstrates isotopic disequilibrium at all
temperatures observed at TAG. This may be due to the fact that pyrite precipitates over a longer period of the paragenesis than sphalerite, allowing pyrite to experience
depositional conditions which are not necessarily identical to those which precipitated sphalerite (Ohmoto and Rye, 1979). Abnormal equilibrium temperatures for pyrite-sphalerite pairs are common (Ohmoto and Rye, 1979), and disequilibrium among coexisting sulfides has also been reported from 1 10N and 13oN East Pacific Rise (Bluth and Ohmoto, 1988).
Given that the sulfide-sulfide mineral pair was calculated to be in disequilibrium, do sulfate-sulfide minerals also show disequilibrium? Analysis of massive anhydrite
sample 2178-3-1 yields a mean pyrite 834S = 6.2 ±0.2%o and an anhydrite 834S = 20.6 +0.2%o, giving Aanh-py = 14.4 ±0.3%o. Anhydrite in 2178-3-1 is from the sub-sample
3,
a <5 cm square sample piece. Related pyrite is from sub-samples a and y. Sub-sample a was collected on the same broken face as sub-sample P. Sub-sample y was collected on a different face on the opposite side of the sample from which a and P were collected. Even though y was collected on a different face, it is included in determining the mean pyrite 634S value because it was more carefully cleaned of trace anhydrite than was sub-sample ca.
Fluid inclusion data in a surficial massive anhydrite sample from the TAG active mound indicate that the sample precipitated from a fluid at 338 to 3530C (Tivey et al., in press). Considering this range of temperatures and the provisions of Table 7, a
temperature of 3490C (6220K) is used to calculate
Aanh-py = 18.1+0.5%o. This calculated equilibrium Aanh-py is 3.6%o greater than the measured values and is much greater than the
analytical uncertainty of 0.3%o. The minerals in sample 2178-3-1 are in disequilibrium, and isotopic disequilibrium between sulfate and sulfide has also been found at the southern Juan de Fuca Ridge (Shanks and Seyfried, 1987) and at 21 N East Pacific Rise (Woodruff and Shanks, 1988).
At what temperature would the 834S values for the mineral pair appear to be in equilibrium? From Appendix 2 and using the measured Ah-py = 14.4+0.3%o, the equilibrium temperature is calculated to be 483 ±320C. As was the case with sample
2190-13-1y, calculated temperatures for equilibrium given measured 834S values are higher than those observed at the TAG active mound.
Isotopic Relationship of Black Smoker Fluids and Sulfides
Since pairs of minerals show disequilibrium, paired minerals and fluids may also demonstrate disequilibrium. Because only end-member, black smoker fluids have been analyzed for 834S and because chalcopyrite crystals line the passages through which black smoker fluids flow, the only related TAG minerals and fluids which can be investigated are black smoker chalcopyrite and black smoker fluids.
Black smoker fluid 83 4S values range 6.5 to 7.5 ±0.2%o at the invariant
mean 34S value and standard deviation of 5.6 ±0.04%o. Fluid 834S values are heavier
than sulfide 83 4S values, as has also been found at the Southern Juan de Fuca Ridge (Shanks and Seyfried, 1987), at 210N East Pacific Rise (Woodruff and Shanks, 1988), and in 4 out of 6 vents at 11ON and 130N East Pacific Rise (Bluth and Ohmoto, 1988).
As discussed previously, the 634S values of black smoker chalcopyrite are invariant while the 634S values of black smoker fluids vary. This discrepancy can be further illustrated by calculating the isotopic relationship of the fluid and precipitate at equilibrium.
Measured Acp-H2 = -0.9 to -1.9 +0.3%0, while calculated equilibrium Acp-H2S
0.12 ±0.2%o at 3660C using Table 8. The 634S value of fluid H
2S calculated to be in
equilibrium with the black smoker chalcopyrite can be found: Acp-H2S, calculated = -34Scp - 34SH2S, calculated
53 4SH2S, calculated = 834Scp - Acp-H2S, calculated = 5.6 ±0.04%o - (-0.12 ±0.20%o) = 5.7 ±0.2o
The calculated equilibrium fluid value of 5.7 ±0.2%o is 1 to 2%o lighter than the measured fluid values of 6.5 to 7.2 ±0.2%o. The difference is significant relative to the analytical uncertainty of 0.3%o and indicates disequilibrium.
Post-Depositional Reworking
Post-depositional reworking can modify the original 534S values of a sulfide. Evidence for post-depositional reworking includes the alteration, veining, and brecciation found in drill cores, indicative that the TAG active mound has evolved through multiple stages of growth (Humphris et al., 1995). Additional evidence comes from TAG mound massive sulfide samples. Because the massive sulfide samples are believed to have originated in the interior of the mound (Tivey et al., 1995), the large grain size and replacement textures exhibited by the samples demonstrate that post-depositional processes modify sulfides inside the TAG active mound (Tivey et al., 1995).
TABLE 6. Temperatures and 534S Values for H2S
from TAG Black Smoker Fluid Samples
Sample # T (oC)' 8S(%o)z
2179-1c 362 7.4
2179-7c 362 7.5
2179-9c 362 6.6
Note error on 83 4S values is +0.2%o. IFrom Edmond et al. (1995).
2
From W. C. (Pat) Shanks III, unpublished data.
(/T(K))2 0 30 25 10 x 106 2 ... 4 6 8 800 600 400 300 200 100 Temperature,*C Figure 12. 834S values of minerals (i) relative to parent fluid (H
2S) at equilibrium. Reported in
terms of fractionation factors (a). 1000 In ai.-s is approximately equal to 8"Si - SUS, as
discussed in text. Solid lines experimentally determined. Dashed lines extrapolated or theoretically calculated. Figure from Ohmoto and Rye (1979).
SCj / / I / / I I _ I ; ,, ~--~---- --- -- ---- cc~ sa S-IZ I I _ / I
-
-/ .... Fes2 ZaS --- CFe S2 _ , I, , I I I, --- S-
-TABLE 7. Difference in 834S Values Between Two Minerals in Equilibrium
Mineral Pair Equation*
Anhydrite -chalcopyrite A = [(2.85x10) / T] ±1, for T>6730K A = [(2.30x10³) / T]2 +6 0.5, for T<6230K Anhydrite -pyrite A = [(2.76x10-) / T]2 ±1, for T>6730K
A = [(2.16x10³) /T] 2 +6 ±0.5, for T<6230K Pyrite -chalcopyrite A = [[(0.67±0.04)x10 ] / T]
-Pyrite -sphalerite A= [[(0.55+0.04)x10 ] / T]' *Temperature is in degrees Kelvin.
Based on Ohmoto and Rye (1979), Table 10-2. See Appendix 2 for derivation.
TABLE 8. Equilibrium Isotopic Fractionation Factors
Mineral A B Temp. Range (0C)
Anhydrite 5.26 6.0 ± 0.5 200-350
Pyrite 0.40 ± 0.08 --- 200-700
Sphalerite 0.10 ± 0.05 --- 50-705
Chalcopyrite -0.05 ± 0.08 --- 200-600
Section 3. INTERPRETATION OF 634S DATA
Black Smoker, Crust, and Massive Anhydrite Samples
834S data for chalcopyrite in black smoker samples is very uniform and yields a
mean of 5.6%o with a standard deviation of 0.04%o (Figure 10). The lack of variation is notable considering the fact that the analyses include inactive sample 2178-5-1 collected from the main black smoker complex and actively venting sample ODP-6-2894 collected from the mound surface (Figure 6). The uniformity in the data implies deposition with a constant temperature and disequilibrium status from a parent fluid with a constant 834S value. This result confirms Tivey et al.'s (1995) findings that black smoker linings precipitate directly from chemically and thermally invariant end-member fluids. Also, the similarity between the active and inactive samples indicates that the black smoker
samples have been neither significantly reworked by fluids with differing 834S signatures,
nor significantly affected by any short-term variability in the 834S values of parent fluids. 834S values in chalcopyrite from crust samples are also fairly uniform (mean = 5.4 =0.2%o). Within error, the mean chalcopyrite in crust samples is isotopically identical to the mean chalcopyrite in black smoker samples, which suggests that crust and black smoker samples precipitate from the same fluid. Although it cannot be related to the black smoker data, pyrite from crust samples was also analyzed for 534S values. As
shown in Figure 13, crust pyrite 834S values cluster in two groups, the first with a mean of
6.0 ±0.4%o (Group H) and the second with a mean of 4.6 +0.1%o (Group L). Both groups
of samples were collected on the west side of the black smoker complex, but the isotopically heavier Group H was collected closer to the active black smokers than the isotopically light Group L (Figure 6). All of the chalcopyrite analyzed from crust
samples comes from Group H. Group L samples do not contain sufficient quantities of chalcopyrite to permit 534S analyses by the bulk analytical technique used in this study.
Group L pyrite/marcasite minerals were deposited in situ, as indicated by the microscopic texture of radial bands of pyrite crystals. The sampled areas in
pyrite region close to a minor channel. End-member fluids with 83 4S values of 6.6 to 7.5%o are reversed with respect to equilibrium with Group L pyrite values of 4.6 to 4.7%o (Figure 12). The light Group L pyrite 834S values cannot be explained by deposition from a conductively cooled end-member fluid, a fluid contaminated with seawater sulfur, or a fluid from which chalcopyrite had already been precipitated because all of these processes would drive pyrite values heavier. However, deposition from a fluid which had cooled extensively to the point that it precipitated significant amounts of pyrite could ultimately result in an isotopically light sample. This hypothesis requires that the decrease in fluid 834S from pyrite precipitation outweighs the increase in fluid 83 4S from chalcopyrite precipitation and cooling. Because Fe is much more abundant than Cu in end-member fluid (Table 1), and because the 34Si - 834SH2S gradient is steeper for pyrite than for chalcopyrite (Figure 12), it is likely that pyrite precipitation could affect greater change in the fluid 634S than chalcopyrite precipitation. Whether pyrite deposition could override the isotopic increase in the fluid due to cooling and what quantity of sulfur would have to be removed as pyrite are not known because the 634S values of pyrite which would precipitate prior to depositing Group L crust samples are not known. While cooling and pyrite precipitation may be factors in producing the low 634S values in Group L crust samples, it is not possible to determine the origin for Group L with certainty based solely on the sulfur isotope data.
Group H consists of two samples, 2179-1-18 and 2180-Ia. Pyrite analyzed for sample 2179-1-18 came from a single 5 mm clast which was removed from a finer-grained matrix. Pyrite analyzed from 2180-1 ca came from a group of fewer than 10 small grains sitting in a very fine-grained matrix. The size and shape of the pyrite and the finer-grained texture of the matrix indicate that the pyrite in both samples are isolated debris later cemented into a matrix. Sulfide debris in TAG active mound crust samples has also been mentioned by Tivey et al. (1995). The pyrite debris is not in isotopic equilibrium with chalcopyrite from the matrix. For example, analysis of sample 2179-1-1 yields a pyrite 634S value of 5.7 ±0.2%o and a chalcopyrite value of 5.3 +0.296o. The temperature at which the minerals would display equilibrium can be calculated using the measured