Review Article
Adult echocardiographic nomograms: overview, critical review
and creation of a software for automatic, fast and easy calculation
of normal values
Massimiliano Cantinotti1,2, Raffaele Giordano3, Marco Paterni2, Daniel Saura4, Marco Scalese2, Eliana Franchi1, Nadia Assanta1, Martin Koestenberg5, Raluca Dulgheru6, Tadafumi Sugimoto7, Anne Bernard8, Luis Caballero4, Patrizio Lancellotti9,10
1Fondazione G. Monasterio CNR-Regione Toscana, Massa and Pisa, Italy; 2Institute of Clinical Physiology, Pisa, Italy; 3Department of Advanced Biomedical Sciences, University of Naples Federico II, Naples, Italy; 4Hospital Clínico Universitario Virgen de la Arrixaca, IMIB-Arrixaca, Murcia, Spain; 5Division of Pediatric Cardiology, Department of Pediatrics, Medical University Graz, Graz, Austria; 6University of Liège hospital, GIGA Cardiovascular Science, Heart Valve Clinic, Imaging Cardiology, Liège, Belgium; 7Department of University Cardiology, University of Milano School of Medicine, I.R.C.C.S. Policlinico San Donato, San Donato Milanese, Milan, Italy; 8CHU Tours, France et Université de Tours, Tours, France; 9Department of Cardiology, Cardio-Oncology Clinic, University of Liège Hospital, GIGA Cardiovascular Sciences, CHU Sart Tilman, Liège, Belgium; 10Gruppo Villa Maria Care and Research, Anthea Hospital, Bari, Italy
Contributions: (I) Conception and design: M Cantinotti, R Giordano, P Lancellotti; (II) Administrative support: M Cantinotti; (III) Provision of study materials or patients: D Saura, E Franchi, N Assanta, M Koestenberg; (IV) Collection and assembly of data: R Dulgheru, T Sugimoto, A Bernard, L Caballero; (V) Data analysis and interpretation: M Paterni, M Scalese; (VI) Manuscript writing: All authors; (VII) Final approval of manuscript: All authors.
Correspondence to: Raffaele Giordano, MD, PhD. Department of Advanced Biomedical Sciences, University of Naples Federico II, Via Pansini 5, Naples 80131, Italy. Email: [email protected].
Abstract: There is a crescent interest on normal adult echocardiographic values and the introduction of new deformation imaging and 3D parameters pose the issue of normative data. A multitude of nomograms has been recently published, however data are often fragmentary, difficult to find, and their strengths/ limitations have been never evaluated. Aims: (I) to provide a review of current echocardiographic nomograms; (II) to generate a tool for easy and fast access to these data. A literature search was conducted accessing the National Library of Medicine using the keywords: 2D/3D echocardiography, strain, left/ right ventricle, atrial, mitral/tricuspid valve, aorta, reference values/nomograms/normal values. Adding the following keywords, the results were further refined: range/intervals, myocardial velocity, strain rate and speckle tracking. Forty one published studies were included. Our study reveals that for several of 2D/3D parameters sufficient normative data exist, however, a few limitations still persist. For some basic parameters (i.e., mitral/tricuspid/pulmonary valves, great vessels) and for 3D valves data are scarce. There is a lack of studies evaluating ethnic differences. Data have been generally expressed as mean values normalised for gender and age instead of computing models incorporating different variables (age/gender/body sizes) to calculate z scores. To summarize results a software (Echocardio-Normal Values) who automatically calculate range of normality for a broad range of echocardiographic measurements according to age/gender/weight/ height, has been generated. We provide an up-to-date and critical review of strengths/limitation of current adult echocardiographic nomograms. Furthermore we generated a software for automatic, easy and fast access to multiple echocardiographic normative data.
Keywords: 2D Doppler echocardiography; normal values; 3D echocardiography; strain Submitted Oct 25, 2017. Accepted for publication Oct 27, 2017.
doi: 10.21037/jtd.2017.11.26
Introduction
Quantification of cardiac dimensions is essential during the performance of echocardiography (1-5) and such measurements should be evaluated according to normative data (6-10). Echocardiographic nomograms are tools to estimate whether a cardiac dimension is within the range of normality or how far it diverges from it (6-10). In pediatric echocardiography, where cardiac dimensions significantly change with somatic growth, nomograms are essential and consolidate tools for the estimation of the severity of many congenital and acquired cardiac defects (6-10). In adults instead fixed rather than subject specific echocardiographic cut-off values have been generally employed for decades to grade disease severity and pose surgical indications (11,12). However, cardiac dimensions (13-37) and functional indexes (38-62) change with increasing age also in the adult population (63-87) and substantially differ according to gender and body size (88-96). Over the last few years (15-39), there has been a crescent call for patients specific rather than generic threshold values (40-64), leading multiple authors to publish echocardiographic normative data (65-85). In particular, four major multi-center studies (the Normal Reference Range for Echocardiography—NORRE-European, The Japanese Normal Values for Echocardiographic Measurement Project—JAMP, The Echocardiographic Measurements in Normal Chinese Adults—Eminca, and The Normal Echocardiographic Measurements in a Korean population—NORMAL-trials) are currently ongoing and normative data for many 2D and a few 3D parameters have been published (15-23,52). Contemporary, different centers addressed the need of having normative data for new parameters coming from 3D echocardiography (45-58) and deformation analysis (60-81). At present there is a big amount of echocardiographic normative data (15-39), but these data remain fragmentary and at times (40-64), difficult to find and time consuming (65-85). Not only current nomograms may difficult to access (15-39), but they may also result complicate to interpret, in view on non-linear variation of echo parameters with age (40-64), gender and body size (65-85). Furthermore nomograms coming from different sources (particularly those from different geographic areas) may generate different results. For instance, for a given male subject of 26 years, 65 kg weight and 168 cm height, LA atrial minimal diameters range of normalities may vary from to 41.8±5.2 (18) to 35.0±4.6 (16), up to 33.1±4.2 mm (22), according to the
nomogram employed. Thus interpretation of nomograms requires knowledge of their accuracy and limitations (6-10), and similar analysis has never been performed so far.
The aim of this study was to review the published adult normative data for 2D and 3D echocardiography with the goal to provide an overview and to evaluate strengths and limitations of currently available data. A second aim was to provide a tool for an easy and fast access to a multitude of normative data coming from different sources, who may orientate the clinician in daily practice.
Search strategy
Studies were included after a systematic search in the National Library of Medicine (PubMed access to MEDLINE citations; http://www.ncbi.nlm.nih.gov/ PubMed/). The search strategy included a combination of Medical Subject Headings and free text
Terms for the key concepts, such as: 2D and 3D echocardiography, strain, left ventricle (LV) and right ventricle (RV), atrial, mitral and tricuspid valve, aorta, reference values, and nomograms and normal values. Adding the following keywords, the results were further refined: range and intervals, myocardial velocity, strain rate and speckle tracking. In addition, we identified other potentially relevant publications using a manual search of references from all eligible studies and Review Articles, as well as from the Science Citation Index Expanded on the Web of Science.
Studies were searched from 2005 to 2017 using the above mentioned terms.
Two reviewers assessed all identified reports independently, and a consensus was reached for the final inclusion in the present study. Titles and abstracts of all articles identified by the search strategy were evaluated and excluded if (I) the studies included populations other than normal subjects (3 studies excluded), and (II) the reports were written in languages other than English (2 studies excluded), (III) studies with less than 100 healthy subjects at least considered very relevant for a lack of other more robust dataset (24 studies excluded), and (IV) for deformation analysis studies not performed with speckle tracking echocardiography (STE) (5 studies excluded).
Search results
One hundred and two publications were identified to be suitable for inclusion in this study. Of these, 34 were
excluded on the basis of the criteria listed above, yielding 68 publications for analysis (Figure 1).
General aspects: how to build echocardiographic nomograms
When building an echocardiographic nomogram several aspects need to be taken into account. How to perform measurements in a standardised method? How to select healthy subjects (i.e., inclusion/exclusion criteria)? How many subjects are required to generate normative data with a sufficient statistical power and lately how to normalise and express normal values?
How to perform measurements
When building echocardiographic nomograms, a series of issues need to be faced (6,8-10). First it’s important to decide how to perform the measurements (6,8-10). Guidelines for the quantification of 2D cardiac chambers (1,3) and functional indices (4,5), are well established. For 3D echocardiography, recommendations for chamber volumes
quantification have recently become available (3) while guidelines for the 3D evaluation of cardiac valves mainly pertain to be an anatomical and functional assessment (without clear indication on basic quantification methods such as annulus measurements) (65). For strain analysis different methodologies may be employed (tissue Doppler echocardiography, 2D STE and, 3D echocardiography) (11-20), but a consensus document only exists for STE (and indications for RV and atrial strain analysis are limited) (65). Inclusion and exclusion criteria
Definition of inclusion/exclusion criteria should be address accurately.
Only healthy subjects should be included, however health is a generic term (85,86) lacking of specific definition and inclusion criteria may change from a study to another. Our research highlighted how there was sufficient agreement on criteria of inclusion adopted by latest major studies ( 1 5 - 2 3 , 3 8 , 5 1 , 5 2 , 6 3 ) . H y p e r l i p i d e m i a , s y s t e m i c hypertension, diabetes mellitus, lung disease, renal failure, liver failure, genetic syndrome, neuro-muscular disorders, abnormal electrocardiographic and/or echocardiographic findings, connective tissue disease, and poor image quality have been used as exclusion criteria in the majority of works (15-23,38,51,52,63). Pregnant or lactating women, athletes, and subjects addicted to alcohol were also excluded by a few authors (15,16,60), and some studies also evaluated smoking (15,21,38,82), anaemia and fever (15,16) as exclusion criteria. However, in some studies (15,19,38,43,52,54,63,82), inclusion criteria were well defined, in other sufficiently explained (20,21,24,30,50,52,61,67,70,74,76), while in few works the criteria were more generic (23,24,26,58,59,69,73). Sample size
How many healthy subjects should be enrolled in another key point for the building of nomograms? Theoretically the sample size necessary to build a nomogram should be calculated by dividing the population into age-groups and assuming a minimum number of subjects for each of these age intervals (85-88). Assuming a normal distribution of the variables and estimating the population standard deviation (SD) at 0.5 (87-89) at least 80–120 subjects for every age group are necessary to provide a 95% confidence interval (CI) with a margin of error of 0.1 (74,75).
Thus assuming to divide the adult population into six age Studies initially retrieved
N=102
Not normal population N=3
Not in English N=2
Studies with n<100 N=24
Strain not STE-derived N=5
Studies included in revision N=68
Figure 1 Studies included in the review. STE, speckle tracking echocardiography.
groups (i.e., 20–30, 30–40, 40–50, 50–60, 60–70, >70 years), as performed in the majority of the studies (15-17,21-23), at least 100 subjects for each study group should be enrolled (i.e., 600 in total). This number should be multiplied for the two genders (i.e., 1,200) and for multi-ethnic studies for the number race evaluated (i.e., for instance for 3 race Caucasian/Black/Asian; 600×2×3=3,600). Since almost all the studies consider a single race the threshold should be 1,400, and most of the nomograms currently available do not meet these criteria. Major studies had a sample size around 700 subjects (18-21,52), while only a few studies had a sample size >1,000 (15-17,26,35), (Tables 1,2). The widest study was the EMINCA study (15-17) with 1,394 healthy subjects (i.e., even above the target of 1,200 subjects). Some authors have tried to overcome the issue of sample size (65) by proposing meta-analytic works. However, the use of meta-analysis, although attractive, is questionable since heterogeneous data (collected in different ethnic population, of different ages and by using slightly different acquisition and quantification methods) are mixed together. How to normalize and to express normalized data
Another issue when dealing with nomograms is how to normalise and how to express normalised data (6,8,9). Almost all studies presented data as mean values (plus or minus standard deviation) normalised by gender, age groups and at times indexed by body surface area (BSA) (15-23,34-36,38,50,58,59,61,90,91). A few studies used percentile (35,72,76-78,80) and one study employed z scores (41) that are commonly used in the pediatric age group. The relative scarce and inconstant relationship between parameters of body size (age, weight, BSA) producing low R2 (18,82) may explain the choice to employ mean values (plus or minus standard) instead of computing z scores, that theoretically should be preferred (6,8,9). Z score is a standard-bearer value that indicates by how many SDs a value is above or below the mean in a normally distributed population (i.e., z score of ±2 means that the measurement is 2 SDs above/ below the mean). Z scores are better than dichotomous “normal or abnormal values” because they allow clinicians to appreciate the “magnitude of abnormality” (i.e., a z score of +4 indicates a severe dilatation), (6,8,9) Still, generation of suitable Z scores requires finding an appropriate model fitting the actual distribution of data and satisfying tight statistical assumptions, not always met in the published literature (9,10).
Confounders
Differences among age groups and gender have been widely studied (15-17,20-23). Influence of body size parameters (i.e., weight, height and body size) has been evaluated only in a few studies (50,81,82). Also the relevance of descent has been rarely investigated (68). All the authors have evaluated inter- and intra-observer variability and a good reproducibility emerged in most studies [with interclass correlation coefficients-(ICCs) vary from 0.6 to 0.9]. As expected, inter-observer variability was greater (i.e., ICC 0.3–0.9).
Nomograms for different echo measurements Summary of the results
Generation of a software for automatic echocardiographic normal values calculation
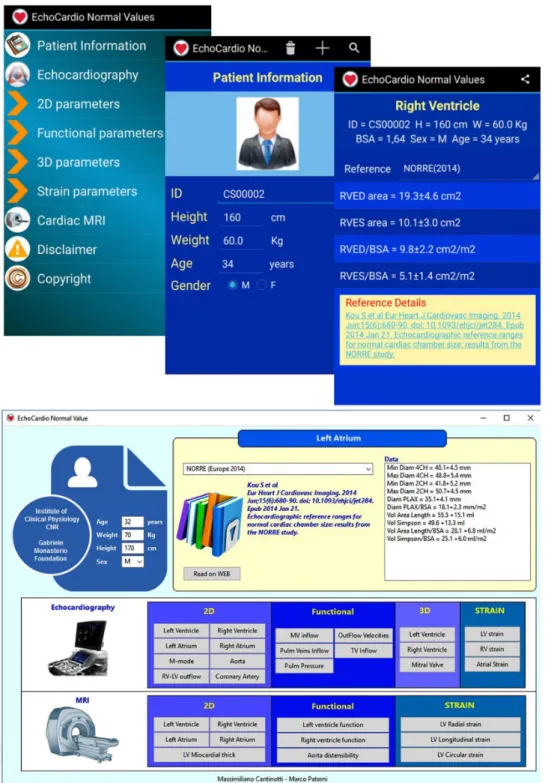
To summarise data, major result of the studies selected were used to build a software who generates ranges of normality for echocardiographic parameters. Echocardio-Normal Values (97) is an application designed for mobile device with Android operating system published on Google Play store on 21 august 2017 by Infotel FTGM and currently available for free. It has been developed in JAVA language by using Android Studio 1.5.1, that is, Android’s official IDE developed and distributed by Google Inc. No external libraries were used. The same application was been also developed for desktop devices with Window, OSX e Linux operative systems by using a multi-platform development system. All rights are reserved and the application is distributed through specific installation packages, one for each kind of device. Reference tables and data for single profiles are stored in a SQLITE database that is included in the installation package. This software, for a given subject of a given age and gender, allows automatic calculation of normal values of echocardiographic measurements (i.e., 2D and functional indices, 3D data and strain values) and comparison among different sources. At the moment the software has been developed for operative systems desktop (Windows, OSX e Linux) and mobile (Android) (97) (Figure 2).
How to interpret data coming from different sources Strength and limitations, similarities and differences, influence of age, gender and other confounders of current
T
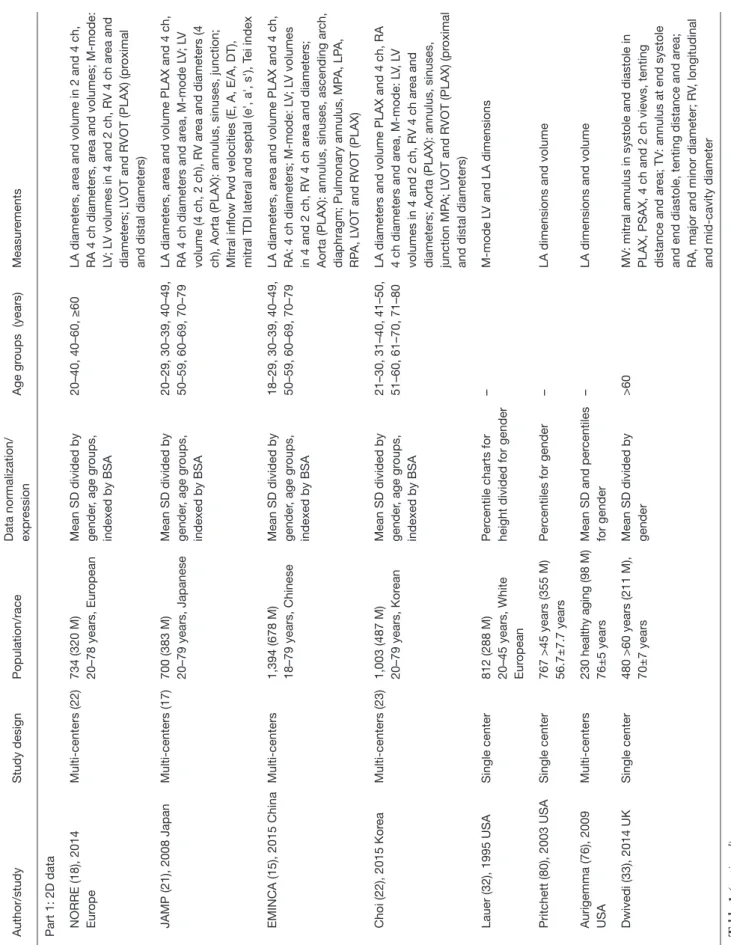
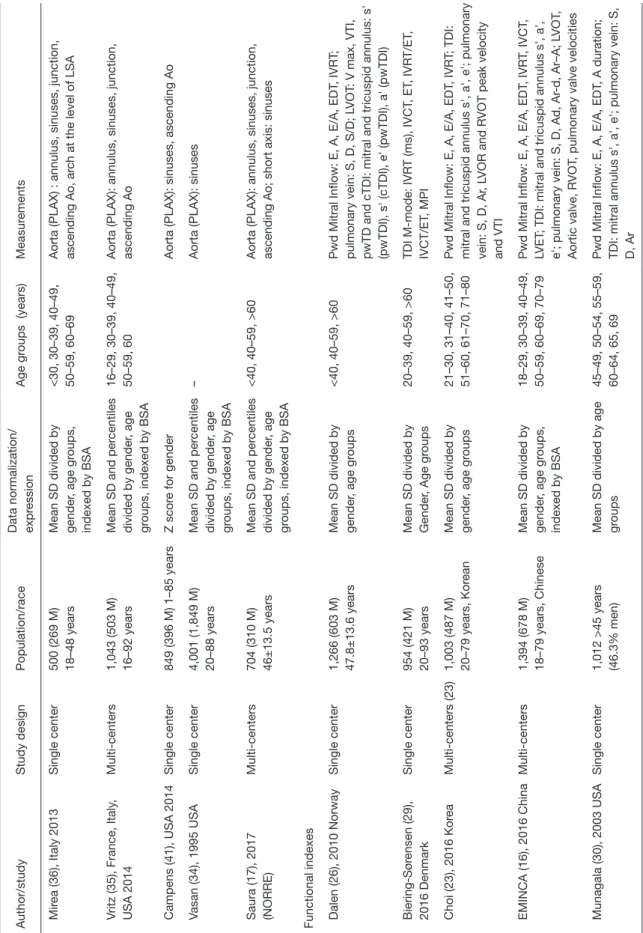
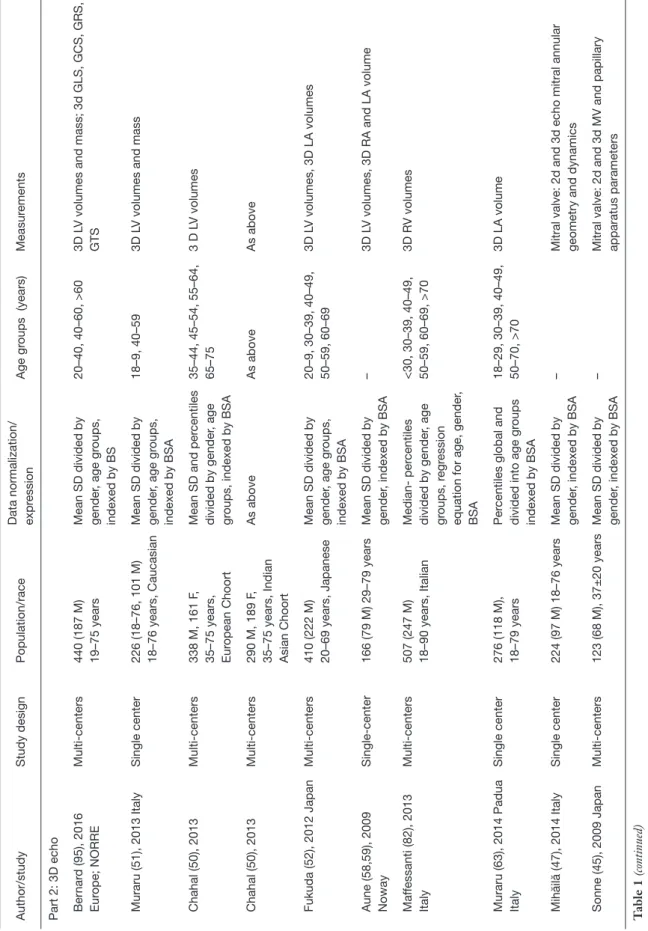
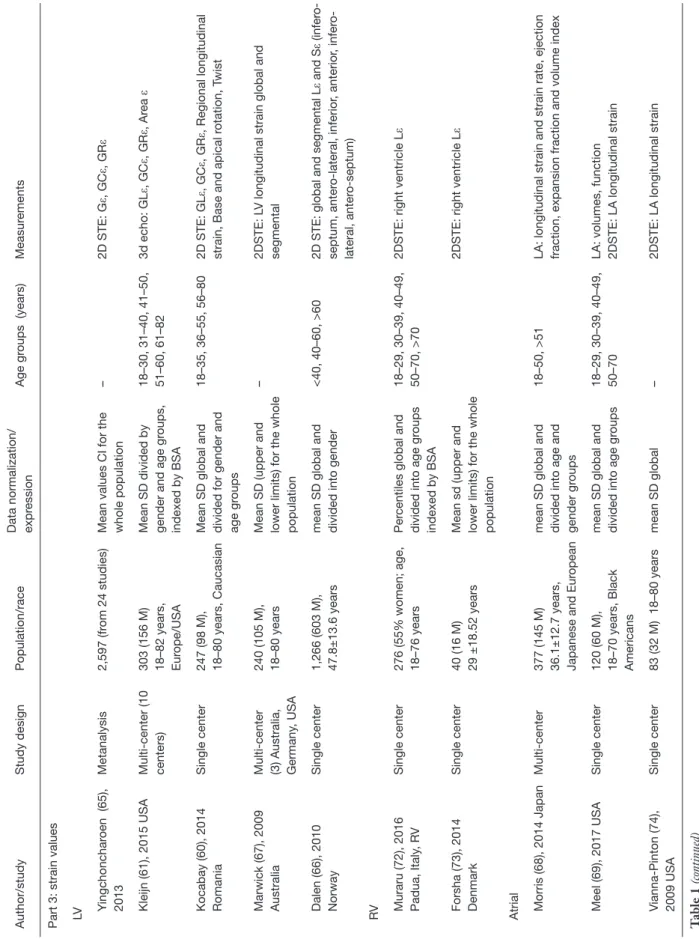
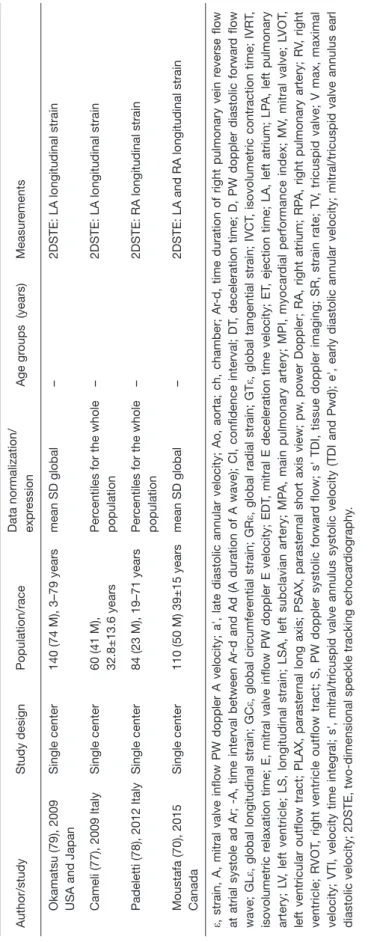
able 1
Major adult nomograms for echocardiography
Author/study
Study design
Population/race
Data normalization/ expr
ession
Age gr
oups (years)
Measur
ements
Part 1: 2D data NORRE (18), 2014 Eur
ope
Multi-centers (22)
734 (320 M) 20–78 years, Eur
opean
Mean SD divided by gender
, age gr
oups,
indexed by BSA
20–40, 40–60, ≥60
LA diameters, ar
ea and volume in 2 and 4 ch,
RA 4 ch diameters, ar
ea and volumes; M-mode:
LV ; L V volumes in 4 and 2 ch, R V 4 ch ar ea and diameters; L VOT and R VOT (PLAX) (pr oximal
and distal diameters)
JAMP (21), 2008 Japan
Multi-centers (17)
700 (383 M) 20–79 years, Japanese Mean SD divided by gender
, age gr
oups,
indexed by BSA
20–29, 30–39, 40–49, 50–59, 60–69, 70–79
LA diameters, ar
ea and volume PLAX and 4 ch,
RA 4 ch diameters and ar ea, M-mode L V; L V volume (4 ch, 2 ch), R V ar ea and diameters (4
ch), Aorta (PLAX): annulus, sinuses, junction; Mitral inflow Pwd velocities (E, A, E/A, DT), mitral TDI lateral and septal (e', a', s'), T
ei index
EMINCA (15), 2015 China
Multi-centers
1,394 (678 M) 18–79 years, Chinese Mean SD divided by gender
, age gr
oups,
indexed by BSA
18–29, 30–39, 40–49, 50–59, 60–69, 70–79
LA diameters, ar
ea and volume PLAX and 4 ch,
RA: 4 ch diameters; M-mode: L
V; L
V volumes
in 4 and 2 ch, R
V 4 ch ar
ea and diameters;
Aorta (PLAX): annulus, sinuses, ascending ar
ch,
diaphragm; Pulmonary annulus, MP
A, LP A, RP A, L VOT and R VOT (PLAX) Choi (22), 2015 Kor ea Multi-centers (23) 1,003 (487 M) 20–79 years, Kor ean
Mean SD divided by gender
, age gr
oups,
indexed by BSA
21–30, 31–40, 41–50, 51–60, 61–70, 71–80 LA diameters and volume PLAX and 4 ch, RA 4 ch diameters and ar
ea, M-mode: L V, L V volumes in 4 and 2 ch, R V 4 ch ar ea and
diameters; Aorta (PLAX): annulus, sinuses, junction MP
A; L
VOT and R
VOT (PLAX) (pr
oximal
and distal diameters)
Lauer (32), 1995 USA
Single center
812 (288 M) 20–45 years, White Eur
opean
Per
centile charts for
height divided for gender
– M-mode L V and LA dimensions Pritchett (80), 2003 USA Single center 767 >45 years (355 M) 56.7±7.7 years Per
centiles for gender
–
LA dimensions and volume
Aurigemma (76), 2009 USA
Multi-centers
230 healthy aging (98 M) 76±5 years
Mean SD and per
centiles
for gender
–
LA dimensions and volume
Dwivedi (33), 2014 UK
Single center
480 >60 years (211 M), 70±7 years Mean SD divided by gender
>60
MV
: mitral annulus in systole and diastole in
PLAX, PSAX, 4 ch and 2 ch views, tenting distance and ar
ea; TV
: annulus at end systole
and end diastole, tenting distance and ar
ea;
RA, major and minor diameter; R
V, longitudinal
and mid-cavity diameter
T
able 1
T able 1 (continued) Author/study Study design Population/race
Data normalization/ expr
ession Age gr oups (years) Measur ements Mir ea (36), Italy 2013 Single center 500 (269 M) 18–48 years Mean SD divided by gender
, age gr
oups,
indexed by BSA
<30, 30–39, 40–49, 50–59, 60–69 Aorta (PLAX) : annulus, sinuses, junction, ascending Ao, ar
ch at the level of LSA
Vritz (35), France, Italy
,
USA 2014
Multi-centers
1,043 (503 M) 16–92 years
Mean SD and per
centiles
divided by gender
, age
gr
oups, indexed by BSA
16–29, 30–39, 40–49, 50–59, 60 Aorta (PLAX): annulus, sinuses, junction, ascending Ao
Campens (41), USA 2014
Single center
849 (396 M) 1–85 years
Z scor
e for gender
Aorta (PLAX): sinuses, ascending Ao
Vasan (34), 1995 USA
Single center
4,001 (1,849 M) 20–88 years
Mean SD and per
centiles
divided by gender
, age
gr
oups, indexed by BSA
–
Aorta (PLAX): sinuses
Saura (17), 2017 (NORRE)
Multi-centers
704 (310 M) 46±13.5 years
Mean SD and per
centiles
divided by gender
, age
gr
oups, indexed by BSA
<40, 40–59, >60
Aorta (PLAX): annulus, sinuses, junction, ascending Ao; short axis: sinuses
Functional indexes Dalen (26), 2010 Norway
Single center
1,266 (603 M) 47.8±13.6 years Mean SD divided by gender
, age gr
oups
<40, 40–59, >60
Pwd Mitral Inflow: E, A, E/A, EDT
, IVR
T;
pulmonary vein: S, D, S/D; L
VOT
: V max, VTI,
pwTD and cTDI: mitral and tricuspid annulus: s' (pwTDI), s' (cTDI), e' (pwTDI), a' (pwTDI)
Biering-Sør
ensen (29),
2016 Denmark
Single center
954 (421 M) 20–93 years Mean SD divided by Gender
, Age gr
oups
20–39, 40–59, >60
TDI M-mode: IVR
T (ms), IVCT , ET , IVR T/ET , IVCT/ET , MPI Choi (23), 2016 Kor ea Multi-centers (23) 1,003 (487 M) 20–79 years, Kor ean
Mean SD divided by gender
, age gr
oups
21–30, 31–40, 41–50, 51–60, 61–70, 71–80
Pwd Mitral Inflow: E, A, E/A, EDT
, IVR
T; TDI:
mitral and tricuspid annulus s', a', e'; pulmonary vein: S, D, Ar
, L
VOR and R
VOT peak velocity
and VTI
EMINCA (16), 2016 China
Multi-centers
1,394 (678 M) 18–79 years, Chinese Mean SD divided by gender
, age gr
oups,
indexed by BSA
18–29, 30–39, 40–49, 50–59, 60–69, 70–79
Pwd Mitral Inflow: E, A, E/A, EDT
, IVR
T, IVCT
,
LVET
; TDI: mitral and tricuspid annulus s', a',
e'; pulmonary vein: S, D, Ad, Ar
-d, Ar–A; L
VOT
,
Aortic valve, R
VOT
, pulmonary valve velocities
Munagala (30), 2003 USA
Single center
1,012 >45 years (46.3% men) Mean SD divided by age groups 45–49, 50–54, 55–59, 60–64, 65, 69
Pwd Mitral Inflow: E, A, E/A, EDT
, A duration;
TDI: mitral annulus s', a', e'; pulmonary vein: S, D, Ar
T
able 1
T able 1 (continued) Author/study Study design Population/race
Data normalization/ expr
ession
Age gr
oups (years)
Measur
ements
Part 2: 3D echo Ber
nar d (95), 2016 Eur ope; NORRE Multi-centers 440 (187 M) 19–75 years Mean SD divided by gender
, age gr
oups,
indexed by BS
20–40, 40–60, >60
3D L
V volumes and mass; 3d GLS, GCS, GRS,
GTS
Muraru (51), 2013 Italy
Single center
226 (18–76, 101 M) 18–76 years, Caucasian Mean SD divided by gender
, age gr
oups,
indexed by BSA
18–9, 40–59
3D L
V volumes and mass
Chahal (50), 2013 Multi-centers 338 M, 161 F , 35–75 years, Eur opean Choort
Mean SD and per
centiles
divided by gender
, age
gr
oups, indexed by BSA
35–44, 45–54, 55–64, 65–75 3 D L V volumes Chahal (50), 2013 Multi-centers 290 M, 189 F ,
35–75 years, Indian Asian Choort
As above As above As above Fukuda (52), 2012 Japan Multi-centers 410 (222 M) 20–69 years, Japanese Mean SD divided by gender
, age gr oups, indexed by BSA 20–9, 30–39, 40–49, 50–59, 60–69 3D L V volumes, 3D LA volumes Aune (58,59), 2009 Noway Single-center 166 (79 M) 29–79 years
Mean SD divided by gender
, indexed by BSA
–
3D L
V volumes, 3D RA and LA volume
Maf fessanti (82), 2013 Italy Multi-centers 507 (247 M) 18–90 years, Italian Median- per centiles divided by gender , age gr oups, r egr ession
equation for age, gender
,
BSA
<30, 30–39, 40–49, 50–59, 60–69, >70
3D R
V volumes
Muraru (63), 2014 Padua Italy
Single center
276 (118 M), 18–79 years
Per
centiles global and
divided into age gr
oups indexed by BSA 18–29, 30–39, 40–49, 50–70, >70 3D LA volume Mihăilă (47), 2014 Italy Single center 224 (97 M) 18–76 years
Mean SD divided by gender
, indexed by BSA
–
Mitral valve: 2d and 3d echo mitral annular geometry and dynamics
Sonne (45), 2009 Japan
Multi-centers
123 (68 M), 37±20 years
Mean SD divided by gender
, indexed by BSA
–
Mitral valve: 2d and 3d MV and papillary apparatus parameters
T
able 1
T able 1 (continued) Author/study Study design Population/race
Data normalization/ expr
ession
Age gr
oups (years)
Measur
ements
Part 3: strain values LV
Y ingchonchar oen (65), 2013 Metanalysis 2,597 (fr om 24 studies)
Mean values CI for the whole population
– 2D STE: G ε, GC ε, GR ε Kleijn (61), 2015 USA Multi-center (10 centers) 303 (156 M) 18–82 years, Eur ope/USA
Mean SD divided by gender and age gr
oups, indexed by BSA 18–30, 31–40, 41–50, 51–60, 61–82 3d echo: GL ε, GC ε, GR ε, Ar ea ε Kocabay (60), 2014 Romania Single center 247 (98 M), 18–80 years, Caucasian Mean SD global and divided for gender and age gr
oups 18–35, 36–55, 56–80 2D STE: GL ε, GC ε, GR ε, Regional longitudinal
strain, Base and apical r
otation, T
wist
Marwick (67), 2009 Australia Multi-center (3) Australia, Germany
, USA
240 (105 M), 18–80 years Mean SD (upper and lower limits) for the whole population
–
2DSTE: L
V longitudinal strain global and
segmental
Dalen (66), 2010 Norway
Single center
1,266 (603 M), 47.8±13.6 years mean SD global and divided into gender
<40, 40–60, >60
2D STE: global and segmental L
ε and S ε (infer o-septum, anter o-lateral, inferior , anterior , infer o-lateral, anter o-septum)
RV Muraru (72), 2016 Padua, Italy
, R
V
Single center
276 (55% women; age, 18–76 years
Per
centiles global and
divided into age gr
oups
indexed by BSA
18–29, 30–39, 40–49, 50–70, >70
2DSTE: right ventricle L
ε
Forsha (73), 2014 Denmark
Single center
40 (16 M) 29 ±18.52 years Mean sd (upper and lower limits) for the whole population
2DSTE: right ventricle L
ε
Atrial Morris (68), 2014 Japan
Multi-center
377 (145 M) 36.1±12.7 years, Japanese and Eur
opean
mean SD global and divided into age and gender gr
oups
18–50, >51
LA: longitudinal strain and strain rate, ejection fraction, expansion fraction and volume index
Meel (69), 2017 USA
Single center
120 (60 M), 18–70 years, Black Americans mean SD global and divided into age gr
oups
18–29, 30–39, 40–49, 50–70 LA: volumes, function 2DSTE: LA longitudinal strain
Vianna-Pinton (74), 2009 USA
Single center
83 (32 M) 18–80 years
mean SD global
–
2DSTE: LA longitudinal strain
T
able 1
T able 1 (continued) Author/study Study design Population/race
Data normalization/ expr
ession
Age gr
oups (years)
Measur
ements
Okamatsu (79), 2009 USA and Japan
Single center
140 (74 M), 3–79 years
mean SD global
–
2DSTE: LA longitudinal strain
Cameli (77), 2009 Italy
Single center
60 (41 M), 32.8±13.6 years
Per
centiles for the whole
population
–
2DSTE: LA longitudinal strain
Padeletti (78), 2012 Italy
Single center
84 (23 M), 19–71 years
Per
centiles for the whole
population
–
2DSTE: RA longitudinal strain
Moustafa (70), 2015 Canada
Single center
110 (50 M) 39±15 years
mean SD global
–
2DSTE: LA and RA longitudinal strain
ε, strain, A, mitral valve inflow PW doppler A velocity; a', late diastolic annular velocity; Ao, aorta; ch, chamber; Ar
-d, time duration of right pulmonary vein r
everse flow at atrial systole ad Ar; -A, time interval between Ar -d and Ad (A duration of A wave); CI, confidence interval; DT , deceleration time; D, PW doppler diastolic forwar d flow wave; GL
ε, global longitudinal strain; GC
ε, global cir
cumfer
ential strain; GR
ε, global radial strain; GT
ε, global tangential strain; IVCT
, isovolumetric contraction time; IVR
T,
isovolumetric r
elaxation time; E, mitral valve inflow PW doppler E velocity; EDT
, mitral E deceleration time velocity; ET
, ejection time; LA, left atrium; LP
A, left pulmonary
artery; L
V, left ventricle; LS, longitudinal strain; LSA, left subclavian artery; MP
A, main pulmonary artery; MPI, myocar
dial performance index; MV
, mitral valve; L
VOT
,
left ventricular outflow tract; PLAX, paraster
nal long axis; PSAX, paraster
nal short axis view; pw
, power Doppler; RA, right atrium; RP
A, right pulmonary artery; R
V, right
ventricle; R
VOT
, right ventricle outflow tract; S, PW doppler systolic forwar
d flow; s' TDI, tissue doppler imaging; SR, strain rate; TV
, tricuspid valve; V max, maximal
velocity; VTI, velocity time integral; s', mitral/tricuspid valve annulus systolic velocity (TDI and Pwd); e', early diastolic
annular velocity; mitral/tricuspid valve annulus earl
diastolic velocity; 2DSTE, two-dimensional speckle tracking echocar
diography
.
adult echocardiographic nomograms will be now detailed for groups of parameters.
2D echocardiography
Robust nomograms, calculated on wide sample sizes for several major dimensional and functional 2D parameters have recently become available (15-23) coming from Europe (i.e., NORRE) (18) and Asia (i.e., JAMP, EMINCA) (15-17,20-23).
A dimensional indexes
Consistencies and discrepancies in the way to measure among authors
There was sufficient consistency in the way in which measurements have been performed. The LV mass was generally calculated by the equation for M-mode, while JAMP used the area length method (21). There was sufficient consistency also for left atrium (LA) and right atrium (RA) diameter measurements (15,18,21,22). LA volume was generally calculated by the biplane area length method while a few used the ellipsoid method (76), or both (22). Of interest, LA volumes calculated by the area length were significant higher than those calculated by the ellipsoid method (22). For the measurement of the aorta different techniques (inner edge vs. leading edge) and different timings in the cardiac cycle have been employed for measurements. Measurements obtained by using 2005 ASE criteria (37) (i.e., leading edge-to-leading edge technique in diastole) were higher in comparison with those by 2010 ASE pediatric guidelines (17,93) (i.e., systolic inner-inner diameters).
Correlation of cardiac measurements with age and gender and BSA and ethnic groups
All the studies showed significant relation of cardiac measurements with age, but results were somewhat discrepant. LV volumes have been shown to decrease with age (15,18,21,22), while the parietal thickness increased (15,21,22). A few studies reported an increase of left ventricular ejection fraction (LVEF) with age (15,18) while others found no variations (21,22). For LA diameters a positive correlation with age was reported by a few authors (15,21), while other showed age related variations only in female (22) or no significant variations (18). The absolute LA volume showed no age-related variations (21), while the indexed volume showed
T
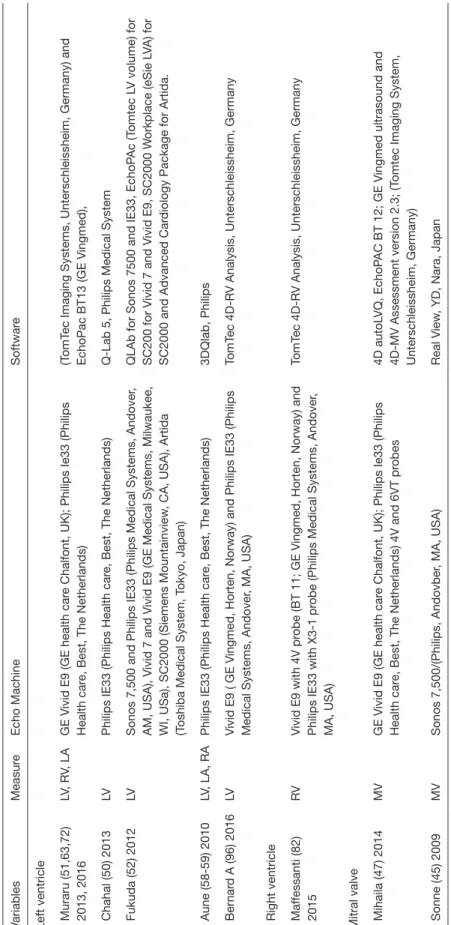
able 2
Major studies for 3D echocardiography normal values
Variables Measur e Echo Machine Softwar e
Left ventricle Muraru (51,63,72) 2013, 2016
LV
, R
V, LA
GE V
ivid E9 (GE health car
e Chalfont, UK); Philips Ie33 (Philips
Health car
e, Best, The Netherlands)
(T
omT
ec Imaging Systems, Unterschleissheim, Germany) and
EchoPac BT13 (GE V
ingmed),
Chahal (50) 2013
LV
Philips IE33 (Philips Health car
e, Best, The Netherlands)
Q-Lab 5, Philips Medical System
Fukuda (52) 2012
LV
Sonos 7,500 and Philips IE33 (Philips Medical Systems, Andover
,
AM, USA), V
ivid 7 and V
ivid E9 (GE Medical Systems, Milwaukee,
WI, USa), SC2000 (Siemens Mountainview
, CA, USA), Artida
(T
oshiba Medical System, T
okyo, Japan)
QLAb for Sonos 7500 and IE33, EchoP
Ac (T omtec L V volume) for SC200 for V ivid 7 and V ivid E9, SC2000 W orkplace (eSie L VA) for
SC2000 and Advanced Car
diology Package for Artida.
Aune (58-59) 2010
LV
, LA, RA
Philips IE33 (Philips Health car
e, Best, The Netherlands)
3DQlab, Philips Ber nar d A (96) 2016 LV Vivid E9 ( GE V
ingmed, Horten, Norway) and Philips IE33 (Philips
Medical Systems, Andover
, MA, USA)
TomT
ec 4D-R
V Analysis, Unterschleissheim, Germany
Right ventricle Maf
fessanti (82)
2015
RV
Vivid E9 with 4V pr
obe (BT 11; GE V
ingmed, Horten, Norway) and
Philips IE33 with X3-1 pr
obe (Philips Medical Systems, Andover
,
MA, USA)
TomT
ec 4D-R
V Analysis, Unterschleissheim, Germany
Mitral valve Mihaila (47) 2014
MV
GE V
ivid E9 (GE health car
e Chalfont, UK); Philips Ie33 (Philips
Health car
e, Best, The Netherlands) 4V and 6VT pr
obes
4D autoL
VQ, EchoP
AC BT 12; GE V
ingmed ultrasound and
4D-MV Assessment version 2.3; (T
omtec Imaging System,
Unterschleissheim, Germany)
Sonne (45) 2009
MV
Sonos 7,500/(Philips, Andovber
, MA, USA)
Real V
iew
, YD, Nara, Japan
LA, left atrium; MV
, mitral valve; L
V, left ventricle; R
Figure 2 Screen-shots of EchoCardio-Norm. This application, available for Android smart-phones and personal computers running Windows, OS X, and LINUX, allows for automatic calculation of a broad range echocardiographic normal values for a given subject of a given age and gender.
significant increase with age (15,22). RA diameters (15), RV long-axis diameter (15,22), and RV mass (15) increase with age, while data on the RV area were contrasting, with a study reporting a slight increase (21) and other a decrease of the RV area (18).
Some studies (15,18,22,27) showed significant relations of cardiac measurements with gender. All chambers diameters, volumes and the LV mass were higher in men (15,18,21,22), even after correction for BSA (18), as well as great arteries (15,22,27). BSA correction however mitigated RA diameters and RA volume differences among gender and eliminated differences in LA volume (18). Furthermore, indexed LV diameters were greater in women (22). Of interest functional data, including LVEF (18,22), LV sphericity index, RV fractional area change (FAC), and the tricuspid annular plane systolic excursion (TAPSE) (22) were generally higher in women. However, other studies reported no significant difference in LVEF (15).
Different among descendent have been noted. The ECHO_NORMAL study (25) revealed how LV end-diastolic volume, LV end-systolic volume, and LV stroke volume (SV) were highest in Europeans and lowest in South Asians. Similarly LV diastolic diameter, LV end-systolic diameter, LA diameters and volumes were higher for Europeans than in East Asian, South Asian, and African counterparts.
B functional indexes
Consistencies and discrepancies in the way to measure among authors
As for dimensional indices, there was sufficient consistency in the way to acquire and analyses Pulse Doppler and tissue Doppler velocities that were accomplished according to recent guidelines and recommendations (4,5).
Correlation of cardiac measurements with age and gender
For Doppler Flow mitral inflow parameters reproducible variations with age were noted (16,20,23,30,69). The E wave deceleration time (EDT) has been shown to increase with age, while the E and E/A decreased with age (17,20,23,30,69). For tissue Doppler imaging (TDI) velocities a significant decrease in LV and RV function with age was noted authors (16,20,23,26) with a few discordance in particular for mitral valve a' wave. While a few studies (16,23) described an increase with age, other reported a
decrease (20,30). In contrast s' and e' decreased (16,23,30,69) and E/e increased with age (16,20,23,26). Similar variations were noted also for Doppler flow and TDI velocities measured at the tricuspid valve (16,23).
Pulsed Doppler velocities were higher in women (17,23,26) while EDT and isovolumic relaxation time (IVRT) were higher in men (23). No gender related difference emerged for the e' wave (16,23), while the s' and a' were detected to be higher in men (16,20,23), and the e/ e' in women (16,23). Aortic and pulmonary valve velocities were found to be higher in men (16).
3D echocardiographic parameters
Despite advances normative data on 3D echocardiography remain limited. For LV and LA volumes (51,52,58,59,95) the sample size employed was relatively limited for all the studies ranging from 166 (58,59) to 440 (95) healthy subjects. There are sufficient data for 3D RV volumes, particularly those deriving from a study of Maffesanti and colleagues (82), including 507 healthy subjects. Data for the mitral valve are limited and different parameters have been evaluated by various authors (45,47). 3D data of aortic parameters are also very limited (54-56).
Consistencies and discrepancies in the way to measure among authors
Data on LV and LA volumes (51,52,58,59,95) have been published by using consistent methodologies. Data on the other measurements are too limited to make comparison.
Correlation of cardiac measurements with age and gender and BSA
Left ventricular 3D volumes decrease with age even after normalisation for BSA but in a few studies these correlations were only weak (50,52,59). The decrease in LV 3D volumes with age was counterbalanced by an augment in LVEF with advancing age (50,59,95) as occurred also for RV (82). Relationships of left atrial 3D volumes were opposite to the ones observed for the ventricles. In fact, LA 3D volumes increased with age (52,58,81) accompanied by a reduction of LAEF with age (58). LV volumes and mass were higher in men even after normalisation for BSA (51,52,95). The lower volumes in women were counterbalanced by the higher LVEF, however, the stroke volume remained higher in men (51,95). 3DE LA volumes were larger in men compared to women (52,58,81) and showed moderate positive correlations with body size parameters (i.e., height,
weight, BSA, and body mass index; P<0.0001 for all) (81). LV volumes indexed by BSA was seen to be smaller in an Indian than a European population (50) while EF was similar between ethnicities. RV volume showed positive correlation with BSA, while EF decreases with an increasing BSA (82).
Comparison of 3D with 2D echocardiography and magnetic resonance imaging (MRI)
Comparison of measurements of atrial and ventricular volumes and functional indices by 3D versus 2D echocardiography provided contrasting results. Muraru et al. (81) showed that LA volumes measured by 3DE were 22% to 30% larger than the corresponding 2DE measures. The difference between 3DE and 2DE volumes was positively correlated with LA size measured by 3DE (r=0.36; P<0.0001), (81). LA total EF and passive EF measured by 3DE were also larger than 2DE. Conversely, expansion index was similar in this study (81). 2D echocardiography underestimated LV volumes (50,51) by an average of 2 and 4.7 mL/m2 for LVED and LVES, respectively (50). Regarding functional indices, Muraru et al. (51) reported that LVEF stroke volume measured with 3D echocardiography was smaller than measured with 2D while in the study of Chalal et al. (50) a difference between 2D and 3D EF was very limited. No differences instead emerged among 2D and 3D data for the sphericity index (51), while LV mass was shown to be lower in 3D than 2D measurements (51). Only the works from the Padua group, provided a validation cohort for RV 3D volumes with MRI (51,82). Demonstrating that RV 3D volumes were lower than MRI measured data (82), confirming previous observations (3).
Deformation analysis
In the last years, normative data on new indices of STE data have become available for the LV (60,61,63,66,67), the RV (72,73), the LA (68-70,74,77,79), and the RA (70-78). Some of the most recent publications evaluated 3D STE parameters (61,72,95), while data on twist and untwist are still limited (60).
Despite a good representation of different geographic areas with data coming from Europe (60,61, 63,67,77,78,95), North America (63,67,69,70,74) and Asia (79), nomograms were constructed by using limited sample sizes with only two studies (61,68) having >300 subjects and one having 1266 subjects (66), the latter evaluated only LV longitudinal
strain (ε). Data on LA ε are also extremely limited with only three studies having >100 subjects (71,84,94) and the widest population of 329 subjects (68). To overcome the lack of data, both for LVε (65) and for LA strain (65) meta-analytic works have been performed, despite the known limitations (6,10).
Consistencies and discrepancies in the way to measure among authors
Reproducible methodologies have been employed for LV 2D STE (60,61,66), while for atrial strain analysis differences emerged among authors (65). For longitudinal LV ε the 16 segments model excluding the apex has been generally used (60,61,66) while in some works whether the apex was excluded from calculation was not specified (67). The LA was analyzed by using a single projection (i.e., 4-chamber view, 6 segments scheme) (70,79), two projections (4- and 2-chamber views) (68,69,77,94), considering 12 segments (68,77,94), or 14 segments (69), or even by evaluating three projections (2- and 4-chamber view and long axis view, 15 segments scheme) (74). Notably, 2-chamber average peak atrial longitudinal ε (PALS) was significantly higher than in 4-chamber (P<0.0001) measurements, whereas there was no difference found between 2- and 4-chamber average time to peak longitudinal strain (P=0.93) (77).
Tacking quality was accomplished by using automated method (i.e., the automated QT score) (67,77) or more often subjectively (60,66,73,94). As summarised in Table S1 different vendors have been used to acquire measurements, despite GE was mostly employed with few exception (68,79) and usually vendor specific software has been employed for data analysis with a few exceptions (66,70,95). Despite no specific recommendation for RV STE, guidelines for chamber quantification (3) recommend to calculate the peak value of 2D longitudinal strain (Lε) as an average over the three segments of RV free wall in 4-chamber view. However, some authors evaluated peak and mean strain in 18 segments over three projections (4-chamber, 3-chamber inflow and 3-chamber outflow) (73) while others compared methods evaluating peak and mean values of 6 and 3 segments analysis in 4-chamber view with and without apical exclusion (72).
Correlation of cardiac measurements with age, gender, BSA and heart rate (HR)
Data on age related differences in strain values are contrasting but a few reproducible patterns may be observed. Longitudinal LV strain trends to decrease
with age measured both by 2D STE (61,66) and 3D STE (63) while circumferential strain increase (61,63,95). RV longitudinal strain age-related differences instead were small and not clinically relevant (72). Morris et al. (68) reported that LA ejection fraction, expansion fraction and strain were higher in younger, while systolic strain rate slightly higher in older adults. Furthermore, a decline of LA strain in the reservoir phase decrease with age was noted (68,69,79), while there were no differences seen in strain in the contractile phase.
Data on gender related differences of strain values are limited and inconsistent. Generally longitudinal and area strain (Aε) and strain rate (60,61,66) tend to be a bit higher in women while circumferential and radial strain showed no differences among gender (60,61). Overall men had lower 3D Lε, 3D Rε, and 3D Aε than women (51,95), although not in all age groups (51).
Regarding correlation with other confounders Marwick et al. (67) showed that weight, blood pressure (BP), Correlation of 2D and 3D LV strain with BP (50,51,60) have been demonstrated while HR correlated with 2D (50,60) but not 3D LV strain (51). For RV strain various demographic and cardiac parameters showed weak but significant correlations (72). No significant differences among gender emerged were noted in LA strain (65,68,69) and values were similar among Asian and European people (68). A decline of LA strain in the reservoir phase with increasing body size has been described in a recent meta-analysis evaluating major normative studies (65).
Conclusions
A great amount of adult echocardiographic nomograms, including data for 3D echocardiography and deformation indices, have recently become available. These nomograms present several strengths: cover almost all echocardiographic parameters, used consistent methodologies (i.e., inclusion/ exclusion criteria, data acquisition and the way to perform measurements), and cover multiple ethnic groups. However, some limitations still remain. A few studies (particularly those on 3D and deformation indices) used a limited sample size, and there are also limited data for some basic cardiac structure (i.e., for mitral and tricuspid valve, both in 2D and 3D measurements as well as for the aortic valve 3D dimensions), data of black persons are very limited (69,96), and studies evaluating differences among ethnicity are lacking. Wider, comprehensive, multi-ethnic nomograms,
which will fully evaluate old (i.e., 2D) and new parameters (i.e., 3D and deformation analysis parameters) are warranted.
Since the access to actual nomograms is often difficult and time consuming, we propose a software who automatic generate normative data for a given subject of a given age, weight, height and descent. This software should serve as a tool to orientate the clinician/sonographer in the difficult world of nomograms in a fast, accurate and reproducible way during routine clinical activity. Further researches are required to assess if a similar tool may allow to the clinician to save time and increase the diagnostic accuracy (as theoretically expected) (Figure 2).
Acknowledgements
None.
Footnote
Conflicts of Interest: The authors have no conflicts of interest to declare.
References
1. Rudski LG, Lai WW, Afilalo J, et al. Guidelines of the Echocardiographic Assessment of the Right Hart in Adults: A Report from the American Society of Echocardiography. J Am Soc Echocardiogr 2010;23:685-713.
2. Voigt JU, Pedrizzetti G, Lysyansky P, et al. Definitions for a common standard for 2D speckle tracking echocardiography: consensus document of the EACVI/ ASE/Industry Task Force to standardize deformation imaging. J Am Soc Echocardiogr 2015;28:183-93.
3. Lang RM, Badano LP, Mor-Avi V, et al. Recommendations for cardiac chamber quantification by echocardiography in adults: an update from the American Society of Echocardiography and the European Association of Cardiovascular Imaging. Eur Heart J Cardiovasc Imaging 2015;16:233-70.
4. Quiñones MA, Otto CM, Stoddard M, et al. Doppler Quantification Task Force of the Nomenclature and Standards Committee of the American Society of Echocardiography.Recommendations for quantification of Doppler echocardiography: a report from the Doppler Quantification Task Force of the Nomenclature and Standards Committee of the American Society of Echocardiography. J Am Soc Echocardiogr
2002;15:167-84.
5. Nagueh SF, Appleton CP, Gillebert TC, et al.
Recommendations for the evaluation of left ventricular diastolic function by echocardiography.J Am Soc Echocardiogr 2009;22:107-33.
6. Colan SD. The why and how of Z scores. J Am Soc Echocardiogr 2013;26:38-40.
7. Willis J, Augustine D, Shah R, et al. Right ventricular normal measurements: time to index? J Am Soc Echocardiogr 2012;25:1259-67.
8. Cantinotti M, Scalese M, Murzi B, et al. Echocardiographic nomograms for chamber diameters and areas in Caucasian children. J Am Soc Echocardiogr 2014;27:1279-92.e2 9. Mawad W, Drolet C, Dahdah N, et al. A review and
critique of the statistical methods used to generate reference values in pediatric echocardiography. J Am Soc Echocardiogr 2013;26:29-37.
10. Cantinotti M, Scalese M, Molinaro S, et al. Limitations of current echocardiographic nomograms for left ventricular, valvular, and arterial dimensions in children: a critical review. J Am Soc Echocardiogr 2012;25:142-52. 11. Nishimura RA, Otto CM, Bonow RO, et al. AHA/ACC
guideline for the management of patients with valvular heart disease: executive summary: a report of the American College of Cardiology/American Heart Association Task Force on Practice Guidelines. J Am Coll Cardiol 2014;63:2438-88.
12. Vahanian A, Alfieri O, Andreotti F, et al. Guidelines on the management of valvular heart disease (version 2012): the Joint Task Force on the Management of Valvular Heart Disease of the European Society of Cardiology (ESC) and the European Association for Cardio-Thoracic Surgery (EACTS). Eur J Cardiothorac Surg 2012;42:S1-44. 13. Davies RR, Gallo A, Coady MA, et al. Novel measurement
of relative aortic size predicts rupture of thoracic aortic aneurysms. Ann Thorac Surg 2006;81:169-77.
14. Lo RC, Lu B, Fokkema MT, et al. Relative importance of aneurysm diameter and body size for predicting abdominal aortic aneurysm rupture in men and women. J Vasc Surg 2014;59:1209-16.
15. Yao GH, Deng Y, Liu Y, et al. Echocardiographic Measurements in Normal Chinese Adults (EMINCA) StudyInvestigators. Echocardiographic measurements in normal chinese adults focusing on cardiac chambers and great arteries: a prospective, nationwide, and multicenter study. J Am Soc Echocardiogr 2015;28:570-9.
16. YaoGH, Zhang M, Yin LX, et al. Doppler
Echocardiographic Measurements in Normal Chinese
Adults (EMINCA): a prospective, nationwide, and multicentre study. Eur Heart J Cardiovasc Imaging 2016;17:512-22.
17. Saura D, Dulgheru R, Caballero L, et al. Two-dimensional transthoracic echocardiographic normal reference ranges for proximal aorta dimensions: results from the EACVI NORRE study. Eur Heart J Cardiovasc Imaging 2017;18:167-79.
18. Kou S, Caballero L, Dulgheru R, et al. Echocardiographic reference ranges for normal cardiac chamber size: results from the NORRE study. Eur Heart J Cardiovasc Imaging 2014;15:680-90.
19. Caballero L, Kou S, Dulgheru R, et al. Echocardiographic reference ranges for normal cardiac Doppler data: results from the NORRE Study. Eur Heart J Cardiovasc Imaging 2015;16:1031-41.
20. Daimon M, Watanabe H, Abe Y, et al. Gender differences in age-related changes in left and right ventricular geometries and functions. Echocardiography of a healthy subject group. Circ J 2011;75:2840-6.
21. Daimon M, Watanabe H, Abe Y, et al. Normal values of echocardiographic parameters in relation to age in a healthy Japanese population: the JAMP study. Circ J 2008;72:1859-66
22. Choi JO, Shin MS, Kim MJ, et al. Normal
Echocardiographic Measurements in a Korean Population Study: Part I. Cardiac Chamber and Great Artery Evaluation. J Cardiovasc Ultrasound 2015;23:158-72. 23. Choi JO, Shin MS, Kim MJ, et al. Normal
Echocardiographic Measurements in a Korean Population Study: Part II. Doppler and Tissue Doppler Imaging.J Cardiovasc Ultrasound 2016;24:144-52.
24. Pfaffenberger S, Bartko P, Graf A, et al. Size matters! Impact of age, sex, height, and weight on the normal heart size. Circ Cardiovasc Imaging 2013;6:1073-9.
25. Poppe KK, Doughty RN, Gardin JM, et al. Ethnic-Specific Normative Reference Values for Echocardiographic LA and LV Size, LV Mass, and Systolic Function: The EchoNoRMAL Study. JACC Cardiovasc Imaging 2015;8:656-65.
26. Dalen H, Thorstensen A, Vatten LJ, et al. Reference values and distribution of conventional echocardiographic Doppler measures and longitudinal tissue Doppler velocities in a population free from cardiovascular disease. Circ Cardiovasc Imaging 2010;3:614-22.
27. CantinottiM, Giordano R, Clemente A, et al. Strengths and Limitations of Current Adult Nomograms for the Aorta Obtained by Noninvasive Cardiovascular Imaging.
Echocardiography 2016;33:1046-68.
28. Biering-Sørensen T, Mogelvang R, de Knegt MC, et al. Cardiac Time Intervals by Tissue Doppler Imaging M-Mode: Normal Values and Association with Established Echocardiographic and Invasive Measures of Systolic and Diastolic Function. PLoS One 2016;11:e0153636. 29. Biering-Sørensen T. Cardiac time intervals by
tissue Doppler Imaging M-mode echocardiography: reproducibility, reference values, association with clinical characteristics and prognostic implications. Dan Med J 2016;63. pii: B5279.
30. Munagala VK, Jacobsen SJ, Mahoney DW, et al. Association of newer diastolic function parameters with age in healthy subjects: a population-based study. J Am Soc Echocardiogr 2003;16:1049-56.
31. Shojaeifard M, Esmaeilzadeh M, Maleki M, et al. Normal Reference Values of Tissue Doppler Imaging Parameters for Right Ventricular Function in Young Adults: a Population Based Study. Res Cardiovasc Med 2013;2:160-6.
32. Lauer MS, Larson MG, Levy D. Gender-specific reference M-mode values in adults: population-derived values with consideration of the impact of height. J Am Coll Cardiol 1995;26:1039-46.
33. Dwivedi G, Mahadevan G, Jimenez D, et al. Reference values for mitral and tricuspid annular dimensions using two-dimensional echocardiography. Echo Res Pract 2014;1:43-50.
34. Vasan RS, Larson MG, Benjamin EJ, et al.
Echocardiographic reference values for aortic root size: the Framingham Heart Study. J Am Soc Echocardiogr 1995;8:793-800.
35. Vriz O, Aboyans V, D'Andrea A, et al. Normal values of aortic root dimensions in healthy adults. Am J Cardiol 2014;114:921-7.
36. Mirea O, Maffessanti F, Gripari P, et al. Effects of aging and body size on proximal and ascending aorta and aortic arch: inner edge-to-inner edge reference values in a large adult population by two-dimensional transthoracic echocardiography. J Am Soc Echocardiogr 2013;26:419-27.
37. Son MK, Chang SA, Kwak JH, et al. Comparative measurement of aortic root by transthoracic
echocardiography in normal Korean population based on two different guidelines. Cardiovasc Ultrasound 2013;11:28.
38. Muraru D, Maffessanti F, Kocabay G, et al. Ascending aorta diameters measured by echocardiography using both
leading edge-to-leading edge and inner edge-to-inner edge conventions in healthy volunteers. Eur Heart J Cardiovasc Imaging 2014;15:415-22.
39. Roman MJ, Devereux RB, Kramer-Fox R, et al. Two-dimensional echocardiographic aortic root dimensions in normal children and adults. Am J Cardiol 1989;64:507-12. 40. Devereux RB, de Simone G, Arnett DK, et al. Normal
limits in relation to age, body size and gender of two-dimensional echocardiographic aortic root dimensions in persons ≥15 years of age. Am J Cardiol 2012;110:1189-94. 41. Campens L, Demulier L, De Groote K, et al. Reference
values for echocardiographic assessment of the diameter of the aortic root and ascending aorta spanning all age categories. Am J Cardiol 2014;114:914-20.
42. D'Oronzio U, Senn O, Biaggi P, et al. Right heart assessment by echocardiography: gender and body size matters. J Am Soc Echocardiogr 2012;25:1251-8. 43. Tamborini G, Marsan NA, Gripari P, et al. Reference
values for right ventricular volumes and ejection fraction with real-time three-dimensional echocardiography: evaluation in a large series of normal subjects. J Am Soc Echocardiogr 2010;23:109-15.
44. Leibundgut G, Rohner A, Grize L, et al. Dynamic assessment of right ventricular volumes and function by real-time three-dimensional echocardiography: a comparison study with magnetic resonance imaging in 100 adult patients. J Am Soc Echocardiogr 2010;23:116-26. 45. Sonne C, Sugeng L, Watanabe N, et al. Age and body
surface area dependency of mitral valve and papillary apparatus parameters: assessment by real-time three-dimensional echocardiography. Eur J Echocardiogr 2009;10:287-94.
46. Ormiston JA, Shah PM, Tei C, et al. Size and motion of the mitral valve annulus in man. I. A two-dimensional echocardiographic method and findings in normal subjects. Circulation 1981;64:113-20.
47. Mihăilă S, Muraru D, Piasentini E, et al. Quantitative analysis of mitral annular geometry and function in healthy volunteers using transthoracic three-dimensional echocardiography. J Am Soc Echocardiogr 2014;27:846-57.
48. Ostenfeld E, Flachskampf FA. Assessment of right ventricular volumes and ejection fraction by echocardiography: from geometric approximations to realistic shapes. Echo Res Pract 2015;2:R1-R11. 49. Poutanen T, Jokinen E, Sairanen H, et al. Left atrial and
left ventricular function in healthy children and young adults assessed by three dimensional echocardiography.
Heart 2003;89:544-9.
50. Chahal NS, Lim TK, Jain P, et al. Population-based reference values for 3D echocardiographic LV volumes and ejection fraction. JACC Cardiovasc Imaging 2012;5:1191-7.
51. Muraru D, Badano LP, Peluso D, et al. Comprehensive analysis of left ventricular geometry and function by three-dimensional echocardiography in healthy adults. J Am Soc Echocardiogr 2013;26:618-28.
52. Fukuda S, Watanabe H, Daimon M, et al. Normal values of real-time 3-dimensional echocardiographic parameters in a healthy Japanese population: the JAMP-3D Study. Circ J 2012;76:1177-81.
53. Buccheri S, Costanzo L, Tamburino C, et al. Reference Values for Real Time Three-Dimensional Echocardiography-Derived Left Ventricular Volumes and Ejection Fraction: Review and Meta-Analysis of Currently Available Studies. Echocardiography 2015;32:1841-50. 54. Calleja A, Thavendiranathan P, Ionasec R, et al.
Automated quantitative 3-dimensional modelling of the aortic valve and root by 3-dimensional transesophageal echocardiography in normals, aortic regurgitation, and aortic stenosis: comparison to computed tomography in normals and clinical implications. Circ Cardiovasc Imaging 2013;6:99-108.
55. Izumi C, Miyake M, Takahashi S, et al. Usefulness of real-time three-dimensional echocardiography in evaluating aortic root diameters during a cardiac cycle. J Echocardiogr 2012;10:8-14.
56. Park JS, Choi YW, Shin JS, et al. Validation of three-dimensional echocardiography for quantification of aortic root geometry: comparison with multi-detector computed tomography. J Cardiovasc Ultrasound 2011;19:128-33. 57. Fujimoto S, Mizuno R, Nakagawa Y, et al. Estimation
of the right ventricular volume and ejection fraction by transthoracic three-dimensional echocardiography. A validation study using magnetic resonance imaging. Int J Card Imaging 1998;14:385-90.
58. Aune E, Baekkevar M, Roislien J, et al. Normal reference ranges for left and right atrial volume indexes and ejection fractions obtained with real-time three-dimensional echocardiography. Eur J Echocardiogr 2009;10:738-44. 59. Aune E, Baekkevar M, Rødevand O, et al. Reference values
for left ventricular volumes with real-time 3-dimensional echocardiography. Scand Cardiovasc J 2010;44:24-30. 60. Kocabay G, Muraru D, Peluso D, et al. Normal left
ventricular mechanics by two-dimensional speckle-tracking echocardiography. Reference values in healthy adults.Rev
Esp Cardiol (Engl Ed) 2014;67:651-8.
61. Kleijn SA, Pandian NG, Thomas JD, et al. Normal reference values of left ventricular strain using three-dimensional speckle tracking echocardiography: results from a multicentre study. Eur Heart J Cardiovasc Imaging 2015;16:410-6.
62. Cantinotti M, Kutty S, Giordano R, et al. Review and status report of pediatric left ventricular systolic strain and strain rate nomograms. Heart Fail Rev 2015;20:601-12 63. Muraru D, Cucchini U, Mihăilă S, et al. Left ventricular
myocardial strain by three-dimensional speckle-tracking echocardiography in healthy subjects: reference values and analysis of their physiologic and technical determinants. J Am Soc Echocardiogr 2014;27:858-71.e1.
64. Yuan LJ, Takenaka K, Uno K, et al. Normal and shear strains of the left ventricle in healthy human subjects measured by two-dimensional speckle tracking echocardiography. Cardiovasc Ultrasound 2014;12:7. 65. Yingchoncharoen T, Agarwal S, Popović ZB, et al. Normal
ranges of left ventricular strain: a meta-analysis. J Am Soc Echocardiogr 2013;26:185-91.
66. Dalen H, Thorstensen A, Aase SA, et al. Segmental and global longitudinal strain and strain rate based on echocardiography of 1266 healthy individuals: the HUNT study in Norway. Eur J Echocardiogr 2010;11:176-83. 67. Marwick TH, Leano RL, Brown J, et al. Myocardial
strain measurement with 2-dimensional speckle-tracking echocardiography: definition of normal range. JACC Cardiovasc Imaging 2009;2:80-4.
68. Morris DA, Takeuchi M, Krisper M, et al. Normal values and clinical relevance of left atrial myocardial function analysed by speckle-tracking echocardiography: multicentre study. Eur Heart J Cardiovasc Imaging 2015;16:364-72.
69. Meel R, Khandheria BK, Peters F, et al. Left atrial volume and strain parameters using echocardiography in a black population. Eur Heart J Cardiovasc Imaging 2017;18:350-5.
70. Moustafa S, Zuhairy H, Youssef MA, et al. Right and Left Atrial Dissimilarities in Normal Subjects Explored by Speckle Tracking Echocardiography. Echocardiography 2015;32:1392-9.
71. Sun JP, Yang Y, Guo R, et al. Left atrial regional phasic strain, strain rate and velocity by speckle-tracking echocardiography: normal values and effects of aging in a large group of normal subjects. Int J Cardiol 2013;168:3473-9.
Method-Specific Reference Values for Right Ventricular Strain by 2-Dimensional Speckle-Tracking Echocardiography. Circ Cardiovasc Imaging 2016;9:e003866.
73. Forsha D, Risum N, Kropf P, et al. Right Ventricular Mechanics using a Novel Comprehensive Three-View Echocardiographic Strain Analysis in a Normal Population. J Am Soc Echocardiogr 2014;27:413-22. 74. Vianna-Pinton R, Moreno CA, Baxter CM, et al.
Two-dimensional speckle-tracking echocardiography of the left atrium: feasibility and regional contraction and relaxation differences in normal subjects. J Am Soc Echocardiogr 2009;22:299-305.
75. Spencer KT, Mor-Avi V, Gorcsan J, et al. Effects of aging on left atrial reservoir, conduit, and booster pump function: a multi-institution acoustic quantification study. Heart 2001;85:272-7.
76. Aurigemma GP, Gottdiener JS, Arnold AM, et al. Left atrial volume and geometry in healthy aging: the Cardiovascular Health Study. Circ Cardiovasc Imaging 2009;2:282-9.
77. Cameli M, Caputo M, Mondillo S, et al. Feasibility and reference values of left atrial longitudinal strain imaging by two-dimensional speckle tracking. Cardiovasc Ultrasound 2009;7:6.
78. Padeletti M, Cameli M, Lisi M, et al. Reference values of right atrial longitudinal strain imaging by two-dimensional speckle tracking. Echocardiography 2012;29:147-52. 79. Okamatsu K, Takeuchi M, Nakai H, et al. Effects of aging
on left atrial function assessed by two-dimensional speckle tracking echocardiography. J Am Soc Echocardiogr 2009;22:70-5.
80. Pritchett AM, Jacobsen SJ, Mahoney DW, et al. Left atrial volume as an index of left atrial size: a population-based study. J Am Coll Cardiol 2003;41:1036-43.
81. Badano LP, Miglioranza MH, Mihăilă S, et al. Left Atrial Volumes and Function by Three-Dimensional Echocardiography: Reference Values, Accuracy,
Reproducibility, and Comparison With Two-Dimensional Echocardiographic Measurements. Circ Cardiovasc Imaging 2016;9. pii: e004229.
82. Maffessanti F, Muraru D, Esposito R, et al. Age-, body size-, and sex-specific reference values for right ventricular volumes and ejection fraction by three-dimensional echocardiography: a multicenter echocardiographic study in 507 healthy volunteers. Circ Cardiovasc Imaging 2013;6:700-10.
83. Xu TY, Sun JP, Lee AP, et al. Left atrial function as assessed by speckle-tracking echocardiography in
hypertension. Medicine (Baltimore) 2015;94:e526 84. Lang RM, Badano LP, Tsang W, et al. EAE/ASE
recommendations for image acquisition and display using three-dimensional echocardiography. Eur Heart J Cardiovasc Imaging 2012;13:1-46.
85. Geffré A, Friedrichs K, Harr K, et al. Reference values: a review. Vet Clin Pathol 2009;38:288-98.
86. Siest G, Henny J, Gräsbeck R, et al. The theory of reference values: an unfinished symphony. Clin Chem Lab Med 2013;51:47-64.
87. Williams K, Thomson D, Seto I, et al. StaR Child Health Group. Standard 6: age groups for pediatric trials. Pediatrics 2012;129 Suppl 3:S153-60.
88. Thompson W, Endriss J. The required sample size when estimating variances. The American Statistician 1961;15:22-3.
89. Kish L. In: Survey Sampling. John Wiley & Sons, Inc., New York, 1965.
90. Haycock GB, Schwartz GJ, Wisotsky DH. Geometric method for measuring body surface area: a height-weight formula validated in infants, children, and adults. J Pediatr 1978;93:62-6.
91. DuBois D, DuBois EF. A formula to estimate the approximate surface area if height and weight be known. Arch Intern Medicine 1916;17:863-71.
92. Lang RM, Bierig M, Devereux RB, et al. Recommendations for chamber quantification: a report from the American society of echocardiography’s guidelines and standards committee and the chamber quantification writing group, developed in conjunction with the European association of echocardiography, a branch of the European society of cardiology. J Am Soc Echocardiogr 2005;18:1440-63. 93. Lopez L, Colan SD, Frommelt PC, et al.
Recommendations for quantification methods during the performance of a pediatric echocardiogram: a report from the Pediatric Measurements Writing Group of the American Society of Echocardiography Pediatric and Congenital Heart Disease Council. J Am Soc Echocardiogr 2010;23:465-95.
94. Yang WI, Kim JS, Kim SH, et al. An exaggerated blood pressure response to exercise is associated with subclinical myocardial dysfunction in normotensive individuals. J Hypertens 2014;32:1862-9.
95. Bernard A, Addetia K, Dulgheru R, et al. 3D echocardiographic reference ranges for normal left ventricular volumes and strain: results from the EACVI NORRE study. Eur Heart J Cardiovasc Imaging 2017;18:475-83.
96. EI Missiri AM, EI Meniawy K, Sakr SA, et al. Normal reference values of echocardiographic measurements in young Egyptian adults. The Egyptian Heart Journal 2016:209-15.
97. Application designed by Infotel FTGM named Echocardio-Normal Values. Available online: https:// play.google.com/store/apps/details?id=org.mpsoftware. CardioNorm
Cite this article as:Cantinotti M, Giordano R, Paterni M, Saura D, Scalese M, Franchi E, Assanta N, Koestenberg M, Dulgheru R, Sugimoto T, Bernard A, Caballero L, Lancellotti P. Adult echocardiographic nomograms: overview, critical review and creation of a software for automatic, fast and easy calculation of normal values. J Thorac Dis 2017;9(12):5404-5422. doi: 10.21037/jtd.2017.11.26